


Assessment of the Impact of Cargo Throughput on Port Productivity in Warri Seaport, Delta State, Nigeria
Obasi C Catherine*
Department of Marine Economics and Finance, Faculty of Marine Transport and Logistics Management, Nigeria
Submission: May 26, 2022; Published: June 03, 2022
*Corresponding author: Obasi C Catherine, Department of Marine Economics and Finance, Faculty of Marine Transport and Logistics Management, Nigeria
How to cite this article: Obasi C C. Assessment of the Impact of Cargo Throughput on Port Productivity in Warri Seaport, Delta State, Nigeria. Ann Rev Resear. 2022; 7(3): 555714. DOI: 10.19080/ARR.2022.07.555714
Abstract
The research work set out to assess the impact of cargo throughput on port productivity in Warri Port in the pre-concession and post-concession era, spanning 2000 to 2020, with main focus on productivity, measured from annual cargo throughput. Concession arrangement which started in 2006 was a business strategy by the Government to cede management of the Nigerian ports to private companies for more efficient management. The study formulated and tested hypothesis in using moving average of time series analytical tools. Secondary data of annual cargo throughput obtained from the Statistics Department of NPA Warri, were analyzed. The test revealed that cargo throughput and productivity of the port increased in the post-concession period of 2006 to 2020 relative to the pre-concession period of 2000 to 2020, leading to the rejection of the null hypothesis and acceptance of their alternatives. This indicated that the port become more efficient in infrastructural development and operational management due to the concession arrangement. The study recommended curbing insecurity in and around the port to encourage importers’ patronage and also dredging the Escravos bar to allow passage for larger vessels to the port. It went further to suggest some areas of further study among which is the one that borders on a comparative analysis of the impact of wet cargo against dry cargo in the operational performance of the Warri port.
Keywords: Cargo Throughput; Port; Productivity; Post concession; Pre-concession
Abbreviations: NPA: Nigerian Port Authority; MMAT: Model for Modified Moving Average; TSA: Time Series Analysis; CTpost: Production Post Concession Period; CTpre: Production Pre-Concession Period
Introduction
Maritime activities all over the world could be seen as a major lifeline of any coastal state. Lee & Johnson (2012) put it that efficiency is the ability to deliver products or services cost effectively without sacrificing quality. Nigerian Port Authority was created as an autonomous public corporation by the ports Act 1954 (cap 155 of the federation of Nigeria). The enabling statutes have been amended several times. The substituting law is the Nigerian Port Authority Decree NO. 38 of 1999. The Nigerian Port Authority (NPA) has made remarkable progress since its inception in 1955. The need for reconstruction after the civil war and the resultant port congestions of the 70’s led to a massive port development in 1-ie country, it led to the construction of modern port facility in Lagos, Calabar, Warri, Port-Harcourt, and Sapele. At the completion of the development program, the NPA in Warri is responsible for smooth running of Warri port which is the main subject of study. The structural and operational inefficiencies in the Nigerian Port System initiated the need for port reform. Prior to the port reforms/concession agenda, Nigeria ports were overregulated which resulted to loss of cargo and traffic and diversion of shippers to the neighboring countries like Cotonou, Obaban [1]. Since the inception of port concession in Nigeria especially relative to Warri Port, no significant attempt has been made to evaluate the efficiency and productivity of the port system relative to the pre-concession era. This present study will assess port productivity in Warri port using cargo throughput index.
Literature Review
Measuring port performance and productivity
Ports are essentially providers of service activities, in particular for vessels, cargo and inland transport. According to Musso et al. (2012), the degree of satisfaction that is obtained on the basis of pre-set port standards will indicate the level of port performance achieved. From the foregoing it is already obvious that port performance levels will be different depending on measurement criteria utilized in the system. Thus, a port, at least in theory, may offer a very satisfactory service to vessel operators and at the same time be judged inefficient by cargo interests and inland transport operators (or vice versa). It is obviously more likely that poor performance will not be limited to one group of port users, but rather pervade all services offered by the port. The important lesson to learn from this is that port performance cannot be assessed on the basis of a single value or measure. In fact, a meaningful evaluation of a port’s performance will require sets of measures relating to: the duration of a ship’s stay in port (turnaround time of ship in port), the quantity of the cargo— handled over a period-cargo throughput, the quantity of cargo handled by a gang over a period and the volume of ship traffic handled over a period/berth occupancy ratio.
According to Meersman et al. (2010), port actors look at productivity from many angles eg shippers or owners of goods look at productivity from the angle of minimizing the generalized cost including time. Also, the freight forwarders look at productivity in port relative to cost reduction while shipping companies look at port productivity relative to profit maximization or improvement. The private port operators refer to port productivity as increased ship traffics which will yield maximum profit through port dues reduction etc. The complicating factor is the strong interrelationship that exists between port efficiency and port productivity. Thus, it is virtually impossible and certainly inappropriate to study each of these in isolation. However, because of the particular importance of the first three sets, and their dominant position with respect to the main port users (namely the ship operators, the shippers and private port operators), this study will mainly concentrate on a more detailed discussion of these first three. Port productivity could be derived from these discussions as improved performance over a given period. It is a ratio between port performance output over an input resource eg time, labour, gang, capital asset such as crane etc. In the given circumstances, it is of crucial importance to agree on a basic and common methodology. Hence in the following section an attempt will be made to formulate generally acceptable notions, before analysing the factors determining port performance and productivity then suggesting methods of measuring and comparing through a generally agreed system of port statistics and indicators. According to Emeghara [2] productivity is an extension of efficiency that is, the increase in output when input or cost of production remains constant. In other words, productivity is the ratio of output increase when input is steady. Fourgeaud [3], notes that, in addition to technical performance, shippers and ship owners are looking for: Reliability, Competitive and predictable cost and cargo handling quality, and adaptability and responsiveness. Nye [4], defines “efficiency” as improved performance and productivity or improved performance over a period eg (containers per hour, man-hours per move). Nye notes that automation is not a goal in itself, but a means of striking the best balance between capacity and productivity, relative to cost effectiveness and optimization goal). Le-Griffin & Murphy [5] note the problem in comparing terminals with and without large transshipment volumes. Since transshipments generate two ship moves for a single container yard transaction. Terminals with large volumes of transshipments show an inflated TEU count. Despite noting this comparability problem, the authors do not attempt to correct the problem in their comparisons. As they state, TEU/ acre data “are of limited value in making straight comparisons of productivity.” There is also some confusion in the survey between container moves per hour and cranes per vessel, and between annual throughput and moves per crane. Their survey makes two particularly useful observations. Choi [6] proposed an approach for combined productivity optimization that focuses on mean equipment waiting times. In a case study, this approach was used to isolate a bottleneck between the transfer cranes and yard tractors.
Turnaround Time
Since the introduction of containerized vessel, public keeps on arguing turnaround time for vessel towards container terminal. Movement of good via vessel needs to be arrived destination as soon as possible. That is why faster turnaround time in terminal could accelerate the voyage. Therefore, turnaround time is really a serious matter to be considered for container terminal. Shippers are looking for a port which could provide fast turnaround time, when they could reduce voyage as maximum as possible. For port container terminal, it is very vital to have fast turnaround time for vessel. The cycle for operation in terminal is not only involved between vessel and equipment, but it also involves all aspects (from management to operation) in port container terminal itself. Therefore, anything happens in terminal area will affect operation as a whole. However, the ways to mitigate the problem truly depend on the management because human runs machine. The significance of vessel turnaround time to port container terminals can be expressed like what Cram & Baker (2001) said No single cause more directly affects the cost of living of a maritime country than the speed with which ships are turned round in her ports”. Furthermore, lesser vessel turnaround time means no congestion and reduces port stay for vessel. As a result, there is no queuing before vessel can berth. When talking about no queuing and congestion means throughput for port container terminal relatively will increase [7-15].
Quay Crane Productivity and Vessel Turnaround Time
A container terminal is a complex area and its work under
multiple operational objectives to complete the process. Murthy
et al. (2004) highlight the most critical performance measure for
rating the terminals is the ship turnaround time or the port time
of the ship. It means the average time the terminal takes to unload
and load a docked vessel, its follow by the average QC rate, which is the quay cranes’ throughput measure during a period, given by 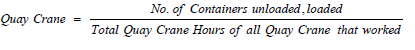 Modernization of port container terminal must be parallel with
the way’s terminal operates their port. There is no point to have
state-of-the-art facilities, without having world class productivity.
Modernization of port container terminal must be parallel with
the way’s terminal operates their port. There is no point to have
state-of-the-art facilities, without having world class productivity.
Cargo of Output; an Indicator of Productivity
The cargo output provides information on the total quantity of work done in a particular period or on the tonnage handled in a stated time. In ports the most commonly used indicators of output are:
a) Berth throughput
b) Ship output
c) Gang output
The latter two values are obviously also measuring of productivity and efficiency, with the last one constituting the most frequently used indicator of productivity.
Method of Data Analysis
As part of the process for undertaking this research, the study made use of quantitative techniques to analyze the data collected and collated. The first stage of this approach is the identification of port performance indicators. The analysis starts with setting a clear normative definition of operational performance, then an attempt was made to relate port productivity with performance measurement indices such as turnaround time of ship in the port, port cargo throughput, ship traffic volume, gang outputs over the pre-concession and post concession periods. In other words, the following qualitative and quantitative measures of port performance were relevant:
i. Total Tonnage Handled or cargo throughput over the two periods being investigated was mainly used for the work.
ii. Gang Productivity averages for two periods i.e. pre and post concession.
iii. Container Traffic.
iv. Ship Turn Around Time for the two periods.
v. Number of vessels that entered the port.
The study couldn’t attempt to work on the other productivity measurements such as gang-productivity, container traffic productivity, ship turnaround, ship traffic volume due to time and financial constraints. In other words, the study concentrated on cargo throughput productivity. The above measures can be calculated thus:
Port productivity = Total tonnage in post concession period relative to Total Tonnage pre concession period.
There is productivity if cargo throughput is higher during the post concession relative to the pre-concession period. Ie CTpre < CTpost
where CTpre = Production pre concession period
CTpost = production post concession period
Similar masseurs could be said of turnaround time of ships at the ports over the two periods, ship traffic volume for the port over the two periods etc.
Tools for data analysis (Time Series Analysis)
In any study the need to use an appropriate statistical tool to analyze the data collected cannot be over-emphasized. The study which hovers around productivity assessment in Nigeria ports pre and post concession eras will make use of an optimization technique to analyze the data. The optimization method hovers around time series most especially moving average. Time series is an optimization technique that looks at productions or services rendered over a long period. It could also be used as a forecasting model to predict the future. Time series as a forecasting model could also give or establish the mathematical relationship between the pre concession period and the post concession era. There are many other models used in a relative forecasting study globally such as regression analysis, gravity model etc. For this study the choice of moving average an aspect of time series is obvious as it tries to establish the mathematical relations between the pre concession and post concession period. In other words, the choice of modified moving averages is based on the need to understand the productivity situation over the two periods for comparison. With this model, the study could predict the productivity levels in the coming years ahead. The modified moving average as an optimization technique recognizes the presence of error terms in any projection analysis. However, in planning you must have a figure to plan for rather than planning without a figure. Projection makes room for a planner or service provider to make adequate provision for the future. Hence projecting cargo throughput, ship traffic volume, turnaround time for warri ports complex will enable management to plan ahead. This will enable management to make adequate manpower capacity building and cargo handling equipment provision to actualize the expected productivity [16- 30].
The modified moving average technique
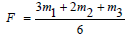
The model for modified moving average (MMAT) which is an aspect of Time Series Analysis (TSA) is thus
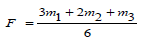
Where m1 = latest years info
m2 = infor from 2 yrs ago
m3 = info from 3 yrs ago
The essence of the moving average is to enable the user to draw a smooth curve from which projection or prediction could be made, A moving average helps in smoothening the up and down graph often visualized in time series analysis.
Hypothesis
There is no significant difference between cargo throughputs in post concession period relative to pre concession period using cargo throughput in warri Port Complex.
Four years moving average trend
In order to have a trend from which predictions or forecasting could be made, we, have to establish a trend using four years moving averages as seen on column 4. To establish productivity or improvement in efficiency, cargo throughput or output started from 2765546tonnes in 2002, climbed to 4,601,424 tonnes in 1995. It noses dried to 2,860,800 tonnes in 2003 and 2,956,323 in 2004. The cargo throughput declined in 2005 with 2,749,944tonnes. The downward trend continued to post concession period in 2009 with 2,544,688tonnes. For the post concession period, when the private operators had come in with better cargo, handling equipment in both quality and quantity performance improvement was not significant till in 2010, cargo throughput stood at 2,702,685tonnes. The following year 2011, there was improved efficiency or performance as cargo throughput climbed to 2,941,524tonnes. In 2012, output climbed to 4,454,539tonnes. From then cargo-throughput rose up to its pick of 10,148,601tonnes in 2019 through declined in 2020 with throughput of 8,521,277tonnes.
Modified Moving Average
To strengthen the smooth curve for forecasting purpose the study made use of the modified moving averages which is represented by the model see column 5.
Hypothesis Testing
The null hypothesis states that there is no significant difference between the cargo throughput calculated for the pre and post concession periods. The alternative hypothesis will then read that there is a significant difference when post concession cargo throughput is higher than the pre-concession (Figure 1). Consequently from (Table 1), since the four year moving averages for post concession periods stood at 2,389,847.5, 2,941,524, 6,366,055, 6,716,762 and 8,521,277 tonnes as against the pre-concessions periods moving averages of 2,765,545 and 2,749,943.5 tonnes respectively, the study accepted the nullhypothesis that there is a significant difference between the postconcession period and the pre-concession period.

Source: NPA (Warri Port Complex). Modified by the researcher.

Conclusion
The availability of infrastructural facilities in port signifies efficiency and productivity. An efficient port means a productive port or service centre. Port productivity signify economies of scale just as economics of scale means reduced cost of operation which if transferred to port users in form of lower freight charges and port charges means improvement in the standard of living of the society. The study also concludes that concession of Nigerian ports had led to availability of more cargo handling equipment in both quality and quantity just as seen from the previous studies reviewed. In other words, globally concession of services centres such as ports always ushers in service efficiency and productivity.
Recommendations
It is worthy to note that the coming into the scene of private port operators has ushered in improvement in port productivity, but much need to be done to bring in port friendly operations and services. This turn of event will definitely arrest the problem of ship and cargo diversions to neighbouring ports of Benin republic, Togo and Ghana. The operations of the private port investors should be monitored to ensure that they are actually bringing in more funds to purchase or provide more port facilities. This is to check the abuse of charging high port dues or cargo handling fees. The private investors aim at making profit to the highest level. This, they may do without commensurate performance. Charging high port dues to ships and as well as high cargo handling dues may also lead to ship and cargo diversion to neighbouring ports if not checked. To ensure better port performance or productivity, the private ports operators should invest in better information management technologies (ICT) as well as retraining of her manpower capacity.
References
- Obaban MI (2006) Privatization and Commercialization of Public Enterprises in developing countries, the case of Nigeria.
- Emeghara GC, Obed, Ndikom BC (2012) A critical appraisal of port reform and development policy in Nigeria. Research in Business and Management 1(1): 13-22.
- Fourgeaud P (2009) Measuring Port Performance. The World Bank, infoMARE Forum of Shipping and Logistics.
- Nye (2009) Advanced Technology in Terminal Design.
- Griffin L, Murphy (2006) Container Terminal Productivity: Experiences at the Ports of Los Angeles and Long Beach.
- Choi (2005) Analysis of Combined Productivity of Equipments in Container Terminal Chung, (2003) Port Performance Indicators.
- Ashar A (2005) Productivity and Capacity of Container Terminals. Worldwide Shipping, October/November.
- Beskovnik B (2008) Measuring and Increasing the Productivity Model on Maritime Container Terminals. Pomorstvo 22(2): 171-183.
- Chad Syverson (2011) What Determines Productivity. Journal of Economic Literature 49(2): 326-365.
- Langen D, Vander Horst MR (2007) Port Performance Indicator Imports Journal of Maritime Research 4(1): 23-36.
- Langen D, Ngdam MN, Vander Horst MR (2007) Strategy Map and Performance indicators for Ports and Authorities.
- Emeghara GC (2008) A perceptual Assessment of the delay factors in the Nigeria port operation. A PHD thesis of Federal University of Technology Owerri (Transport Management).
- Estache A, Gonzalez M, Trujillo L (2002) Efficiency gains from port reform and the potential for yardstick competition: lesson from Mexico. World Development 30(4): 545-560.
- Hilde Meersman, Eddy Van De Voorde, Thierry Vanel Slander (2014) Port infrastructure finance. 1st Edition, Informa Law from Routledge pp. 264.
- Hilde Meersman, Eddy Van De Voord, Thierry Vanel Slander (2008) Future challenge for the port and shipping sector. 1st Edition, by Informa Law from Routledge pp. 196.
- Liu J, Yip T, Yan J, Sun X (2009) Container Port Productivity and Port Policy Evaluation. CY Tung International Centre for Maritime Studies, Hong Kong Polytechnic University, China.
- Zinan L (2005) The comparative performance of public and private enterprises: the case of British ports.
- Loggerenberg van B, Cucchiaro S, Bazil J (1982) Productivity Measurement and the Bottom Line.1(1): 87-99.
- MARAD (1998) Improving Productivity in US Marine Container Terminal.
- Mongelluzzo Bill (2009) The Productivity Principle p. 23-24.
- Mundel ME (1983) Improving Productivity and Effectiveness. Prentice-Hall, Inc.
- Notteboom T, Coeck C, Van Den Broeck J (2000) Measuring and explaining the relative efficiency of container terminals by means of Bayesian Stochastic Frontier Models. International Journal of Maritime Economics 2: 83-106.
- Nze ON (2011) Assessment of the Productivity of the Nigerian Shipping Industry an unpublished M. Sc. thesis, submitted to the Transport Management Technology Department, Federal University of Technology, Owerri.
- Obed Ndikom BC (2006) The kernel concept of Shipping Operation Policies and Strategies. Lagos pp. 493.
- Obed, Ndikom BC (2018) A critical Assessment of port privatization policy and port productivity in Nigeria Maritime Industry. A Greener Journal of Environmental Management and Public safety.
- Olaogbebikom JE, Njoku I, Faniran AO, Enosko Okoko (2014) Performance Evaluation of Nigeria port: Pre and Post cocession Eras. CIVIC and Environmental research.
- Labajos P, Blanco (2004) Competitive policies for commercial seaports in the E. U. Maritime policy 28(6): 553-556.
- Productivity Commission (2002) International Benchmarking of Containers Stevedoring.
- Sumanth D (2004) Productivity Measurement and Evaluation Models for Manufacturing Companies. Illinois Institute of Technology pp. 291.
- Talley W (2007) Port Performance: An Economics Perspective. Research in Transportation Economics, Elsevier pp. 499-516.


