Effect of Linear and Non-Linear Estimation of Fish Mortality on Feed Conversion Rate and Economic Profitability of Oreochromis shiranus in Cages
Phiri Francis1,2*, Singini Wales2, Kapute Fanuel2 and Jere Bob2
1Department of Fisheries, Chisitu Fisheries Research Station, Africa
2Department of Fisheries and Aquatic Sciences, Mzuzu University, Africa
Submission: July 27, 2018; Published: August 24, 2018
*Corresponding author: Phiri Francis, Department of Fisheries, Chisitu Fisheries Research Station, Chisitu, Mulanje, Malawi, Africa, Po Box: 105, Tel: +265888358737/+265999606727, Email: phraphiri@yahoo.co.uk
How to cite this article: Phiri F, Singini W, Kapute F, Jere B. Effect of Linear and Non-Linear Estimation of Fish Mortality on Feed Conversion Rate and Economic Profitability of Oreochromis shiranus In Cages . Ann Rev Resear. 2018; 3(2): 555606. DOI: 10.19080/ARR.2018.03.555606
Abstract
This study was conducted to investigate the effect of linear and non-linear methods of estimating fish mortality on feed conversion ratio (FCR) and profitability of cage cultured Oreochromis shiranus (Makumba). Two treatments were used, designated as T1 and T2 and were replicated three times. In each cage, 105000 fish were stocked at an initial average body weight of 1.59±0.04g and cultured for 365 days. The fish was fed twice a day with formulated feed (36% Crude Protein) at 4-1% body weight with feed adjustments based on standing biomass from linear and non-linear estimated mortality. The results showed that there were significant differences between the two treatments on FCR

Keywords: Feed conversion ratio, Profitability, Linear, Non-linear, Mortality, Oreochromis shiranus
Introduction
Fish catches in Malawi’s natural waters have experienced a sharp decline over the past decades, and as reported by Morgan in [1] sustainability of the fish stocks is not likely, given the demand for fish in the country. This development contributed to the increased emphasis on developing aquaculture as a major source of fish and rural income. Aquaculture now occupies a strategic position in the fisheries sector in Malawi. Development of a viable and sustainable cage aquaculture industry has therefore been identified by the Government of Malawi (GoM) as a flagship programme [2]. According to Balarin & Haller as reported [3] fish growth in aquaculture is a result of several factors such as proper doses of fertilizer application, regular feeding, optimum stocking density, maintenance of physico-chemical factors, disease prevention and various control measures. The success of cage culture production as in all forms of aquaculture systems is therefore dependent on fish survival rate and how fast the fish grows to table size with reduced production inputs. Fish like any other living organism undergo several life series events among which growth and risks to life are. Fish in its lifetime is exposed to and must overcome several risks including: predation, starvation, disease and theft, all of which result into fish mortality [4]. Fish losses in cage culture come about due to death (mortality) escapes and theft. According to [5] fish can die at any time within the culture period, but small fish are more vulnerable to cannibalism, bird predation, water quality imbalance, and disease than larger fish. This means that majority of the mortality occurs in small fish as compared to bigger fish. Fish mortality rate (MR) is often established using the estimated numbers method by use of historic records [6]. This can be expressed as linear and non-linear method of estimating mortality. In Malawi, like with most farmers in the region, fish mortality is estimated using linear method, where it is assumed that fish die at a constant rate along the production cycle. However, in non-linear estimation method, mortality is high at juvenile stage and almost insignificant at adult stage/table size. As reported by [6] feed requirements are calculated based on estimated standing biomass in the cage. This biomass is determined taking into account mortality levels along the production period. Most Malawian farmers using the estimated numbers method, experience a 30% mortality rate in their cages.
Use of enough feeds that can be fully ingested and utilized by the fish is of paramount importance in commercial as well as small scale aquaculture. Feed wastage through application of excess feed based on poor stock assessment or cage biomass projections has contributed to loss of feed and consequently high production costs. The key challenge has been, and continue to be poor estimation of fish feed, which is caused by miscalculation of mortality or fish loss which in turn affect feed conversion ratios as well as farm economic performance. Over-estimation of feed emanating from underestimation of fish mortality can result in higher FCR values, while under-estimation of feed from overestimation of fish mortality results into unrealistic FCR values. Most farmers in Malawi use linear estimation of fish mortality, where mortality is believed to occur throughout the culture period at a constant loss-rate. Use of linear estimation method can bring over-estimation of the standing-crop biomass hence an over-estimation of feed during calculation of feed rations, resulting into high feed conversion ratios. This is counterproductive and can lead to abandonment of fish culture due to high economic losses. The present study used FCR in analysing productivity due to its direct linkage and capacity to estimate feed (input) potential in attaining fish growth (output). The study also used gross margin analysis to assess profitability potential of the mortality estimation methods since gross margin use variable costs to estimate the profitability prospect of an enterprise against its revenues by looking at whether an enterprise will cover its production costs. Therefore, the aim of the study was to investigate the effect of linear and non-linear estimation of fish mortality on feed utilisation and economic performance of Oreochromis shiranus in cages.
Material and Methods
Area of study
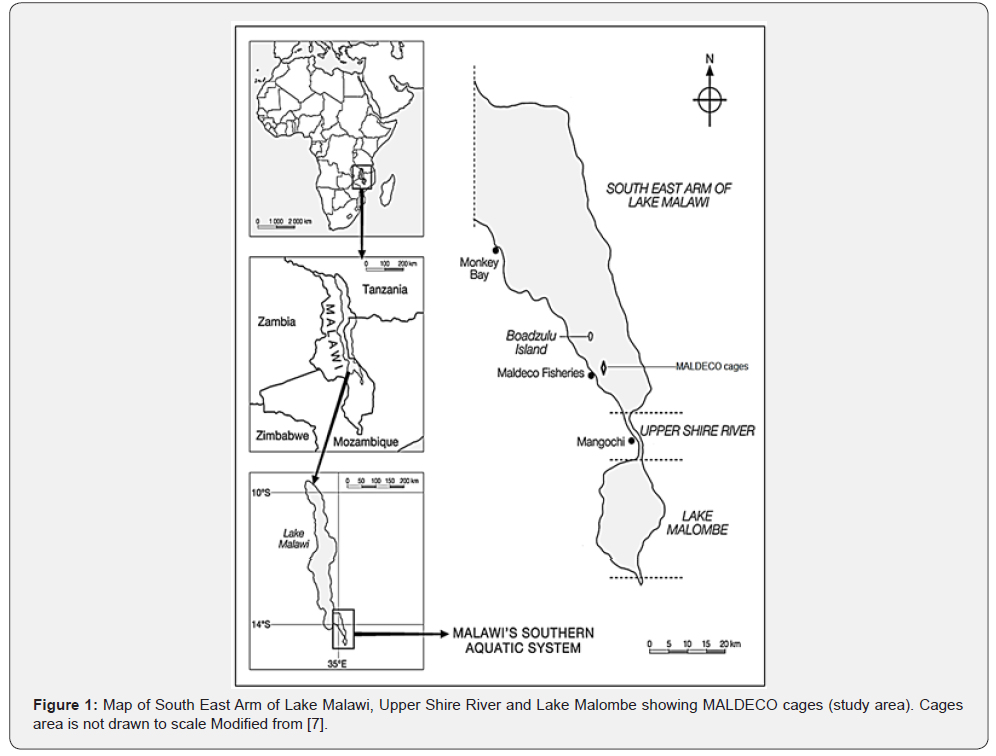
The study was conducted between December 2011, and January 2013 at the Malawi Development Corporation (MALDECO) Aquaculture Ltd in Mangochi District, Southern Malawi Figure 1. MALDECO lies at a latitude of 19º19.982΄S, and a longitude of 35º09.149΄E.

Study design
The study used secondary data collected by MALDECO Aquaculture Limited. Six floating cages of 14.7m diameter and approximately 6m depth were stocked, each with 105,000 Oreochromis shiranus fingerlings of 1.59±0.04g average body weight (ABW) placed in Lake Malawi. The fish was subjected to two treatments where in T1 fish mortality was estimated using linear method, while in T2 fish mortality was estimated using non-linear method. Standing fish biomass was used to calculate approximate feed requirements in each of the respective cages. The treatments were replicated three times, and the fish was cultured for a period of 365 days.
Feeding of experimental fish
The fish was fed in the morning and afternoon at 9:00hrs and 14:00hrs respectively, with formulated feed of 36% crude protein (CP) from MALDECO Aquaculture’s Feed Milling Section. Feeding rate was adjusted from 4% of total body weight during the first and second month, to 3% of total body weight for the third and fourth month, and 2% of total body weight for the fifth, sixth and seventh month and finally 1% of total body weight for the remainder of the culture period. Feed was administered by broadcasting and was presented as dry pellets.
Data collection
MALDECO collected data on fish mortality, weight of fish feed used, fish growth, production costs and fish sales. Data on fish mortality and feed was collected on daily basis, while data on growth and production costs was collected on monthly basis. Data on fish sales was collected at the end of the production cycle. Fish mortality was monitored twice every day during feeding trips and divers were monitoring fish carcasses that sunk to the bottom of the cage once every week. The initial total body weight of the fish (kg) was recorded at the time of stocking, and the fish was sampled to monitor fish growth every last day of the month. Fish growth data was used as a mechanism to dictate adjustments in feeding rates respective of average body weight. To avoid biasness, fish samples were collected by random sampling. Numbers of fish dying were recorded on daily basis throughout the research period and this assisted in adjusting feed requirements in the cages respective of standing biomass. The sampling exercise was conducted early in the morning between 6.00hrs and 9.00hrs. A seine net was used to seine fish from the cages to get a representative sample, while a scoop net was used to get fish samples from the seined fish which was batch-weighed using a standard weighing scale. A sample size of 500 fish from each cage was used at every sampling interval, and batch weights were used to calculate average body weight. After 365 days of culture, all the fish in the cages was harvested. The fish was counted to calculate total mortality figures, and final body weight was measured to determine fish growth.
Data Analysis
Growth indices were estimated using the following formulas:
Mean weight gain (MWG)

Where: WT2 is final mean weight of fish at time T2, WT1 is initial mean weight of fish at time T1.
Mortality Rate (MR) %

Where: M is natural mortality, N is number of fishes stocked.
Feed Conversion Ratio (FCR)

Where: F is amount of feed used (g), MWG is Mean Weight Gain.
Economic indicators were calculated using the following: -
Gross Margin (GM)

Where: TR is Total Revenue, TVC is Total Variable Cost.
Return to Variable Cost (RVC)

Where: GM is Gross Margin, TVC is Total Variable Cost.
Break-even Yield (BEY)

Where: TVC is Total Variable Cost, P is Price of product (output).
Break-even Price (BEP)

Where: TVC is Total Variable Cost, Y is Yield (output).
Data was entered and analysed using Statistical Package for Social Scientists (SPSS) version 16.0. Microsoft (Ms) excel 2007 was used to generate graphs. Hypothesis testing was done by Chi-Square test at 95% confidence interval.
Results
Growth performance
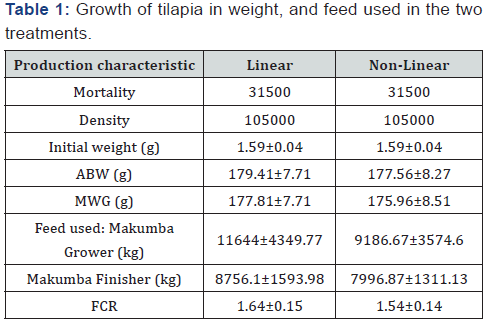
To assess feed efficiency in the two treatments, various production characteristics were calculated using Equations 1-3, and presented in Table 1. Fish growth over the experimental period was not different despite fish being subjected to different treatments in estimation of mortality.

Values = Mean± SE
Feed Conversion Ratio
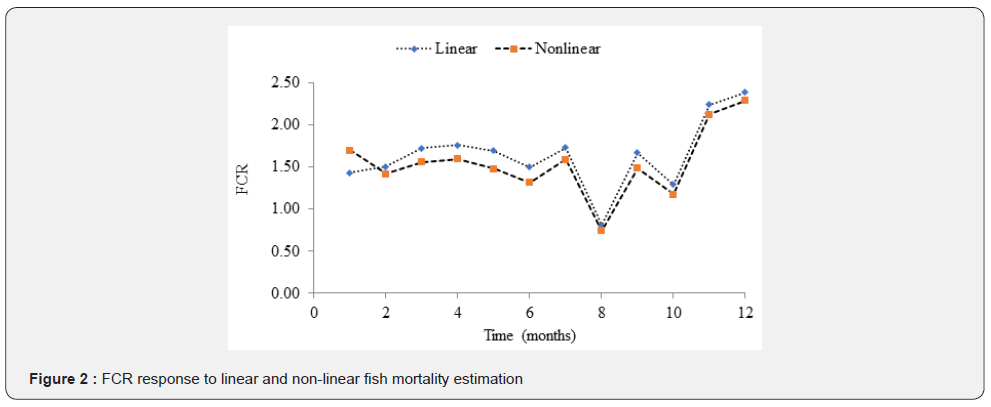
Figure 2 present results of calculated FCRs to evaluate effect of the two treatments on feed efficiency.
Chi-square test results showed that there were significant variations in FCR between linear (1.64±0.15) and non-linear


Profitability
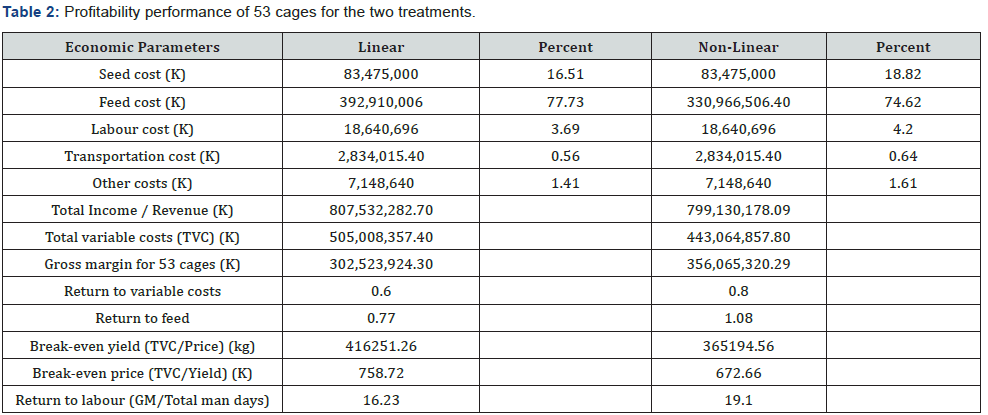
To assess effect of linear and non-linear estimation of mortality on the profitability of O. shiranus, economic performance parameters for the 53 cages were estimated and calculated using Equation 4-7 as presented in Table 2. Profitability analysis results through enterprise budgeting showed that feed for linear treated cages accounted to 77.73% of total variable costs, while for non-linear cages feed contributed 74.62% to total variable costs. Linear treatment produced a yield of 10.47kg/m3 and to break even, the harvested biomass needed to exceed 6.54kg/m3 for linear, against 5.74kg/m3 for nonlinear treated cages which produced a yield of 10.36kg/m3. T2 registered a bigger Gross Margin of MK356,065.29 for a return to total variable cost of 80% and return to feed of 108% on a realised revenue of MK799,130,178.09, compared to a Gross Margin of MK302,523,924.30 for a return to total variable cost of 60%, and a return to feed of 77% on revenues of MK807,532,281.70 for T1. Chi-Square results showed significant effects of linear and nonlinear mortality estimation on gross margin,


Discussion
Effect of mortality estimation methods on FCR
Results from effect of mortality estimation methods on FCR showed that there were significant differences between use of linear and non-linear methods . This demonstrates that mortality estimation methods affect feed conversion ratios of fish in cages. These results suggest that use of non-linear fish mortality estimation methods result into significant changes in the calculated feed conversion ratio in cage cultured O. shiranus. Specifically, the results suggest that when adjusting fish feed based on non-linear method of estimating fish mortality which on average reduces fish feed by 15.77%, the fish used statistically lower amount of feed to grow 1kg of fish muscles. This agrees with [8] who suggested that overfeeding wastes feed and result into higher FCR. The differences in feed between the two treatments, can be attributed to overestimation of biomass during the first three months of culture in linear treated cages where mortality rate was higher in non-linear (28.37%) than in linear (7.5%). This agrees with [9] who also found that FCR is affected by miscalculation of mortality estimates. However, the yielding of lower FCR by non-linear method, as reported by Bhijkajee & Gobin in [10] suggests efficient food utilization through the extraction of more nutrients from the food and converting it into flesh. The recorded FCR agrees with what was earlier reported that FCR for Tilapia in cages range from 1.4 to 2.5 [9].
Effect of mortality estimation methods on profitability
The results from effect of mortality estimation methods on profitability showed that there were significant differences between use of linear and non-linear methods

Conclusion
From this study, “the effect of linear and non-linear estimation of mortality on feed conversion rate and profitability of Oreochromis shiranus cultured in cages”, which was to investigate on the lack of efficient fish mortality estimation method, it can be suggested that use of non-linear method, has significant effect on feed conversion ratio by yielding lower FCR than linear method. On the objective of assessing profitability calculated based on linear and non-linear mortality estimation methods in cage cultured O. shiranus, the study also concludes that non-linear method has significant effect on profitability by yielding more profits than linear method. Therefore, for the attainment of profit-oriented cage culture, farmers must aim at lowering feed conversion ratios and reducing production costs to bring about increased profits by ensuring conscious estimation of fish mortality to reduce miscalculation of feed.
Acknowledgements
The authors would like to give special thanks to Dr Daniel Jamu (then Aquaculture Manager) and Management and staff of MALDECO Aquaculture Ltd for their support in making the study a success.
References
- Harley A (2009) Exploring the possibilities of a sustainable cage culture system in Lake Malawi. Ecological Aquaculture Studies and Reviews. Kingston RI, University of Rhode Island, USA.
- (2011) World Fish Centre Cage culture in Malawi.
- Bangladesh Fisheries Society (2011) Effect of stocking density on growth and production performance of tilapia (Oreochromis niloticus L.) in ponds.
- Zydlewski B (2012) Mortality.
- Auburn University (2002) Fish Mortality Management BMP No. 13 [Internet] Alabama Aquaculture Best Management Practice.
- Killian HS, Heikes D, Van Wyk P, Masse M, Engle C (1998) Inventory assessment methods for aquaculture ponds. Southern Regional Aquaculture Centre Publication No. 395.
- Hara M (2006) Restoring the chambo in Southern Malawi: Learning from the past or re-inventing the wheel? Aquatic Ecosystem Health and Management Volume 9(4): 419-432.
- Beveridge MCM (2004) Cage Aquaculture. (3rd edn.), Oxford, Blackwell Publishing Ltd, UK.
- Ofori JK, Dankwa HR, Brummett R, Abban EK (2009) Producing Tilapia in small cage in West Africa. WorldFish Centre Technical Manual, No. 1952, pp.16, Penang, The WorldFish Centre, Malaysia.
- Dill A (2010) The effect of stocking density and supplementary feeding on growth performance and yield of Nile tilapia Oreochromis niloticus (L, 1758) in cage culture in Wonji Reservoir, Ethiopia. MSc thesis, Addis Ababa University School of Graduate Studies, Ethiopia.
- Pomeroy R (2003) Aquaculture record keeping. Fact sheet, University of Connecticut, US.


