


Temperature and Rainfall Trends in North Eastern Ethiopia
Wagaye Bahiru Abegaz1* and Endalew Assefa Abera2*
1 National Meteorology Agency of Ethiopia, Ethiopia
2 Ethiopian Institute of Agricultural Research, Ethiopia
Submission: July 15, 2020; Published: August 10, 2020
*Corresponding author: Wagaye Bahiru Abegaz, National Meteorology Agency of Ethiopia, P.O. Box: 94 Kombolcha, Ethiopia Endalew Assefa Abera, Ethiopian institute of Agricultural Research, Ethiopia
How to cite this article: Wagaye B A, Endalew A A. Temperature and Rainfall Trends in North Eastern Ethiopia. Int J Environ Sci Nat Res. 2020; 25(3): 556163. DOI: 10.19080/IJESNR.2020.25.556163
Abstract
North eastern Ethiopia is one of the sensitive regions to climate variation particularly to temperature and rainfall changes. Rainfall and temperature are one of the most determinant climate patterns for the study area because more than 80% of the area’s agriculture is reliant on rain-fed. The main aim of this study was to investigate trends in temperature and rainfall in the annual, seasonal and monthly time scale at Kombolcha and Dessie Meteorological stations. The daily rainfall and temperature data were collected from National Meteorological Agency of Ethiopia. The Mann–Kendall test and Sen’s slope estimator were used to assess rainfall and temperature trends. The Mann-kendall test revealed that anon- significant decreasing rainfall trend was observed during February to March and September at Kombolcha and during January to March and September at Dessie stations. The rainfall trends showed decreasing in belg while increasing in both kiremt and bega season at both stations. However, the detected trends are non-significant. Both maximum and minimum temperature revealed that statistically significant decreasing trends in annual and seasonal time scale at Dessie station while at kombolcha station a significant increasing trend of maximum temperature was observed at both annual and seasonal time scale. On the other hand, anon- significant warming trend of minimum temperature was observed during annual and kiremt time scale but a non-significant decreasing trend was experienced during bega and belg season at kombolcha station. Increase in temperature and decrease in amount of rainfall may have a negative impact on crop production and soil water balance. Therefore, this study could have an important role in identifying possible present and future production strategies.
Keywords:Rainfall; Temperature; Trend analysis; Mann-kendall test
Introduction
Temperature and precipitation are two most important climate parameters that are most studiedin climate research because of their immediate impact in various socioeconomic sectors (e.g. agriculture and hydrology), including human comfort (sayemuzzaman 2014). The changes in temperature and rainfall patterns are widely observed in many semi-arid parts of the developing world that are likely to become even hotter and dryer with time (Collier et al. 2008). Inter-annual variability of precipitation and rising trends of temperature has observed (Meze 2004, Seleshi & Zanke 2004). Developing countries in East Africa like Ethiopia may experience greater variability of precipitation and evapotranspiration [1]. Principally, climate is one of the most important factors among the leading factors for vulnerability, in most parts of Ethiopia [2]. Hence, Ethiopia has been described as one of the most vulnerable countries to climate change in Africa [3].
Climate change is manifested in terms of increasing temperature and change in intensity and pattern of rainfall [4]. Increasing or decreasing of average annual temperatures and rainfall are most likely due to climate change [5]. IPCC [6] also confirmed that a change in precipitation was due to change in climate. According IPCC [7] report, the mean global surface temperature is become increasing. Many authors argue that the causes of increasing global surface temperature may be the alteration of the hydrological cycle at global and local scales [8,9]. However, the change in rainfall and temperature patterns is not globally uniform [10]. Many parts of the world, particularly countries in sub-Saharan Africa, are affected by global warming owing to the changing in temperature and precipitation patterns [3,11]. The rising temperature and variability in rainfall pattern have direct impact on crop production and food security [12]. Literature states that the coming decades will have experienced in higher temperature and change in precipitation intensity, and this may cause crop yield reduction in many countries in the world [6,13].
The northern part of Ethiopia is affected by climate change and variability [14,15], coupled with high rainfall variability [16]. In Ethiopia, the average annual minimum and maximum temperatures have increased by about 0.25oC and 0.1oC every ten years respectively [4]. The higher temperature accelerates the evapotranspiration process that creating moisture stress, and this becomes more severe regarding yield losses if it occurs during the canopy formation [17]. Therefore, the main objective of this study is to detect the trend, magnitude and inter-annual variability of rainfall and temperatures over North Eastern Ethiopia.
Material and Methods
The study area description
The study was conducted at Kombolcha and Dessie sites in North Eastern parts of Ethiopia. The Kombolcha and Dessie sites are situated in 11.08°N, 39.72°E and 11.13°N, 39.14°E respectively. The altitudes are ranged from 1842-1915 and 2470-2553m above sea level for Kombolcha and Dessie sites, respectively (Figure 1). Based on current studies, kombolcha and Dessie sites receive a mean annual rainfall ranging from 725.1 to 1361.6mm and 851.3 to 1612.6mm respectively. The mean annual temperature varies from 18.7 to 20.90c and 14.8 to 19.3 0c at Kombolcha and Dessie, respectively.

Data sources
Daily rainfall data (1983-2019), Maximum and minimum temperature (1985-2019) were collected from the National Meteorological Agency of Ethiopia (NMA). Missing values were patched using Markov chain simulation model of INSTAT v.3.36 [18]. Quality control check was also done for maximum and minimum daily temperature values by running a macro automatic check [18].
Methods of data analysis
The daily observed climate data were arranged in day of year (DOY) format for processing. The data was analyzed using INSTAT, XLSTAT, 2016 and Excel spread sheet tools. Both descriptive and Mann-Kendall trend test were computed in order detect the trends, directions and magnitudes as well the inter-annual variability of rainfall and temperatures. Descriptive statistical, such as minimum, maximum, mean, standard deviation, and coefficient of variation were computed using simple Excel spreadsheet, whereas the trend, directions, magnitudes and significances were determined using Mann-Kendall trend test, Kendall’s tau and Sen’s slope estimator (Mann 1945) [19].
The Mann-Kendall’s test
Mann-Kendall’s test is a non-parametric method, which is less sensitive to outliers and test for a trend in a time series without specifying whether the trend is linear or nonlinear (Partal 2006; Yenigun 2008).

Where xj and xi are the sequential precipitation values in months j and i (j> i) and N is the length of the time series. A positive S value indicates an increasing trend and a negative value indicates a decreasing trend in the data series.
The variance of S, for the situation where there may be ties (i.e., equal values) in the x values, is given by as:
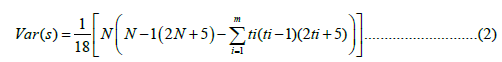
Where, m is the number of tied groups in the data set and ti is the number of data points in the ith tied group for n larger than 10.
The standard normal ZMK test statistic is computed as follows (Partaland Kahya 2006)
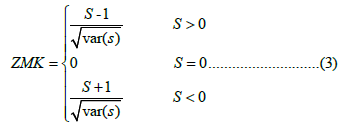
The presence of a statistically significant trend is evaluated using the ZMK value. In a two-sided test for trend, the null hypothesis Ho should be accepted if | ZMK | < Z1-α/2 at a given level of significance. Z1-α/2 is the critical value of ZMK from the standard normal table.
Sen’s slope estimator test
The magnitude of trend is predicted by the Sen’s estimator. The slope (Ti) of all data pair computed as (Sen 1968). This test is applied in cases where the trend is assumed to be linear, depicting the Quantification of changes per unit time.

Where Xj and Xk are considered as data values of time j and k (j>k) correspondingly, the median of these N values of Ti is represented as Sen’s estimator of slope which is given a

Positive value of Qi indicates an upward or increasing trend and a negative value indicates downward or decreasing trend in the time series.
Result and Discussion
Characteristics of rainfall
The temporal variations of mean monthly, seasonal and annual rainfall at Kombolcha and Dessie meteorological stations are presented in Figure 2 and Table 1. Kombolcha and Dessie stations have received the maximum rainfall about 280.4mm and 318.7mm respectively during August and July (Figure 2). Except the four months (Dec, Jan, Feb and Mar), all other months received a considerable amount of rainfall in the two stations (Figure 2). The annual total rainfall was varied from 725.1mm to 1361.6mm with a mean of 1037.6mm at Kombolcha station, while from 851.3mm to 1612.6mm with a mean of 1191.7mm at Dessie station in the last 3 decades.


Refer Table 2 for the corresponding values for Belg and Bega seasons. The coefficients of variation for rainfall at Kombolcha were varied moderately with CV of 14.8% in annual and19.75% in Kiremt rainy season, while it was extremely varied with 43 and 68.3% during Belg and Bega season respectively. This result agrees with the finding of [20,21]. Both stations were experienced with bimodal rainfall pattern, where much of the rainfall concentrated in the main rainy season (June-September) and a small amount of rainfall occurred the second rainy season (February-May). The season from October to January is a relatively dry season (Figure 2).

Temporal variability of temperature
Minimum temperature is high during June and July at Kombolcha and Dessie areas respectively while that of low is during November and December in the previous order. The highest maximum temperature was occurred in the month of June and the low was in the month of December and January at both stations (Figure 3). The annual maximum temperature was varied from 25.5℃ to 28℃ and 22.9℃ to 26.2℃ at Kombolcha and Dessie stations respectively. Similarly the annual minimum temperature was varied from 11.8℃ to 13.7℃ and 6.6℃ to 12.4℃ at Kombolcha and Dessie stations respectively (Table 2). As far as temporal seasonal variation is concerned, high maximum and minimum temperature is recorded during Kiremt (June-September) season for both stations. The coefficient of variation showed that both maximum and minimum temperature is more variable at Dessie station than Kombolcha (Table 2).


Rainfall trends
A summary of the monthly, seasonal and annual rainfall trend analysis at Kombolcha and Dessie stations are shown in Table 3 & 4. The rainfall trend is decreasing and non-significant (P>0.05) during the month of February to April and September at Kombolcha station. Similarly, at Dessie station, the trends were decreasing and non-significant in the month of January to March and September. The rainfall trend was significantly increase by 2.3mm per month at Kombolcha station, while increased by 0.17mm per month during August at Dessie station (Table 4). The seasonal rainfall trend was increasing by 4.2mm/season at Kombolcha and by 2mm per season at Dessie station during Kiremt (Table 4). Whatever there were increasing or decreasing trend, the detected trends were not statistically significant in most of the months and seasons over both stations. Insignificant annual rainfall trends may be due to high inter-annual variability. In general, the rainfall trend was increased during the Kiremt and Bega season and it was decreased during the Belg season at both stations. However no significant trend was detected for seasonal rainfall distribution (Table 4).

Trends of temperature
The maximum temperature trend was significantly increasing and decreasing at Kombolcha and Dessie station in all months (Table 5).
Significant increasing trend of maximum temperature (0.09ºC/month) was observed during March and April while the minimum temperature trend was increasing significantly during April to November at Kombolcha station. On the other hand, the minimum temperature trend showed in decreasing trend throughout the months at Dessie station (Table 5).


Anon- significant minimum temperature trend was increasing by 0.002 and 0.01ºC/season at Kombolcha station during annual and Kiremt time scale respectively (Table 6). Solomon et al. [22] come across with an increasing trend in annual maximum and minimum temperature at Lake Tana by a factor of 0.141oc and 0.423oc per year respectively. In case of Belg and Bega season, decreasing trend of minimum temperature was detected at Kombolcha (Table 6). The mean annual and seasonal temperature have shown a significant increasing trend at kombolcha station (Table 6). This is supported by Woldeamlake & Conway [20] annual and kiremt rainfall showed significant increasing trend at Dessie and Labella whereas significant decreasing trend was observed at Debre Tabor. On the contrary a significant decreasing of annual and seasonal mean temperature was observed at Dessie station. The magnitude of the increasing trend of the annual and Kiremt maximum temperature compared to the minimum temperature at Kombolcha areas indicates higher daytime evaporative demand and therefore a higher water requirement for crops [23,24].
Conclusion
The trend of climatic variables with their fluctuation and variability of rainfall and temperature in the kombolcha and dessie sites were analyzed. The study area is vulnerable and susceptible to climatic fluctuation and variability; the climatic trend is more likely to result in an increase in the number and severity of natural disaster. Rainfall and temperature are one of the most determinant climatic patterns for the study area because more than 80% of the study area’s agriculture is reliant on rain fed. Increased temperature and changes in rainfall amounts will increase occurrence of drought and flood events. Hence, increase in temperature and decrease in rainfall amount may have a negative impact on crop production and soil water balance.
Anon–significant decreasing trends of rainfall was observed during February, March, April and September at Kombolcha while during January, February, March and September at Dessie station in the entire study periods. The annual rainfall was increased with the rate of 0.1mm per year at Kombolcha and decreased by 0.56mm per year at Dessie station. Although the increasing and decreasing trends were observed, the detected trends were not statistically significant for both stations regarding to rainfall. On the other hand, the maximum temperature was increased significantly at Kombolcha and decreasing at Dessie station for all months. Similarly, the minimum temperature was decreased significantly in all months at Dessie station. In the annual and seasonal time scales, the maximum temperature has shown an increasing trend at Kombolcha and decreasing trend at Dessie station. Moreover, a non-significant increasing of minimum temperature was observed by 0.002 and 0.01ºC/year at Kombolcha station during annual and kiremt time scale respectively. The analysis results provide further knowledge to improve our understanding on climate variability and change and would be useful for future planning and management of water resources safely in the study area. In general, the study reveals decreasing rainfall amounts and warming trends across kombolcha than dessie sites because kombolcha is the hometown of different industries and factories which causes for air prolusion. Hence, information generated by this study could be beneficial to agricultural and water recourses planning and management especially in semi-arid environment were adaptability to climate variability and change is still low. Therefore, the concerned stakeholders should take into consideration the rainfall and temperature changes of the study area into their climate change adaptation strategy.
Acknowledgment
The authors thank the National Meteorological Agency of Ethiopia (NMA) for providing all the data used for this study.
References
- IPCC (2012) Managing the Risks of Extreme Events and Disasters to Advance Climate Change Adaptation. In: A Special Report of Working Groups I and II of the Intergovernmental Panel.
- WFP (2014) Climate risks and food security in Ethiopia: analysis of climate impacts on food security and livelihoods. WFP, Rome.
- Conway D, Schipper EL (2011) Adaptation to climate change in Africa: challenges and opportunities identified from Ethiopia. Global Environmental Change 21(1): 227-237.
- National Meteorological Agency (NMA) (2007) Climate Change National Adaptation Programme of Action (NAPA) of Ethiopia.Ministry of Water Resources National Meteorological Agency. NMA Addis Ababa, Ethiopia.
- Meybeck A, Lankoski J, Redfern S, Azzu N, Gitz V (2012) Building resilience for adaptation to climate change in the agriculture sector. Proceedings of a Joint FAO/OECD workshop, food and agriculture organization.
- IPCC (2007) Climate Change 2007: Impacts, Adaptation, and Vulnerability Contribution of Working Group II to the Third Assessment Report of the Intergovernmental Panel.
- IPCC (2014) Climate Change 2014: Synthesis Report. Contribution of Working Groups I, II and III to the Fifth Assessment Report of the Intergovernmental Panel on Climate Change. In: Pachauri RK, Meyer LA (Eds.), IPCC, Geneva, Switzerlan, p. 151.
- Arnell NW (2004) Climate change and global water resources: SRES emissions and socio- economic scenarios. Global Environmental Change 14(1): 31-52.
- Held IM, Soden BJ (1995) Robust responses of the hydrologic cycle to global warming. J Clim 19: 5686-5699.
- Parry ML, Canziani OF, Palutiko JP, VLinden V, Hanson CE (2007). Technical Summary. Climate Change 2007: Impacts, Adaptation and Vulnerability. Contribution of Working Group II to the Fourth Assessment Report of the Intergovernmental Panel on Climate Change.IPCC Technical report. Proceedings of the National Academy of Sciences, UK, Cambridge University Press. pp. 23-77.
- Kløve B, Ala-Aho P, Bertrand G, Gurdak JJ, Kupfersberger H, et al. (2014) Climate change impacts on groundwater and dependent ecosystems. Journal of Hydrology 518: 250-266.
- FAO (2010) Food Security. Policy Brief, Food and Agriculture Organization, Agricultural and Development Economics Division.
- Stige LC, Stave J, Chan KS, Ciannelli L, Pettorelli N, et al. (2006) The effect of climate variation on agro-pastoral production in Africa. United States of America 103(9): 3049-3053.
- Hadgu G, Tesfaye K, Mamo G (2015) Analysis of climate change in Northern Ethiopia: implications for agricultural production. Theor Appl Climatol 121: 733-747.
- Araya AB (2011) Coping with Drought for Food Security in Tigray, Ethiopia. Ph.D. Thesis, Wageningen.
- Araya A, Stroosnijder L (2011) Assessing drought risk and irrigation need in Northern Ethiopia. Agric Meteorol 151(4): 425-436.
- Warrick RA, Gifford R, Parry ML (1986) CO2, climatic change and agriculture. In the Greenhouse Effect, Climatic Change and Ecosystem. In: Bolin B, Doos BR, Janger J, Warrick RA (Eds.), Wiley: Chichester, pp. 393-473.
- Stern R, Rijks D, Dale I, Knock J (2006) Instat climate guide. UK: Statistical Service Center, University of Reading.
- Kendall MG (1975) Rank Correlation Measures; Charles Griffin: London, UK.
- Bewket W, Conway D (2007) A note on the temporal and spatial variability of rainfall in the drought‐prone Amhara region of Ethiopia. International Journal of Climatology 27: 1467-1477.
- Mohammed Y, Yimer F, Tadesse M, Tesfaye, K (2018) Variability and trends of rainfall extreme events in north east highlands of Ethiopia. Int J Hydro2(5): 594-605.
- Addis S, Selassie Y, Fissha G, Gedif B (2015) Time series trend analysis of temperature and rainfall in lake Tana Sub-basin, Ethiopia. Environmental Systems Research 4(25).
- National Meteorological Services Agency (2001) Report Submitted to Initial National Communication of Ethiopia to the United Nations Framework Convention on Climate Change (UNFCCC), Addis Ababa, Ethiopia.
- Solomon S (2007) Climate Change 2007 - the Physical Science Basis: Working Group I Contribution to the Fourth Assessment Report of the IPCC (Vol. 4). Cambridge University Press, Cambridge, UK.


