Abstract
DNA intercalators are critical anticancer agents that exert their effects by inserting between DNA base pairs, disrupting essential cellular processes such as replication and transcription. In this study, 24 known intercalators were systematically investigated using molecular docking and molecular dynamics (MD) simulations to evaluate their binding affinity and stability with a canonical DNA duplex (sequence: 5’-TGATCA-3’). Docking studies using AutoDock 4.2 revealed that van der Waals interactions predominantly drive intercalator binding, with several compounds exhibiting strong binding energies, notably Molecule 16 (–10.02 kcal/mol), Molecule 14 (–9.32 kcal/mol), and Molecule 6 (–9.03 kcal/mol). The six top-performing complexes were further subjected to 500 ns MD simulations using the DESMOND platform. RMSD, RMSF, and radius of gyration analyses confirmed the structural stability and compactness of these ligand-DNA complexes. The results provide critical insight into the structural dynamics of intercalation and identify promising scaffolds for further development as DNA-targeted anticancer therapeutics.
Keywords:DNA Intercalators; Anticancer Agents; Molecular Docking; Molecular Dynamics Simulation; Ligand-DNA Interactions
Introduction
The structure of DNA remained unknown until 1953, when Watson and Crick, using X-ray diffraction data obtained by Rosalind Franklin, proposed the now-famous double helix model [1]. While the most common form of double-stranded DNA is the “B” form—characterized by a right-handed helix—they revealed that DNA can adopt multiple three-dimensional conformations. The DNA backbone consists of alternating sugar and phosphate groups, with each sugar attached to a nitrogenous base. These bases pair specifically through hydrogen bonds, forming the rungs of the helical ladder. The precise base pairing in their model suggested a clear mechanism for the replication of genetic material [2]. This discovery established that DNA possessed sufficient structural versatility to serve as the molecule of heredity [3]. Because DNA can undergo structural changes that influence transcription and replication, it has become a key target for anticancer drugs and is considered a highly promising biological receptor in the development of chemotherapeutic agents [4,5].
Noncovalent DNA-binding molecules are broadly classified into two main categories: intercalators and groove binders. DNA intercalators are small ligands with planar aromatic structures that insert themselves between adjacent base pairs of the DNA double helix, effectively “sliding” between the stacked bases. This intercalation disrupts the helical structure and interferes with DNA replication, making these compounds common in chemotherapeutic drugs. In contrast, groove binders interact with the minor groove of DNA with minimal distortion of the helix [6-9].
The concept of intercalation was first proposed by Lerman in 1961, who demonstrated that acridine dyes could noncovalently insert between DNA base pairs through hydrophobic, ionic, hydrogen bonding, and van der Waals interactions [10]. Ionic interactions, particularly between the positively charged nitrogen of the acridine ring and the negatively charged phosphate backbone, further stabilize this binding. Intercalation induces notable structural changes in DNA: the helix unwinds, stiffens, and lengthens by approximately 3.4 Å per intercalation event due to alterations in sugar-phosphate torsional angles [11,12]. This unwinding reduces the helical twist and separates base pairs near the binding site to fewer than 36 per turn.
A critical limitation of intercalation is the “neighbor exclusion principle,” which states that intercalators cannot bind at every adjacent site along the DNA due to the structural distortions they cause. As a result, intercalation typically occurs at alternate sites along the helix [13-15]. The binding is largely driven by π-π stacking interactions between the intercalator’s aromatic rings and the flanking DNA bases [16,17]. Additional stabilizing forces include van der Waals interactions, hydrogen bonding, and charge transfer effects [18-20]. Since electrostatic interactions significantly contribute to binding affinity, many synthetic intercalators carry a positive charge [21]. Intercalation leads to conformational modifications in DNA, including helix unwinding, elongation, and base pair separation [22-24]. These changes can inhibit key biological processes such as transcription, replication, and repair, making intercalators potent mutagens and candidates for anticancer drug development. Most intercalators are small, rigid, planar aromatic compounds, and because their binding relies heavily on π-π stacking and electrostatics, many—like ethidium bromide and proflavine— lack sequence specificity [25,26]. Importantly, the structural adaptation of DNA to accommodate an intercalator reflects an induced-fit binding mechanism [27].
To achieve this goal, we selected a set of 24 DNA–intercalators from the literature. Following the optimization of docking parameters, the binding of these intercalators to the DNA sequence 3’-(TGATCA)₂-5’ was evaluated using AUTODOCK. The software’s ability to reproduce experimentally observed binding modes was tested across multiple configurations, varying the placement of the docking grid relative to the DNA structure. Furthermore, molecular dynamics (MD) simulations and energy minimization were employed to generate conformations of canonical B-DNA that provide suitable binding sites for accurate docking of intercalators using AUTODOCK.
Materials and Methods
In this study, the 3D crystal structure of a DNA duplex (PDBID: 224D) [28] was obtained from the RCSB Protein Data Bank and prepared using the Auto DockTools. The structure features the DNA sequence 5’-D(TGATCA)-3’ co-crystallized with the intercalator ligand Nogalamycin. A comprehensive search of the Protein Data Bank identified 24 DNA–ligand complexes involving intercalators Table 1, which were selected for further studies. Following ligand preparation, molecular docking was carried out using a grid centered on the upper half of the DNA duplex. The top six docked complexes were subsequently subjected to molecular dynamics (MD) simulations to assess the stability and binding interactions in greater detail.

Molecular docking
Molecular docking studies were performed using AUTODOCK4.2, a program that applies an empirical scoring function based on the free energy of binding [29,30]. AUTODOCK4.2 employs both genetic and simulated annealing algorithms to identify favorable binding sites on duplex for ligand docking, regardless of the ligand’s initial shape, orientation, or position [31-33]. In particular, the Lamarckian Genetic Algorithm (LGA), a hybrid approach that combines a global search (genetic algorithm) with a local search (Solis and Wets algorithm), was used for docking. To accelerate energy evaluations, AUTOGRID4 represents the macromolecule using a three-dimensional grid, where each grid point contains precomputed affinity potentials for various ligand atom types [34]. While the macromolecule remains rigid during the docking process, ligand flexibility is allowed.
The protein and ligand structures were prepared using AutoDock Tools (ADT), a companion utility of the Python Molecular Viewer. Polar hydrogens were added to the DNA duplex, followed by the assignment of Kollman United Atom charges and atomic solvation parameters. The AutoGrid4 module [34] was used to generate the grid centered on the DNA binding site, with grid dimensions of 24 × 28 × 66 points and a spacing of 0.375 Å. A distance-dependent dielectric constant was applied and electrostatic and affinity grids were computed for each ligand atom type. Docking parameters included a maximum of 250,000 energy evaluations, 27,000 generations, and mutation and crossover rates of 0.02 and 0.8, respectively. Post-docking, all resulting conformations were clustered using a 1 Å all-atom root-mean-square deviation (RMSD) cutoff from the lowest energy structure. ADT was also used to analyze hydrogen bonding and hydrophobic interactions between the DNA duplex and the docked intercalators.
Explicit solvent Molecular Dynamics Simulation
Based on docking scores, the top 6 DNA–ligand complexes were selected for molecular dynamics (MD) simulations. Structural stability and conformational flexibility during the simulations were evaluated using root mean square deviation (RMSD), root mean square fluctuation (RMSF), and radius of gyration (Rg) analyses. MD simulations were carried out using the DESMOND software package for six DNA–ligand complexes (Mol-16, 14, 6, 13, 21, and 17), each for a duration of 500 ns. Prior to simulation, each complex was neutralized by adding appropriate sodium counterions. In this study, monopole charges for the ligands were calculated using the B3LYP/6-31G** level of theory within the density functional framework. Initial atomic velocities were assigned according to the Maxwell–Boltzmann distribution at 100 K. The system temperature was gradually increased from 100 K to 300 K over the course of 200 ps using the Berendsen thermostat method while maintaining constant pressure [35]. Following equilibration under an NPT ensemble, production simulations were performed for 500 ns for each complex. The AMBER99 force field, as implemented through the VIPAAR functionality in the DESMOND simulation package [36-38], was used for parameterization of DNA duplex while OPLS2005 force field was used for the ligands [39,40]. Hydrogen atoms were constrained to their ideal bond lengths during simulations to ensure structural integrity.
Results and Discussion
Molecular Docking Studies
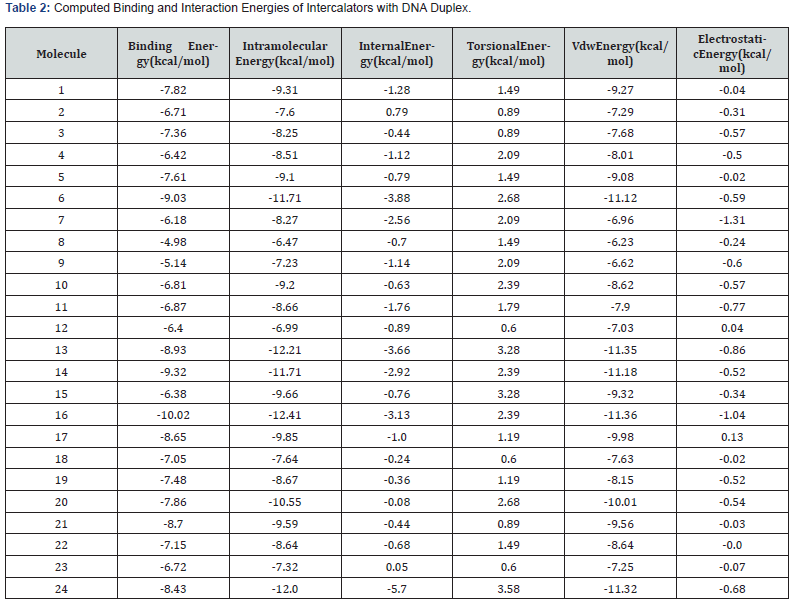
Based on conformational searches and docking studies performed using AutoDock 4.2, it was found that ligand–DNA duplex interactions are significantly influenced by non-covalent interactions, particularly van der Waals forces. The docking results are summarized in Table 2. To evaluate the accuracy of the docking methodology, intercalators were docked at a predefined single intercalation site on the DNA duplex. From Table 2, it is evident that the complexes with the lowest estimated binding free energy also exhibit the lowest intermolecular energy, indicating a strong correlation between predicted binding affinity and total non-bonded interactions. This supports the effectiveness of AutoDock in correctly predicting ligand binding modes in DNA–drug complexes. The predicted binding energies range from –10.02 kcal/mol (strongest binder) to –4.98 kcal/mol (weakest binder). Among them, Molecule 16 (–10.02 kcal/mol), Molecule 14 (–9.32 kcal/mol), Molecule 6 (–9.03 kcal/mol), Molecule 13 (–8.93 kcal/ mol), Molecule 21 (–8.70 kcal/mol), Molecule 17 (–8.65 kcal/mol), Molecule 24 (–8.43 kcal/mol), and Molecule 20 (–7.86 kcal/mol) exhibit the most favorable binding energies, indicating stronger binding affinities. In contrast, the remaining molecules display relatively lower binding.
A breakdown of the energy components provides insight into the individual contributions to overall binding. van der Waals (VdW) interactions are the primary driving force, with the most favorable values observed for Molecule 1 (–11.93 kcal/mol), followed by Molecule 3 (–10.90 kcal/mol) and Molecule 2 (–10.40 kcal/mol). Electrostatic interactions play a comparatively minor role, ranging from slightly favorable (e.g., Molecule 4: –2.08 kcal/ mol) to slightly unfavorable (e.g., Molecule 1: +0.27 kcal/mol), indicating that hydrophobic (vdW) interactions dominate, while electrostatics offer limited support. Internal energy accounts for the conformational strain experienced by ligands upon binding, with Molecule 24 (–5.7 kcal/mol) and Molecule 6 (–3.88 kcal/mol) showing notable strain. Torsional energy, reflecting the entropic cost of restricting ligand flexibility, typically ranges from 0.6 to 3.6 kcal/mol. The highest torsional penalties are observed for Molecule 24 (3.58 kcal/mol) and Molecule 13 (3.28 kcal/mol), while Molecules 12, 18 and 23 exhibit the lowest values (0.60 kcal/mol each).
Visualization of Ligand-DNA Interactions
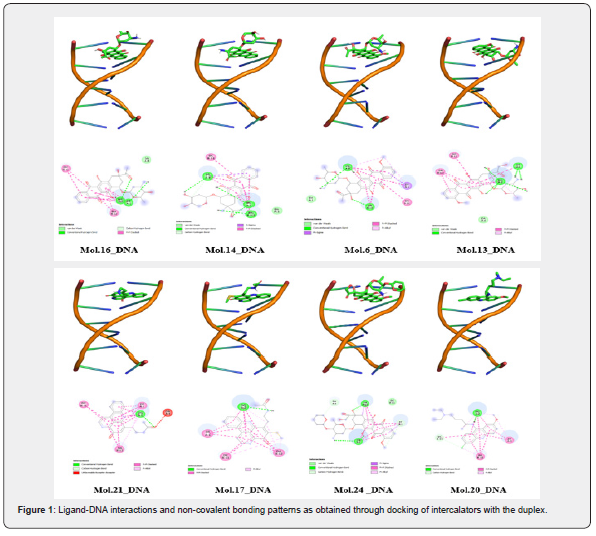
Figure 1 provides a detailed look at how eight specific molecules (16, 14, 6, 13, 21, 17, 24, and 20), identified as the bestdocked, interact with DNA through non-covalent interactions. The figure presents both 3D models of the DNA helices with bound ligands and 2D schematic representations of these interactions. The the 3D models, each ligand is clearly visible in dark green, nestled within the DNA intercalation sites. The DNA itself is depicted with orange ribbons representing its sugar-phosphate backbone, forming the familiar twisted helical shape. Complementing these 3D views, the 2D schematics offer a simplified but informative depiction of how the ligands interact with DNA base pairs. These illustrations highlight various types of interactions, including stacking, hydrophobic forces, and hydrogen bonding. Notably, all ligands are shown to interact directly within the bases of the DNA duplex, suggesting they may be intercalating into the helical groove. Both the 3D molecular representations and the 2D interaction diagrams were generated Figure 1, using specialized software: PyMOL for the 3D visualizations and BIOVIA Discovery Studio for the 2D schematics.
Structural Dynamics of DNA–Ligand Complexes in Explicit Water Environment
To further understand their structural stability and conformational behavior, the six most promising DNA-ligand complexes (Molecules 16, 14, 6, 13, 21, and 17), identified from our docking studies, underwent molecular dynamics (MD) simulations. These simulations were carried out using the DESMOND software package, with each complex simulated for 500 ns. To evaluate structural deviations and flexibility throughout the simulation, Root Mean Square Deviation (RMSD), Root Mean Square Fluctuation (RMSF), and Radius of Gyration (Rg) analyses were performed.
RMSD analysis of DNA-intercalator complexes
Figure 2 presents the RMSD profiles for the six selected molecules (Mol.16, 14, 6, 21, and 17) within their DNA-intercalation complexes. This analysis tracks the systematic deviation of each complex’s structure over the 500 nanosecond (ns) simulation period. The plot displays RMSD values (Y-axis, measured in Ångstroms, Å) against simulation time (X-axis, in nanoseconds) for both Chain B and Chain C of the DNA. Each plot shows two lines: “Chain B_RMSD” (blue) and “Chain C_RMSD” (red), likely corresponding to the two strands of the DNA duplex.
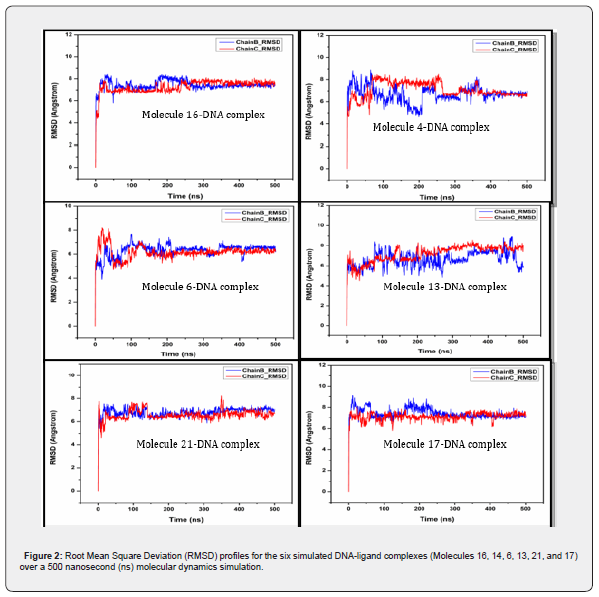
The consistent RMSD profiles indicate that the ligands remain stably attached to DNA, close to their preferential binding sites, throughout the entire simulation. Molecule 16-DNA complex: Both DNA chains (B and C) exhibit an initial rapid increase in RMSD within the first ~50 ns, which is characteristic of system equilibration. After this initial phase, both chains stabilize, with RMSD values fluctuating consistently between approximately 6.5 Å and 8.5 Å for Chain B, and 7 Å and 8 Å for Chain C. The complex demonstrates good overall stability throughout the 500 ns simulation, with no significant upward drift in RMSD, indicating a stable binding interaction.
Molecule 4-DNA complex: Similar to Molecule 16, this complex shows an initial equilibration phase. Chain B (blue) appears to be more dynamic, exhibiting larger fluctuations and a slightly higher average RMSD (ranging from ~5 Å to 9 Å) compared to Chain C. There’s a notable drop in the RMSD of Chain B, around 200-250 ns, after which it stabilizes around 6-7 Å. Chain C (red) is relatively more stable, maintaining RMSD values around 7-8 Å for the first half, then settling slightly lower around 6.5-7 Å. While showing some dynamic shifts, the complex generally equilibrates, suggesting a stable, albeit more flexible, interaction.
Molecule 6-DNA complex: This complex shows quick initial equilibration within the first ~50 ns. Both Chain B and Chain C exhibit remarkably stable RMSD profiles, consistently fluctuating between approximately 5.5 Å and 7.5 Å for the remainder of the simulation. This indicates a highly stable DNA-ligand complex with minimal conformational deviations after the initial settling period simulation.
Molecule 13-DNA complex: The initial equilibration is observed within the first ~50 ns. Chain B (blue) displays more pronounced fluctuations throughout the simulation, with RMSD values varying between approximately 5.5 Å and 8.5 Å. Chain C (red) is somewhat more stable, generally fluctuating between 6.5 Å and 8 Å, with a slight increasing trend towards the end. Overall, this complex appears less consistently stable compared to Molecules 6 and 21, showing more dynamic behavior.
Molecule 21-DNA complex: After the initial equilibration phase, both Chain B and Chain C demonstrate excellent stability. The RMSD values for both chains remain tightly clustered between approximately 6.5 Å and 7.5 Å for the majority of the 500 ns simulation, with very few significant deviations. This complex suggests a very rigid and stable interaction between the ligand and the DNA.
Molecule 17-DNA complex: The complex equilibrates within the first ~50 ns. Chain B (blue) shows fluctuations between approximately 6.5 Å and 8.5 Å, with some noticeable peaks around 50 ns and 200 ns. Chain C (red) is slightly more consistent, fluctuating around 6.5 Å to 7.5 Å. Despite some initial and mid-simulation fluctuations, the complex generally maintains good stability throughout the 500 ns, similar to Molecule 16.
Thus, all six DNA-ligand complexes demonstrate an initial equilibration phase, typical for molecular dynamics simulations. Following this, most complexes exhibit good to excellent structural stability over the 500 ns simulation time, as evidenced by their relatively stable RMSD profiles. Molecules 6 and 21 appear to form particularly stable complexes with DNA, showing minimal fluctuations in their RMSD values. Molecules 4 and 13, while generally stable, display slightly more dynamic behavior or larger fluctuations in one or both DNA chains, suggesting greater conformational flexibility. The consistent tracking of RMSD for both DNA chains (B and C) across all complexes indicates that the DNA duplex maintains its integrity and the ligands remain associated with their binding sites throughout the simulations.
RMSF Analysis of DNA-Ligand Intercalation Complexes
Figure 3 displays six plots, each showing the Root Mean Square Fluctuation (RMSF) for a different DNA-ligand complex. RMSF quantifies the average fluctuation of each residue around its average position over the course of a molecular dynamics simulation, providing insights into the flexibility of different parts of the molecule. A higher RMSF value indicates greater flexibility, while a lower value suggests a more rigid region. Each plot shows two lines: “Chain B_RMSF” (blue) and “Chain C_RMSF” (red), representing the two DNA strands. The X-axis is labeled “Residue Index,” indicating the position along the DNA chain, and the Y-axis is “RMSF (Angstrom),” measuring the fluctuation in Ångstroms.
Molecule 16-DNA complex: Both chains show relatively low RMSF values, generally below 5 Å. Chain B (blue) has an RMSF around 3.8 Å at residue 1, increases slightly to ~4.5 Å at residue 2, and then drops to ~2.3 Å for residues 4 and 5 before increasing to ~3.7 RMSF Analysis of DNA-Ligand Intercalation Complexes at residue 6. Chain C (red) starts at ~2.8 Å, increases to ~4.2 Å at residue 2, peaks at ~4.7 Å at residue 3, then drops to ~3.1 Å at residue 4, and shows a significant increase to nearly 8 Å at residue 6. The overall low RMSF values suggest that the DNA backbone in this complex is relatively rigid, with Chain C showing a notable increase in flexibility at the very end (residue 6).
Molecule 4-DNA complex: Both chains exhibit higher RMSF values compared to Molecule 16. Chain B starts around 5.8 Å, increases to ~9.6 Å at residue 3, then drops to ~7 Å at residue 4, and sharply increases to over 14 Å at residue 6. Chain C starts at ~7.5 Å, drops to ~6.4 Å at residue 2, then steadily increases, reaching over 14 Å at residues 5 and 6. This complex shows significantly more flexibility, particularly towards the ends of the DNA chains (residues 5 and 6), indicating less stable regions.
Molecule 6-DNA complex: Both chains indicate much higher fluctuations than the first two complexes. Chain B consistently shows higher RMSF values, ranging from ~26.5 Å to ~30.5 Å. It starts high, slightly decreases around residue 3, and then increases towards residue 6. Chain C is generally more rigid than Chain B, with RMSF values ranging from ~17 Å to ~23 Å. It shows an increasing trend up to residue 5, then a slight decrease. This complex appears to be quite flexible overall, with Chain B being considerably more dynamic than Chain C.
Molecule 13-DNA complex: Chain B starts very high at over 30 Å, decreases to ~27 Å at residue 2, then slightly increases before dropping to ~22 Å at residue 6. Chain C starts around 15.5 Å, shows a dip at residue 4 (around 13.5 Å), and then increases sharply to over 21 Å at residue 6. Both chains show significant flexibility, with Chain B being consistently more flexible than Chain C for most of the residues.
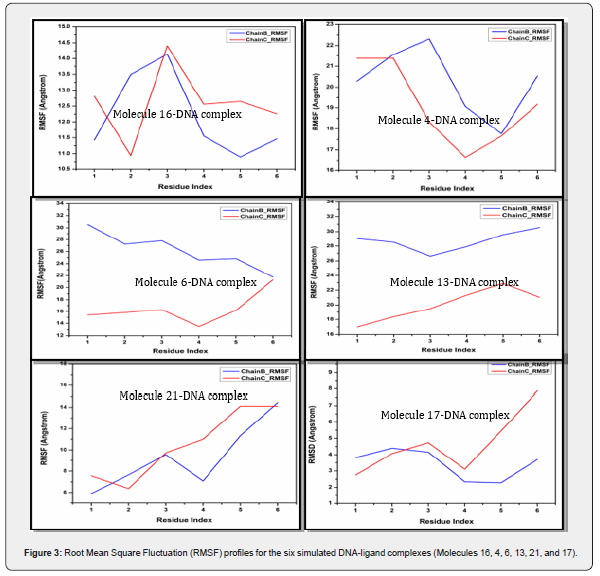
Molecule 21-DNA complex: Chain B starts around 20.2 Å, increases to a peak of ~22.2 Å at residue 3, then drops significantly to ~17.7 Å at residue 5, and rises again to ~20.5 Å at residue 6. Chain C starts around 21.3 Å, remains stable until residue 2, then drops to ~16.7 Å at residue 4, and gradually increases to ~19.1 Å at residue 6. This complex shows a more varied flexibility profile across residues, with some regions being more rigid (e.g., residue 5 for Chain B, residue 4 for Chain C) and others more flexible.
Molecule 17-DNA complex: Chain B starts around 11.4 Å, peaks at ~13.5 Å at residue 2, then drops to its lowest point at ~10.8 Å at residue 5, and slightly increases at residue 6. Chain C starts around 12.8 Å, drops to its lowest point at ~10.9 Å at residue 2, then sharply increases to ~14.4 Å at residue 3, and then gradually decreases towards residue 6. This complex shows moderate flexibility, with distinct peaks and troughs indicating specific flexible and rigid regions along the DNA chains.
The RMSF plots clearly show that different DNA-ligand complexes exhibit varying degrees of flexibility. Some complexes (e.g., Molecule 16) appear relatively rigid, while others (e.g., Molecule 6, Molecule 13) are significantly more flexible. In many cases, Chain B and Chain C show distinct RMSF profiles, indicating that the two DNA strands do not always behave identically in terms of flexibility within the complex. The specific ligand bound to the DNA significantly influences the overall flexibility and the distribution of flexible regions within the DNA duplex. This analysis is crucial for understanding how the ligand affects the dynamic properties of the DNA.
Variation of Radius of gyration throughout the dynamics
Figure 4 displays six plots, each showing the Radius of Gyration (Rg) for a different DNA-ligand complex over a 500 ns molecular dynamics simulation. The Radius of Gyration is a measure of the compactness of a molecule; a lower Rg indicates a more compact structure, while a higher Rg suggests a more extended or unfolded conformation. Each plot shows two lines: “Chain B_Rad_Gyration” (blue) and “Chain C_Rad_Gyration” (red), likely representing the two strands of the DNA duplex. The X-axis indicates simulation time in nanoseconds (ns), and the Y-axis shows the Radius of Gyration in Ångstroms (Å).
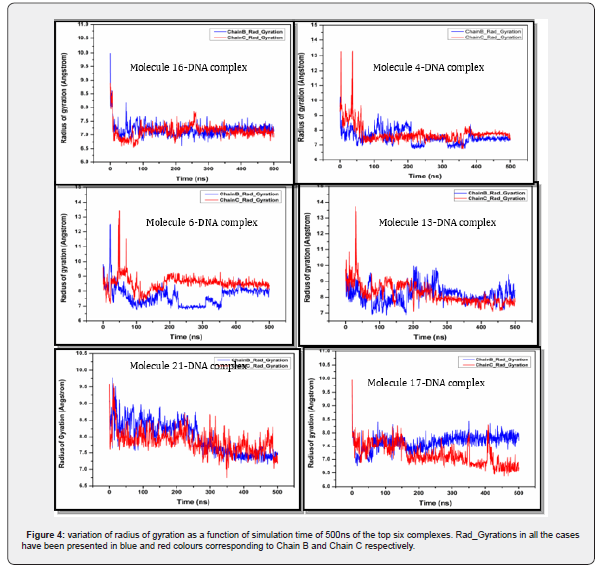
It can be observed that all six DNA-ligand complexes generally show an initial equilibration phase where their Radius of Gyration values decrease or fluctuate significantly, indicating a transition towards a more compact and stable structure. After this initial period, most complexes maintain a relatively stable Rg, suggesting that the DNA-ligand complexes remain compact and do not undergo large-scale unfolding or expansion during the 500 ns simulation. Some complexes (e.g., Molecule 17, Molecule 16) appear to achieve and maintain a very stable and compact conformation, while others (e.g., Molecule 13, Molecule 21) show more pro nounced initial adjustments before settling into a stable state. The Rg analysis complements the RMSD and RMSF data by providing insights into the overall shape and compactness of the DNA-ligand complexes throughout the molecular dynamics simulations.
Conclusion
This study highlights the molecular underpinnings of DNA intercalation using a combination of docking and long-timescale MD simulations. Among the 24 intercalators analyzed, Molecules 16, 14, 6, 13, 21, and 17 demonstrated strong binding affinities and favorable dynamic behavior in complex with B-DNA. The binding was primarily governed by van der Waals interactions, while torsional and internal energies contributed to the ligand’s conformational adaptation upon binding. MD simulations confirmed the long-term stability of the selected complexes and revealed varied flexibility profiles across DNA strands, dependent on the bound ligand. Overall, the findings deepen our understanding of ligand-induced conformational effects on DNA and support the rational design of intercalator-based anticancer agents with improved binding efficiency and biophysical stability.
References
- Watson JD, Crick FHC (1993) Molecular structure of nucleic acids: a structure for deoxyribose nucleic acid. Jama 269(15): 1966-1967.
- Watson JD & Crick FH (1993) Genetical implications of the structure of deoxyribonucleic acid. Jama 269(15): 1967-1969.
- Leone F (1992) Genetics: the mystery and the promise. Tab Books.
- Li L, Cao W, Zheng W, Fan C, & Chen T (2012) Ruthenium complexes containing 2, 6-bis (benzimidazolyl) pyridine derivatives induce cancer cell apoptosis by triggering DNA damage-mediated p53 phosphorylation. Dalton Transactions 41(41): 12766-12772.
- Yadava U, Yadav SK, & Yadav RK (2017) Electronic structure, vibrational assignments and simulation studies with A/T rich DNA duplex of an aromatic bis-amidine derivative. DNA repair 60: 9-17.
- Chaires JB (1998) Drug—DNA interactions. Current opinion in structural biology 8(3): 314-320.
- Ihmels H, Thomas L (2011) Intercalation of Organic Ligands as a Tool to Modify the Properties of DNA. Materials Science of DNA Chemistry 49-75.
- Yadava U, Yadav SK & Yadav RK (2019) Investigations on bisamidine derivatives as novel minor groove binders with the dodecamer 5′(CGCGAATTCGCG) 3. Journal of Molecular Liquids 280: 135-152.
- Yadav SK, Yadav G & Yadava U (2020). Electronic structure and vibrational assignments of 2, 5-bis [4-(n-cyclobutyldiaminomethyl) phenyl] furan. IOP SciNotes 1(2): 024005.
- Lerman LS (1961) Structural considerations in the interaction of DNA and acridines. Journal of molecular biology 3(1): 18-IN14.
- Nakamoto K, Tsuboi M & Strahan GD (2008) Intercalating drugs. Drug–DNA Interactions, John Wiley & Sons Inc PP: 119-208.
- Wheate NJ, Brodie CR, Collins JG, Kemp S & Aldrich Wright JR (2007) DNA intercalators in cancer therapy: organic and inorganic drugs and their spectroscopic tools of analysis. Mini reviews in medicinal chemistry 7(6): 627-648.
- Bond PJ, Langridge R, Jennette KW, & Lippard SJ (1975) X-ray fiber diffraction evidence for neighbor exclusion binding of a platinum metallointercalation reagent to DNA. Proceedings of the National Academy of Sciences 72(12): 4825-4829.
- Rao SN, Kollman PA (1987) Molecular mechanical simulations on double intercalation of 9-amino acridine into d (CGCGCGC) X d (GCGCGCG): analysis of the physical basis for the neighbor-exclusion principle. Proceedings of the National Academy of Sciences, 84(16): 5735-5739.
- Neto BA, & Lapis AA (2009) Recent developments in the chemistry of deoxyribonucleic acid (DNA) intercalators: principles, design, synthesis, applications and trends. Molecules 14(5): 1725-1746.
- Yadav G, Yadava U (2024) Exploring the electronic structure and interaction mechanism of nucleic acid bases on pristine graphene and beryllium-oxide-graphene layers. Computational and Theoretical Chemistry 1239: 114787.
- Yadava U, Singh M & Roychoudhury M (2011) Gas-phase conformational and intramolecular π–π interaction studies on some pyrazolo [3, 4-d] pyrimidine derivatives. Computational and Theoretical Chemistry 977(1-3): 134-139.
- Baginski M, Fogolari F & Briggs JM (1997) Electrostatic and non-electrostatic contributions to the binding free energies of anthracycline antibiotics to DNA. Journal of molecular biology 274(2): 253-267.
- Rehn C, Pindur U (1996) Model building and molecular mechanics calculations of mitoxantrone-deoxytetranucleotide complexes: Molecular foundations of DNA intercalation as cytostatic active principle. Monatshefte für Chemie/Chemical Monthly 127(6): 631-644.
- Waring MJ, Bailly C (1994) The purine 2-amino group as a critical recognition element for binding of small molecules to DNA. Gene 149(1): 69-79.
- Hannon MJ (2007) Supramolecular DNA recognition. Chemical Society Reviews 36(2): 280-295.
- Bauer W, Vinograd J (1970) The interaction of closed circular DNA with intercalative dyes: III. Dependence of the buoyant density upon superhelix density and base composition. Journal of molecular biology 54(2): 281-298.
- Lerman LS (1961) Structural considerations in the interaction of DNA and acridines. Journal of molecular biology 3(1): 18-IN14.
- Waring M (1970) Variation of the supercoils in closed circular DNA by binding of antibiotics and drugs: evidence for molecular models involving intercalation. Journal of molecular biology 54(2): 247-279.
- Winston CT, Boger DL (2004) Sequence-selective DNA recognition: natural products and nature’s lessons. Chemistry & biology, 11(12): 1607-1617.
- Waring MJ, Bailly C (1994) DNA recognition by intercalators and hybrid molecules. Journal of Molecular Recognition 7(2): 109-122.
- Hannon MJ (2007) Supramolecular DNA recognition. Chemical Society Reviews 36(2): 280-295.
- Schuerman GS, Smith CK, Turkenburg JP, Dettmar AN, Van Meervelt L, et al. (1996) DNA–drug refinement: a comparison of the programs NUCLSQ, PROLSQ, SHELXL93 and X-PLOR, using the low-temperature d (TGATCA)–nogalamycin structure. Biological Crystallography 52(2): 299-314.
- Morris GM, Goodsell DS, Halliday RS, Huey R, Hart WE, et al. (1998) Automated docking using a Lamarckian genetic algorithm and an empirical binding free energy function. Journal of computational chemistry 19(14): 1639-1662.
- Huey R, Morris GM, Olson AJ, Goodsell DS (2007) A semiempirical free energy force field with charge‐based desolvation. Journal of computational chemistry 28(6): 1145-1152.
- Morris GM, Huey R, Lindstrom W, Sanner MF, Belew RK, et al. (2009) AutoDock4 and AutoDockTools4: Automated docking with selective receptor flexibility. Journal of computational chemistry 30(16): 2785-2791.
- Yadava U, Singh M, Roychoudhury (2013) Pyrazolo [3, 4-d] pyrimidines as inhibitor of anti-coagulation and inflammation activities of phospholipase A 2: insight from molecular docking studies. Journal of biological physics 39(3): 419-438.
- Yadava U, Gupta H, Yadav RK, Roychoudhury M (2014) Docking and molecular dynamics simulations of pyrazolo [3, 4-d] pyrimidine-DNA complexes. Advanced Science Letters 20(7-8): 1637-1643.
- Morris GM, Goodsell DS, Halliday RS, Huey R, Hart WE, et al. (1998) Automated docking using a Lamarckian genetic algorithm and an empirical binding free energy function. Journal of computational chemistry 19(14): 1639-1662.
- Berendsen HJ, Postma JV, Van Gunsteren WF, DiNola ARHJ & Haak JR (1984) Molecular dynamics with coupling to an external bath. The Journal of chemical physics 81(8): 3684-3690.
- Release S (2017) 4: Desmond molecular dynamics system. DE Shaw Research, New York, NY, USA.
- Bowers KJ, Chow E, Xu H, Dror RO, Eastwood MP, et al. (2006) Scalable algorithms for molecular dynamics simulations on commodity clusters. In Proceedings of the 2006 ACM/IEEE Conference on Supercomputing p. 84.
- Yadav RK, Yadava U (2016) Molecular dynamics simulation of hydrated d (CGGGTACCCG) 4 as a four-way DNA Holliday junction and comparison with the crystallographic structure. Molecular Simulation 42(1): 25-30.
- Yadav RK, Yadava U (2014) Molecular dynamics simulation of DNA duplex, analog of PPT (polypurine tract), its conformation and hydration: a theoretical study. Medicinal Chemistry Research 23(1): 280-286.
- Yadav SK, Yadav RK, Yadava U (2020) Computational investigations and molecular dynamics simulations envisioned for potent antioxidant and anticancer drugs using indole-chalcone-triazole hybrids. DNA repair 86: 102765.


