In silico Modelling of 2D, 3D Molecular Descriptors for Prediction Of Anticancer Activities Of Luteolin And Daidzin From Plants Perilla ocymoides L and Glucine max L
Pham Van Tat3*, Bui Thi Phuong Thuy1, Tran Duong2, Phung Van Trung4, Hoang Thi Kim Dung4 and Pham Nu Ngoc Han3
1Faculty of Chemistry, Hue University of Science, Asia
2Faculty of Chemistry, Hue University of Education, Asia
3Faculty of Science and Engineering, Hoa Sen University, Asia
4Institute of Chemical Technology, Vietnam Academy of Science and Technology, Asia
Submission: October 10, 2017; Published: November 20, 2017
*Corresponding author: Pham Van Tat, Faculty of Science and Engineering, Hoa Sen University, Asia, Email: vantat@gmail.com
How to cite this article: Pham V T, Bui T P T, Tran D, Phung V T, Hoang T K D, et al. In silico Modelling of 2D, 3D Molecular Descriptors for Prediction Of Anticancer Activities Of Luteolin And Daidzin From Plants Perilla ocymoides L and Glucine max L. Organic & Medicinal Chem IJ. 2017; 4(3): 555638. DOI: 10.19080/OMCIJ.2017.04.555638
Abstract
Recently, we have isolated two flavonoids luteolin and daidzin from leaves of Perilla ocymoides L and Glucine max L in Viet Nam [1], with cytotoxic activity relatively strong in Hela cell line. To clarify the important nature of the relationships between structure and activity, the QSAR studies on Hela cell line incorporated the principal component analysis (PCA) technique and the artificial neural network (ANN) to construct the QSARpcaann relationships. The best multiple linear model QSARmlr (with k = 6) values R2train of 0.854 and R2pred of 0.812, and QSARPCR (with k = 6) values R2train of 0.937 and R2pred of 0.889 were found by using the multiple linear regression technique. The artificial neural network QSARpcaann with architectural style I (6)-HL (9)-O (1) represented the values R2train of 0.993 and R2pred of 0.971. In the case the incorporated model QSARpca ANN with the architecture I (6)-HL (9)-O (1) was exhibited the higher training and predicted quality. The anticancer activities of test substances resulting from those models are in good agreement with those from literature. The anti-cancer activities of two compounds luteolin and daidzin from leaves of Perilla ocymoides L and Glucine max L resulting from those models turn out to be agreement with experimental data.
Keywords: QSARMLR, QSARPCR and QSARPCAANN Model; Anti Cancer Activities Hela Cell Line
Abbreviations: PCA - Principal Component Analysis; ANN - Artificial Neural Network; QSAR - Quantitative Structure-Activity Relationship; PCR - Principal Component Regression; PCs - Principal Components; SE - Standard Error; LOO - Leave-One-Out; HMBC - Heteronuclear Multiple- Bond Correlation; HSQC - Heteronuclear Single-Quantum Correlation spectroscopy; QSAR - Quantitative Structure Activity Relationship; MLR - Multiple Linear Regression
Introduction
Natural products from plants are of interest in searching for new anti-cancer drugs and can have a direct effect on HeLa cell line and reduce side effects. Recently, we have isolated a few flavonoids from Perilla ocymoides L and Glucine max L [1] and tested in vitro activities pointed out the relatively strong impacts for cancer cells HeLa [2]. Flavonoids are polyphenolic compounds in most plants [3-5]. The flavonoids from Perilla ocymoides L and Glucine max L were also tested the biological activities in some different cancer cells. The flavonoids presented their activities and role of food within flavonoids in the cancer inhibition are widely studied [6-8]. In recent years, the computational methods are applied widely for the study of chemical properties and designing new drugs. The field of new drug design by in sillico method has become an important tool nowadays. In sillico study on quantitative relationships between structure and activity (QSAR) of natural products is concerned with the new drug researchers and pharmaceutical manufacturing facilitators. In Viet Nam, there are also a number of works of scientists from universities and institutions published in Viet Nam journals [9-11]. In the previous studies of 3-aminoflavonoid substances they have focused on the use of semi-empirical calculation [11]. Those studies showed an effect way for designing new drugs with the assisted computers. The In sillicao model it can be used to predict the biological activity of new drugs from the atomic charges and molecular descriptors. This method allows for the identification of an active-central location of molecule.
The set of flavones and isoflavones is known to have an important activity against cervical cancer cells [12-14]. This flavonoid group is also interested currently for researching in different directions such as the synthesis and metabolizing of natural products isolating them from plant [1]. The in sillico model of quantitative relationship between the structure of flavones and isoflavones and anticancer activity is an important issue for searching the flavonoid derivatives to be valid way. In this work, we report in the present paper the use of semi-empirical quantum calculations and construction of quantitative structure activity relationship (QSAR) models using 32 flavone and isoflavone derivatives [15]. The geometries of flavones and isoflavones are optimized by means of molecular mechanics (MM+). The 2D and 3D molecular descriptors resulting from geometric calculation are used to establish the multivariate models such as multiple linear regression (MLR), principal component regression (PCR) and artificial neural network (ANN). The anti-cancer activities G150/HM of flavones and isoflavones in test group and two new flavonoids luteolin and daidzin from Perilla ocymoides L and Glucine max L [1] resulting from in sillico models are compared with those from experimental data..
Materials And Methods
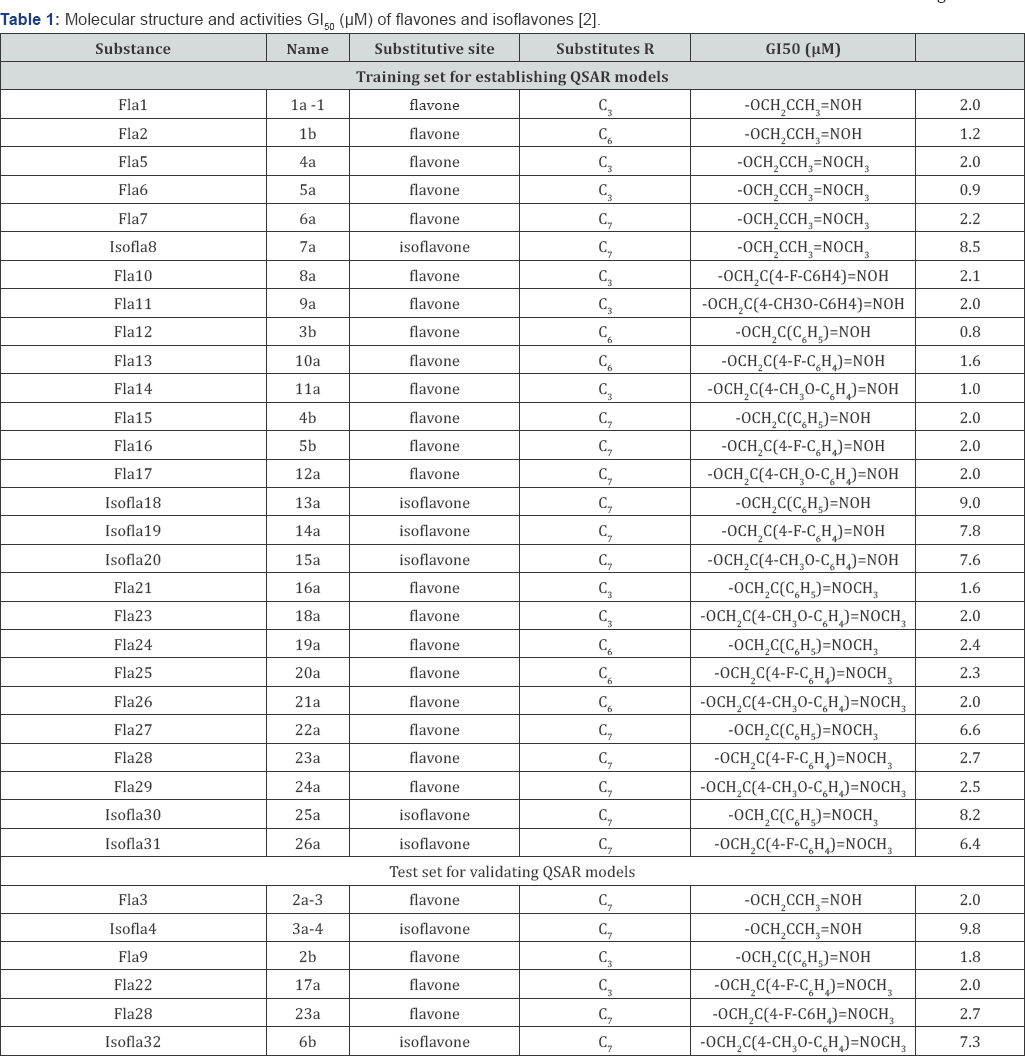
a. Materials: To ensure an accurate capability of QSAR model, the dataset used for building and validating QSAR models consists of 32 compounds with anti-cancer activities G150/μM for Hela cell line (G150 is the concentration for 50% of maximal inhibition of cell proliferation) were reported by Wang et al. in the literature [2], as pointed out in (Figure 1). The value logG150 is the subsequent dependent variable that defines the biological parameter for QSAR model.


Quantitative Structure-Activity Relationship (QSAR) studies have often been used to find correlations between biological activities and 2D and 3D molecular descriptors for compounds. We used the flavones and isoflavones reported by Wang et al. to calculate 2D and 3D molecular descriptors. The molecular descriptors are calculated with QSARIS program [16]. The multiple linear regression (QSARMLR) and principal component regression (QSARPCR) models are constructed with XLSTAT 2014 [17]. Because of the artificial neural networks are an artificial intelligent systems, they use a large number of interrelated data-processing neurons to emulate the function of brain. So the artificial neural network (QSARPCA-ANN) can be constructed with program Visual Gene Developer 1.7 [18].
b. Constructing QSAR models: Linear regression is without doubt the most frequently used statistical method. The multiple regression (several explanatory variables) and simple linear regression are identical linear regression methods in the overall concept as well as calculation techniques. The principle of linear regression is to model a quantitative dependent variable Y though a linear combination of k quantitative explanatory variables, x1, x2, ..., xk. In the case where there are N observations, the estimation of the predicted value of the dependent variable Y is given by [17,19]:

Where Y is the experimental activity pG150,exp, xi is kth molecular descriptor.
Values R2train . and R2pred , are calculated by

Here Yi, Ŷi are experimental pG150, exp and predicted pG150,exp pred value; Ў is mean of experimental values.
The predicted results derived from the QSAR models are validated and compared with experimental data base on the relative errors (ARE, %) as [3,7]:

The average value of absolute relative errors ARE, % [6] is calculated and used for assessing the global uncertainty of QSAR model

With N is number of activity values.
Principal component regression (PCR) model [17,20] is a regression technique using principal component analysis (PCA) when evaluating regression coefficients. PCR presents a technique for finding structure in datasets. Its object is to group correlated variables, replacing the earlier descriptors by new set called principal components (PCs). These PC's are uncorrelated and are developed as a simple linear aggregation of earlier variables. 1t moves the data into a new set of axes such that first few axes indicate most of the variations within the data. First PC (PC1) is expressed in the direction of maximum variance of the whole dataset. Second PC (PC2) is the direction that defines the maximum variance in orthogonal subspace to PC1. Consequent components are taken orthogonal to the particular formerly chosen and defines best of remaining variance, by locating the data on new set of axes, it can points major fundamental structures certainly. Value of each point, when moved to a given axis, is called the PC value. PCA chooses a new set of axes for the data. These are chosen in decreasing order of variance within the data. The aim of principal component regression PCR is the computation of values of a response variable on the basis of chosen PCs of independent variables [16,17,20].
Results And Discussion
a.Calculation of molecular descriptors: The program HyperChem 8.05 [21] was used for designing the flavonoid molecules. The molecular structures were optimized by means of MM+ molecular mechanics. The molecular descriptors of molecules were calculated by computational techniques of QSARIS [16] using the optimized geometries. The molecular descriptors were used to construct the multiple linear regression (QSARMLR), principal component regression (QSARPCR) and artificial neural network (QSARpca-ann) model [4,5].
b. Development of QSARmlr model: Before conducting the QSARmlr model, the activity values GI50 (μM) are transformed into the values pGI50 to adapt the statistical properties. The values pGI50 (μM) are most appropriate value for modelling the relationships between molecular descriptors and activities. The QSARmlr models were established by using the relationship of the geometric predictors and biological activities pGI50 [16]. The QSAR models in this work obtained by two different approaches: (i) cases are selected randomly for training set, and (ii) remaining cases for validation of predictability (test set). There are several methods for selecting the training set. The simplest way is the random selection. In this work, the original data is divided into training and validation set. The accurate predictability of QSAR model is evaluated by comparing the predicted and observed activities of the substances in test set without training set.
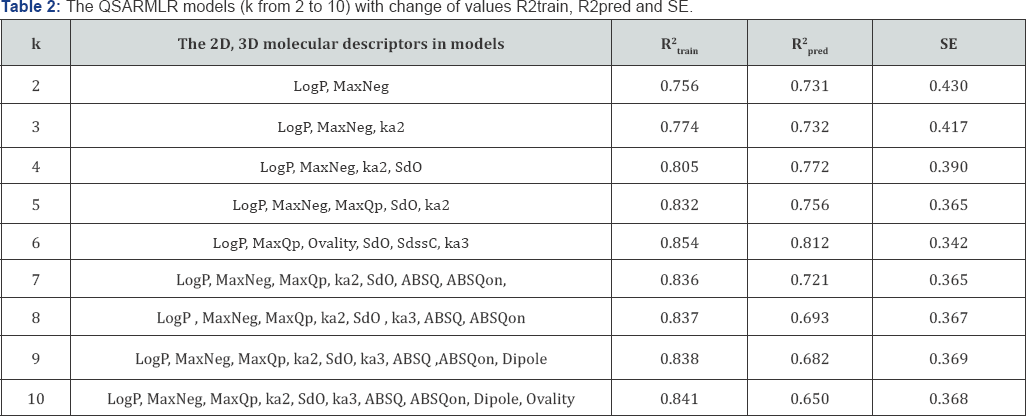
In recent years theoretical and experimental researchers have focused an increasing attention on finding the most efficient tools for selecting molecular descriptors in QSAR studies [3,4,10]. The change of values R2train, R2pred and SE (standard error) in the QSARmlr models with the 2D and 3D predictors, respectively are pointed out in (Table 1). To have those QSARmlr models, the 2D and 3D molecular descriptors were selected by using forward and backward algorithm. The selection process for 2D and 3D descriptors based on the change of the statistical values R2train SE and R2pred. The values R2pred of the QSARmlr models were calculated by using the cross-validated technique with leave- one-out (LOO) method. The 9 fitness models are shown in (Table 2).

The QSARmlr models (with k of 2 to 10) that were arranged in an orderly change of R2train, SE and R2pred, as given in (Table 2). The values of R2 . and R2 , from QSAR,"" models (with k from 5 to 7) are higher than others. In particular, the QSARmlr model (with k = 6) has given the highest values R2train of 0.854 and R2pred of 0. 812. So, three best models (with k of 5, 6 and 7) are chosen to determine the significant contribution of 2D, 3D descriptors. The valuable contribution percentages MPmxk,% and GMPmxk,% [3], with the statistical parameters of three models (with k of 5, 6 and 7), respectively, are given in (Table 3).
The contribution percentages MPmxk, %, GMPmxk, % [3,7,11] of the models (with k of 5, 6 and 7), respectively are calculated by formula

Where N the total number of cases, m number of variables. The global average contribution percentage GMPmxk, % of each independent variable for 3 models is determined by the formula

With n number of models
The contribution percentages GMPmxk, % in Table 3 depicted the important level of 2D and 3D molecular descriptors for flavonoid compounds. For the QSARmlr models in Table 3 the important significance of 2D and 3D molecular descriptors is arranged by using values GMPmxk, %: MaxQp > ABSQ > ka2 > MaxNeg > LogP > ka3 > SdssC > SdO > Ovality > ABSQon. The molecular descriptors MaxQp, ABSQ, ka2, MaxNeg and LogP can be considered such as the most important contribution for each molecule. Besides these molecular descriptors exhibit by important nature of carbonyl group C4 = O11 and atom O1. These atoms wear the free electron pair conjugating with k electronic bond C2 = C3, and C4 = O to form a conjugate system. The carbonyl group C4 = O11 exhibited fully reactive nature of carbonyl substance [2]. So, these descriptors can be demonstrated quantitatively total charges ABSQ, MaxQp and MaxNeg on molecule based on the values GMPmxk, % and these are also consistent with the verdicts from experimental evaluation [16,23]. Furthermore, the atomic positions C6 and C3' on molecule are the vacant positions and can be explored for attaching the new function groups [9,23,24]. The various atoms seem to be the important impacts for biological activities GI50. So these sites are chosen for attaching the new substitutes to construct new flavonoids. Similarly the atom C2' is also empty position and also can be utilized to attach the new function group. Those sites hope to constitute the new compounds with higher activity than sample compound. Also this way, the new flavonoids isolated from leaves of Perilla ocymoides L and Glucine max L are also used such as lead compounds to design new drugs. This is also showed in below discussion.
c. Development of QSARpcR model: The molecular descriptors were applied to under goes principal component regression PCR technique to create QSARpcr model with simulated anealining variable selection mode by using PCR model [17]. The best QSARMLR model (with k = 6) is selected to generate the QSARPCR model [16,17]. The 6 independent variables MaxQp, SdO, ka3, LogP, Ovality and SdssC were carried out to analyse the principle components. The principle component regression QSARPCR model is generated with 6 principle components which are corresponding to the original descriptors of QSARMLR model (with k = 6), as exhibited in equation (8):

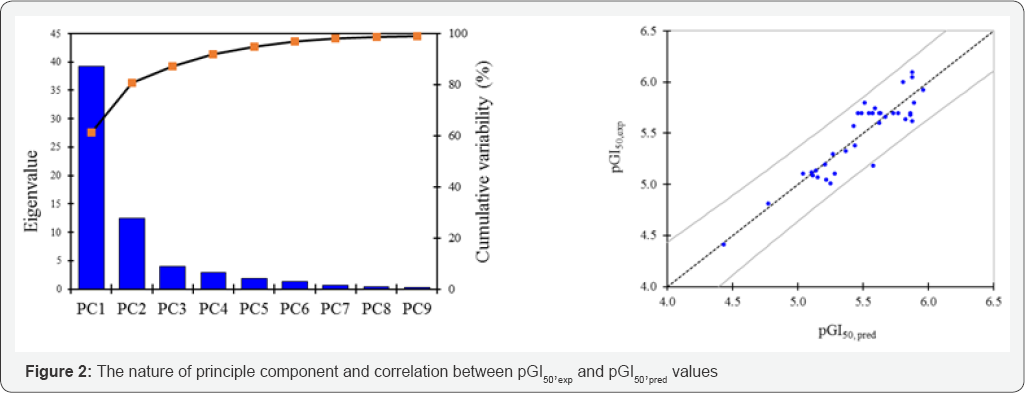
The number of principle components is extracted by the principle component analysis technique and the the correlation between pGI50 and pGI50, pred values is pointed out in (Figure 2).
d. Building QSArpca-ann model: The QSARpca-ann model is built by the neuro-fuzzy technique with the genetic algorithms using program Visual Gene Developer v1.7 [18]. The artificial neural network has an architecture style I(6)-HL(9)-O(1); it consists of input layer I(6) with 6 neurons such as 6 principle components in equation (8) PC1, PC2, PC3, PC4, PC5 and PC6; the input neurons are corresponding to LogP, MaxQp, Ovality, SdO, SdssC and ka3; the neuron of output layer O(1) is the biological activity pGI50; the hidden layer HL(9) consists of nine neurons. This neural network I(6)-HL(9)-O(1) used the back propagation algorithm to train the network.
The back propagation algorithm looks for the minimum of the error function in weight space using the method of gradient descent. The sigmoid function is used to transfer on each node of neural network; the training parameters of neural network are the training rate of 0.7 and learing rate of 0.7; the goal monitoring error MSE = 0.000816 with 10,000 iteration. After training the QSARPCA-ANN with architecture I(6)-HL(9)-O(1) pointed out the values R2 . of 0.993 and R2 . of 0.971. But in the case the train predQSARpcr model gave values R2train = 0.937 and R2pred = 0.889; and the QSARmlr model (with k = 6) gave values R2train of 0.854 and R2 .of 0.812.
e.Isolation of luteolin and daidzin from plant
i.Chemicals and equipment: In this work, we used the chemicals and the equipments for isolating and purifying two flavonoids luteolin and daidzin before determining the substance structures by 1H-NMR and 13C-NMR spectrum [25].
The following materials are used to isolate the flavonoids in
ii. Silica gel with the particle size in range 0.04 to 0.06 mm was used for ordinary and Rp18 phase chromatography
iii. Thin-layer chromatography was implemented by the thin plate DC-Alufolien F254 (Merck) for the ordinary phase and Rp18 F254s (Merck) for the reverse-phase chromatography.
iv. Solvents used for the isolation processes: hexane, petroleum ether, chloroform, methanol, ethyl acetate, ethanol, acetone, distilled water.
v. UV handheld lamps, 254 and 365 nm UVITEC effect.
vi. Vacuum Evaporators Buchi - 111 and Water Bath cooker JULABO 461.
vii. Infrared heating equipment SCHOTT.
viii. Chromatography column with diameter range 2 to 5.5 cm.
ix. Analytical Balances AND HR 200.
f. Isolation process of luteolin and daidzin: To isolate and purify the luteolin and daidzin compound from the leaves of Perilla ocymoides L and Glucine max L we used the techniques of thin-layer and column chromatography [25], as exhibited in (Figures 3-4). After isolating the compounds their structures were identified by the different spectrum as


i. Melting temperature carried out on Electrothermal 1A 9000 series, using unadjusted capillary
ii. Column chromatography with silica gel for ordinary- phase, reverse-phase chromatography Rp 18 and sephadex techniques combined with thin-layer chromatography
iii. Substances were detected by ultraviolet light at wavelengths 254 nm and 365 nm or reagent used is liquid H2SO4/EtOH or FeCl3/EtOH.
iv. Nuclear magnetic resonance spectrum (NMR) 1H-NMR (500 MHz) and 13C-NMR (125 MHz) implemented on Bruker AM500 FT-NMR Spectrometer.
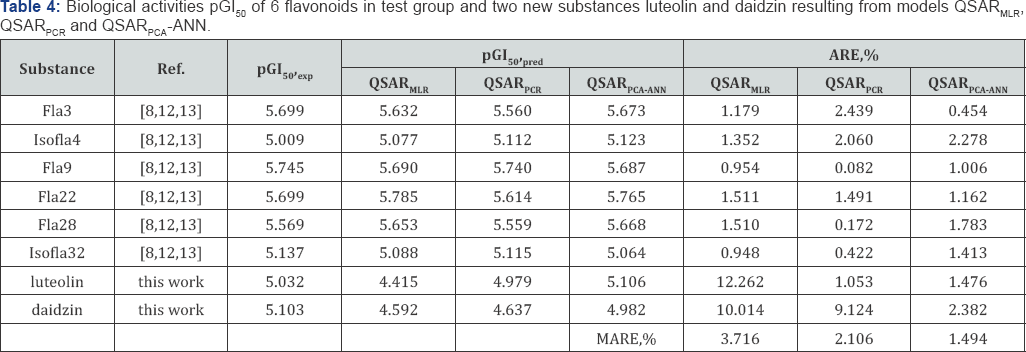
g. Prediction of biological activity for new substances: The predictability of the constructed models QSARmlr, QSARpcr and QSARpca-ann was evaluated carefully by using the leave-one- out (LOO) technique to determine R2pred; the flavonoids in Table 1 were divided randomly into the training group of 26 compounds and the test group of 6 compounds. The anticancer activities pGl50 of 6 flavonoids in the test group in Table 1 with 2 new flavonoids luteolin and daidzin isolated from the leaves of Perilla ocymoides L and Glucine max L [1] are predicted from those QSAR models. The predicted activities of 6 flavonoids in test group and new substances luteolin and daidzin resulting from QSAR models were compared to experimental data, as presented in (Table 4). For new substances luteolin and daidzin we carried out to test the in vitro activity on Hela cell line in laboratory of molecular biology of the genetic department at Ho Chi Minh University of science (Figure 5).
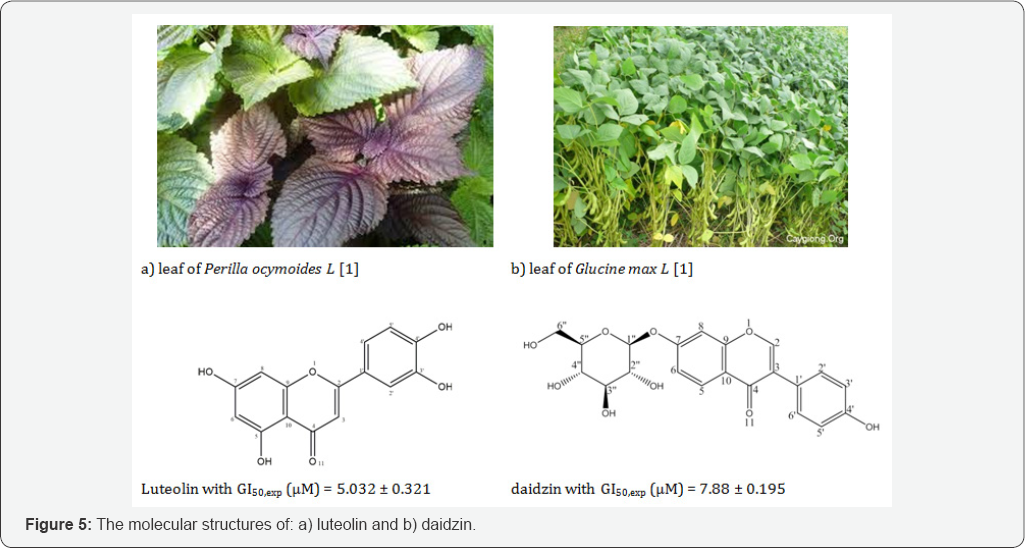
The luteolin structure was identified by using the different spectra such: 1H-NMR (DMSO-d6, 500 MHz, S ppm) with HSQC, HMBC: S 6.65 (1H; s, H3); 6.19 (1H; d; J = 2Hz, H6); 6.45 (1H; d; J = 2Hz, H8); 7.4 ( 1H; s H2'); 6.89 (1H; d; J = 8Hz, H5,); 7.41 (1H; d; J = 8Hz, H6,); 12.95 (1H, s; C5-OH); 9.4 (1H, s, C4,-OH ); 9.9(1H, s, C3'-OH); 10.84 (1H, s, C7-OH). The 13C-NMR spectrum was employed to have more information such as combining 13C-NMR (DMSO-d6, 125 Hz) with spectrum DEPT, HSQC, HMBC: 5163.1 (C2); 102.8(C3); 181.6(C4); 161.4(C5); 98.9(C6); 164.1(C7); 93.8(C8); 157.3 (C9);103.7(C10); 121.5(Cr); 113.4(C2'); 145.7(C3,); 149.7(C4'); 116.0(C5,); 118.9(C6'). Interaction of atom C and H in heteronuclear multiple-bond correlation (HMBC) and heteronuclear single-quantum correlation spectroscopy (HSQC) were pointed out the atomic sites: H6- C5- C7- C8-C10; H8- C6- C7- c9- C10; H2, c2- C3, C,- c6,; H3,-Cr- C2, C4, Cs.; Hs, Cr- C3,- C4, C6.; H6'" C2- C1'- C2’- C4’- C5'.
For the substance daidzin the molecular structure was also identified by the spectrum 1H-NMR: 8 8,06 (1H, d, J = 8,0Hz, H5); 8 7,15 (1H, D, J = 1,5 Hz, H6); 8 7,23 (1H, d, J = 2,0Hz, H8); 8 6,84 ppm (2H, d, J = 6,5 Hz, H3', H5,); 8 7,42 (2H, d, J = 8,0 Hz, H6" H2,); Also, we used specrum 13C-NMR (DMSO-d6, 125 Hz) with spectra DEPT, HSQC, HMBC: 0153,2 (C2), S 122,3 (C3), S 174,7 (C4), S 126,9 (C5), S 115,6 (C6), S 161,3 (C7), S 103,4 (C8), S 157,0 (C9), S 118,5 (C10), S 123,7 (CJ, S 130,0 (C2,), S 115,0 (C3,), S 157,2 (C4,), S 115,0 (C5,), S 130,0 (C6,), S 100,0 (Cr), S 73,1 (C2"), S 76,5 (C3"), S 69,6 (C4"), S 77,2 (C5"), S 60,6 (C6"). The molecular structures of new substances luteolin and daidzin are shown in (Figure 5). The predicted activities from QSAR models were compared with experimental data and with each other upon the average value of absolute relative error MARE, %. The values MARE, % showed that the predictability of the model QSARMLR is lower than models QSARPCR and QSARPCA-ANN, as given in (Table 4). After using the QSAR models to predict the anticancer activities pGI50 of six flavonoids in test group and two new flavonoids luteolin and daidzin, the errors of QSAR models can be accepted in uncertainty range of experimental measurements. Consequently, the models QSARmlr, QSARpcr and QSARpca-ann exhibited in good adaptability for predicting the activities of new substances. In this work, we selected the new substance luteolin isolating from Perilla ocymoides L to design new substances. The new functional group are substituted at the vacant positions C6, C2, and C3,.

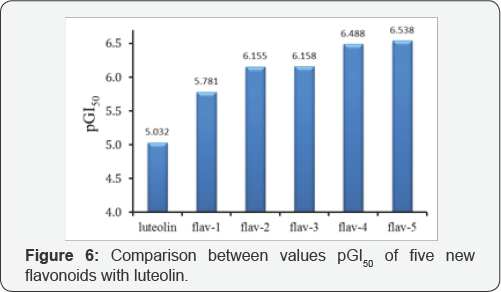
The substance luteolin was used such as lead compound for designing 5 new various compounds. The positions C6, C2' and C3, were substituted the new functional groups; and the biological activities pGI50 of the new designed flavonoids were predicted by using QSARpca-ann model, as given in (Table 5). The predicted results pGI5 for 5 new designed substances are compared with experimental activity of luteolin, as depicted in (Figure 6). The activity GI50 (μM) of five new designed compounds from luteolin by substituting new functional groups into C6, C2, and C3, sites are stronger than lead compound luteolin. Herein the new designed compounds will promise to forward a designing plan for the new pharmaceutical products from natural products.
Conclusion
The use of computational methods constructed successfully the in sillico models with relationships between the 2D, 3D molecular descriptors and anti-cancer activities G150 (μM) of flavonoids. The QSARmlr model showed the important contribution descriptors MaxQp, SdO, ka3, LogP, Ovality and SdssC on flavonoids which effect an in vitro activity on Hela cell line. The in sillico model QSAR also found out helpfully the most important positions C6 and C3, to substitute the new functional groups to generate new flavonoids with higher activity than luteolin isolating from leaf of Perilla ocymoides L. The QSARpca- ANN model with architecture I(6)-HL(9)-O(1) has the good applicability for flavonoids. The biological activities resulting from QSARpca-ann model turn out to be in good agreement with those from experimental data. The QSAR models described in the present paper for diverse flavonoids may be useful for in vitro toxicity assessment. This work established the different models QSAR that may prove to be useful for guiding the rational search of new therapeutic agents for cancer diseases.
References
- Do Tat Loi (2006) Medicinal Plants and Drugs from Vietnam. Publisher of Medicine, Vietnam.
- Manjinder Singh, Maninder Kaur, Om Silakari (2014) Flavones: an important scaffold for medicinal chemistry. European Journal of Medicinal Chemistry 84: 206-239.
- Debarshi Kar Mahapatra, Sanjay Kumar Bharti, Vivek Asati (2015) Anti-cancer chalcones: Structural and molecular target perspectives. European Journal of Medicinal Chemistry 98: 69-114.
- Lovro Ziberna, Stefano Fornasaro, Jovana Cvorovic, Federica Tramer, Sabina Passamonti (2014) Polyphenols in Human Health and Disease 1: 489-511.
- R Vidya Priyadarsini, R Senthil Murugan, S Maitreyi, K Ramalingam, D Karunagaran, et al. (2010) The flavonoid quercetin induces cell cycle arrest and mitochondria-mediated apoptosis in human cervical cancer (HeLa) cells through p53 induction and NF-kB inhibition. European Journal of Pharmacology 649(1-3): 84-91.
- Bozena Pawlikowska Pawlęga, Halina Dziubińska, Elzbieta Krol, Kazimierz Trębacz, Anna Jarosz Wilkotazka, et al. (2014) Interaction of a quercetin derivative - lensoside Aβ with liposomal membranes. Biochimica et Biophysica Acta (BBA) - Biomembranes, 1838(1): 254265.
- Nathan M Gavin, Michael J Durako (2012) J. Experimental Marine Biology and Ecology 32(40): 416-417.
- Iris S L Lee, Mary C Boyce, Michael C Breadmore (2012) Extraction and on-line concentration of flavonoids in Brassica oleracea by capillary electrophoresis using large volume sample stacking. J. Food Chemistry 133(1): 205-211.
- Bui Thi Phuong Thuy Pham Van Tat (2012) Vietnam Journal of Chemistry 5(50): 550-556.
- Bui Thi Phuong Thuy Pham Van Tat (2012) Vietnam Journal of Chemistry 50(5A): 203-208.
- Pham Van Tat (2009) Vietnamese Journal of Chemistry and Application 14: 43-46.
- Si Yan Liao, Jin Can Chen, Li Qian, Yong Shen, Kang Cheng Zheng, et al. (2005) J Bioorganic and Medicinal Chemistry 13: 6045-6053.
- Si Yan Liao, Jin Can Chen, Li Qian, Yong Shen, Kang Cheng Zheng, et al. (2008) QSAR, action mechanism and molecular design of flavone and isoflavone derivatives with cytotoxicity against HeLa. J European Journal of Medicinal Chemistry 43(10): 2159-2170.
- I Li Chen, Chen JY, Shieh PC, Chen JJ, Lee CH, et al. (2008) Synthesis and antiproliferative evaluation of amide-containing flavone and isoflavone derivatives. J Bioorganic and Medicinal Chemistry 16(16): 7639-7645.
- TC Wang, IL Chen, PJ Lu, CH Wong, CH Liao, et al. (2005) Synthesis, antiproliferative, and antiplatelet activities of oxime-and methyloxime- containing flavone and isoflavone derivatives, Bioorganic & Medicinal Chemistry. Bioorg Med Chem 13(21): 6045-6053.
- Pham Van Tat (2009) Development of Quantitative Structure- Activity Relationships (QSARs) and Quantitative Structure-Property Relationships (QSPRs). Publisher of Natural Science and Technology, Hanoi.
- XLSTAT version (2014) Copyright Addinsoft 1995-2014, USA.
- Jung, SK, K McDonald (2011) Visual Gene Developer: a fully programmable bioinformatics software for synthetic gene optimization. BMC Bioinformatics 12(1): 340.
- Wold S (1995) PLS for multivariate linear modelling. In: van de Waterbeemd H, QSAR: Chemometric Methods in Molecular Design. Wiley-VCH, Weinheim, Germany 2: 195-218.
- OriginLab tutorials, OriginLab Corporation, Northampton, MA 01060, USA (2015).
- HyperChem Release (2008) Hypercube Inc USA.
- Bastien P, Esposito Vinzi V, Tenenhaus M (2005) PLS Generalised Regression. Computational Statistics and Data Analysis 48: 17-46.
- Pham Van Tat (2017) Development of New Anticancer Agents From Leaf of Plants In Viet Nam, LAP Lambert Academic Publishing, OmmiScriptum GmbH & Co KG, Germany
- Bui Thi Phuong Thuy Pham Van Tat (2012) Vietnam Journal of Chemistry 50(5A): 203-208.
- Bui Thi Phuong Thuy, Nguyen Thi Ai Nhung, Tran Duong, Phung Van Trung, Nguyen Minh Quang, et al. (2016) Prediction of anticancer activities of cynaroside and quercetin in leaf of plants Cynara scolymus L and Artocarpus incisa L using structure-activity relationship. Theoretical and Computational chemistry, Cogent Chemistry, Taylor & Francis, Cogent Chemistry 2(1).


