Saliva versus Blood Therapeutic Drug Monitoring of Tacrolimus in Jordanian Kidney Transplant Patients
Salim Hamadi1, Fathia Banna1, Izzat Al-Awwa2, Ahmad Al-Ghazawi3 and Nasir Idkaidek1*
1University of Petra, College of Pharmacy, Jordan
2Jordan university hospital, Amman, Jordan
3Triumpahrma LLC, Amman, Jordan
Submission: August 12, 2018; Published: September 20, 2018
*Corresponding author: Nasir Idkaidek, University of Petra, College of Pharmacy, Jordan.
How to cite this article: Salim H, Fathia B, Izzat A A, Ahmad A, Nasir I. Saliva versus Blood Therapeutic Drug Monitoring of Tacrolimus in Jordanian Kidney Transplant Patients. Nov Appro Drug Des Dev 2018; 4(2): 555632. DOI: 10.19080/NAPDD.2018.04.555632
Abstract
Tacrolimus is a macrolide antibiotic with immunosuppressive properties, it is indicated as primary immunosuppressive therapy following liver, heart and kidney transplantation, because of its better survival results and less acute cellular rejection than cyclosporine. The main objectives of this study are to investigate the robustness of using a non- invasive saliva sampling method instead of a blood sampling method as a surrogate for therapeutic drug monitoring (TDM) of tacrolimus among Jordanian patients, develop validated, sensitive and specific method (LC-MS/MS) for determination of tacrolimus in blood and saliva, determine the correlation between blood tacrolimus concentration versus saliva tacrolimus concentration and determine the variability in pharmacokinetic parameters of tacrolimus among patients to individualize dosage regimen. Forty two patients participated in this study. Two samples were collected from each patient two hours before morning dose, one sample is blood, and another is resting saliva sample.
Microsoft Excel program was used for descriptive statistics and t-testing. Optimized effective intestinal permeability of tacrolimus was estimated by PK-Sim program version 7, which classified tacrolimus as class III based on Salivary Excretion Classification System (SECS). A significant correlation of 0.51 (P < 0.05) between blood and saliva concentrations was observed, which indicate that saliva sampling is a good alternative matrix for tacrolimus TDM. Mean blood tacrolimus concentrations and mean saliva tacrolimus concentrations are 4.15 ng/ml and 0.93 ng/ml, respectively, with a mean saliva/blood ratio of 0.286. Calculated normal tacrolimus therapeutic range after the first six months of transplantation for both blood and saliva are (2.73-3.82) ng/ml and (0.93-1.3) ng/ml, respectively.
Introduction
Tacrolimus, formerly known as FK506, is a macrolide antibiotic with immunosuppressive properties. Although structurally unrelated to cyclosporine A (CsA), its mode of action is similar. Tacrolimus suppresses cell-mediated immune reactions, whereas humoral immunity is affected to a far lesser extent. It exerts its effects principally through impairment of gene expression in target cells. Tacrolimus binds to an immunophilin, FK506 binding protein (FKBP), this complex inhibits calcineurin phosphatase, which is responsible for dephosphorylation NFATc (Cytosolic Nuclear Factor of Activated T cells). The tacrolimus- calcineurin complex cannot perform this reaction; thus, NFATc cannot enter the nucleus to promote the reactions that are required for the synthesis of a number of cytokines, including IL-2. The end result is a decrease in IL-2, which is the primary chemical stimulus for increasing the number of T lymphocytes [1,2]. The immunosuppressive effect of tacrolimus was more highly potent than cyclosporine in vivo and in vitro studies [3].
Tacrolimus is characterized by a highly variable oral bioavailability 5% -93% (mean average 25%) [4]. Tacrolimus absorption from the gastrointestinal tract is to a large extent determined by the phenotypic, genotypic, and functional expression of CYP3A and P-glycoprotein in the liver and gut wall [5]. The massive uptake of tacrolimus by red blood cells caused by a tacrolimus binding protein with features similar to a specific protein found in lymphocytes [6], its apparent volume of distribution (Vd) regarding blood concentrations is much lower (1.0 to 1.5 L/kg) compared with values regarding plasma concentrations (about 30 L/kg) [7]. Tacrolimus is highly lipophilic drug and is excreted from the body after extensive metabolism [8].
Tacrolimus is 90% metabolized by both small intestinal and human liver microsomes [9]. CYP3A4 is a major analogue of CYP3A family, with 30-fold variations in CYP3A4 levels recorded for the small intestine and 10-100 fold variations recorded for liver [10]. Most of the administered dose was regained in feces, referring to that bile is the major route of elimination. Urinary excretion estimated for less than 3% of total administered dose. Not more than 0.5% of unchanged drug was measurable in feces and urine [11]. The terminal elimination half-life (t1/2) of tacrolimus is approximately 12 hours (with a range of 3.5 to 40.5 hours), so it needs 60 hours to reach steady state and start monitoring [7]. Due to narrow therapeutic index, high pharmacokinetic variability and many potential drug– drug interactions, close monitoring of blood concentrations is essential to prevent rejection and minimize toxicity, it is recommended to quantify tacrolimus in whole blood because of high distribution in erythrocytes: about 95% [12]. A common theory in therapeutic drug monitoring is that the trough concentration (C trough) will be a logical index of overall patient exposure to drug [6].
Tacrolimus is a highly lipophilic compound with log P and predicted pKa values of 3.3 and 9.96, respectively. Because of these characteristics, tacrolimus is not ionized at a physiological PH. Because only the free drug can pass through capillaries and reach the site of action, the portion of a drug that is present in the Oral Fluid (OF) should represent the free or pharmacologically active form of a drug. Given that the free concentration is responsible for both the therapeutic effect and toxicity, OF concentration may predict the therapeutic outcomes better than the total drug concentration [13,14].
Utility of saliva to monitor overall health, diagnose various oral or systemic disorders and drug monitoring. Saliva offers advantages over serum because it can be collected noninvasively by individuals with modest training, which offers a cost-effective approach for the screening of large populations. In addition, gland-specific saliva can also be used for diagnosis of pathology specific to one of the major salivary glands, with minimal risk of contracting infections during saliva collection. Saliva can be used in clinically challenging situations, such as obtaining samples from children or handicapped or anxious patients, in whom blood sampling could be a difficult act to perform [15,16].
Salivary Excretion Classification System (SECS) was established according to physicochemical properties of the drug. The two main parameters this system based on are protein binding and intestinal permeability of the drug, which classifies drugs into four classes [17]. Class I drugs of low protein binding with high intestinal permeability, like azithromycinare exposed to salivary excretion. Class II drugs of low protein binding with low intestinal permeability, like hydrochlorothiazide are exposed to salivary excretion since low permeability is counterbalanced by high fraction unbound. Class III drugs of high protein binding with high intestinal permeability, like rosuvastatin are exposed to salivary excretion since low fraction unbound is counterbalanced by high permeability. Class IV drugs of high protein binding with low intestinal permeability, like montelukast are not exposed to salivary excretion.
Objectives
The objectives are Investigate the robustness of using a noninvasive saliva sampling method instead of a blood sampling method as a surrogate for therapeutic drug monitoring of tacrolimus among Jordanian patients, develop validated, specific and sensitive LC-MS/MS method for determination of tacrolimus in blood and saliva, determine the correlation between blood tacrolimus concentration versus saliva tacrolimus concentration, and determine the variability in pharmacokinetic parameters of tacrolimus among patients.
Experimental
Study designs and human subjects
This study is an observational study that has been conducted at Jordan University Hospital/Ammanafter approval by Institutional Review Board (IRB). Forty two patients who treated with Tacrolimus (PanGraf®) were included in this study. Patients with kidney transplantation in nephrology department were enrolled in this study. Patients demographics were: age ranging from 22 to 67 years (mean 41.59, ±SD 11.35), female patients represent 33.3 % while male patients represent 66.7% in this study, actual weight of all patients is ranged from 52 to 102 kg (mean 77.35, ±SD 12.63). The patients were randomly selected if they reached steady state concentration for tacrolimus (steady state is achieved within 2 to 3 days of repeated administration), consent form is available. Two samples were taken from each patient, one sample of blood and another of resting saliva. Both samples are trough and were taken two hours before morning dose.
Assay methodology
Blank human blood and saliva samples were derived from healthy volunteers at Truimpharma LLC to establish and validate the method of analysis using LC-MS/MS (API 5500). Paracetamol internal standard 50 μl was added to 500 μl of subject blood or saliva, vortex the sample for about 15 seconds, 4 ml of Tert butyl methyl ether was added, vortex the sample for about 3 seconds, the samples were centrifuged at 4000 r.p.m for about 10 minutes, evaporation organic layer then reconstitution with 300 μl mobile phase, then transfer 200 μl to the Auto Sampler vial insert. Calibration curve were constructed by plotting the analytical response of the instrument (Analyte area/IS area) versus tacrolimus concentration. A linear relationship (R=0.9984) between the analytical response and concentrations of tacrolimus was obtained over concentration range (0.05-50) ng/ml and lower limit for quantification was 0.05 ng/ml for both blood and saliva. Average recovery was 97.9 for blood, and 99.8 for saliva. Method for both blood and saliva was linear in range of 0.05-50 ng/ml, with intra-day variability < 10%.
Data analysis
i. Optimized effective intestinal permeability
Effective intestinal permeability (Peff) values were estimated by Nelder-Mead algorithm of Parameter Estimation module using PK-Sim program V7. Nelder-Mead method, which is also called downhill simplex, is a commonly used nonlinear optimization algorithm. This was done by searching for the best parameter values that produce plasma concentration that matches the actual plasma concentration at the same time. The objective function is the weighted sum of squared differences of observed and model predicted values.
Fraction absorbed (Fa) of tacrolimus was calculated according to equations below:
Fa = 1 – e-2An
An = Peff * tres/R
An: absorption number, R: radius of human small intestine, tres: mean residence time.
R = 1.75 cm, tres = 3 hours
ii. Statistical analysis
Microsoft Excel program was used for descriptive statistics and ANOVA, t- testing after log transformation, P- value of 0.05 for significant difference.
Results and Discussion
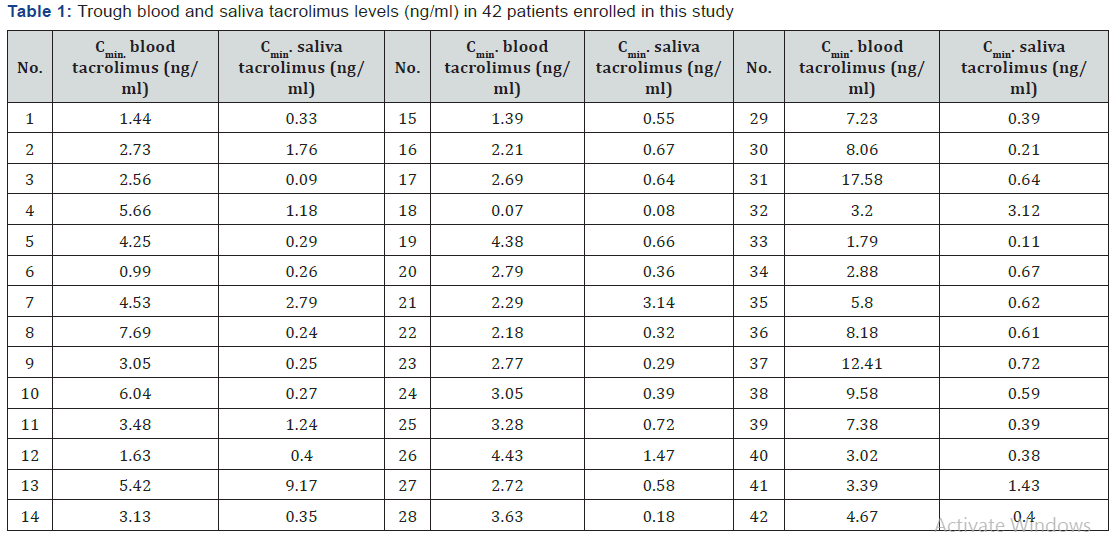
The trough blood tacrolimus levels in the forty two patients involved in this study, as shown in Table 1, ranged from .065 to 17.58 ng/ml with a mean level of 4.15 ng/ml, standard deviation ± 3.26 ng/ml, CV% = 78.6%.

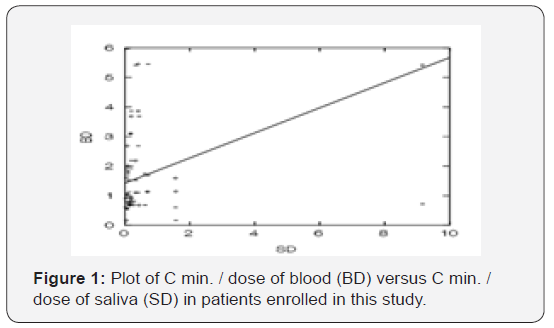
The trough saliva tacrolimus levels in the forty two patients involved in this study, as shown in Table 1, ranged from 0.08 to 9.17 ng/ml with a mean level of 0.93 ng/ml, standard deviation ± 1.5 (ng/ml), CV%= 161.8%. The results showed that there is strong correlation (P < 0.05) between blood and saliva among patients with correlation coefficient of 0.51 as shown in Figure 1, which indicates that saliva sample can be used as an alternative matrix for tacrolimus TDM.

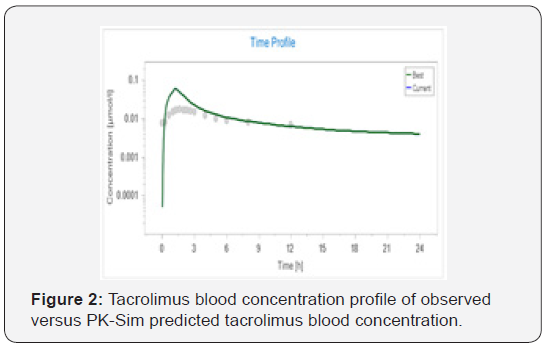
Tacrolimus is extensively bound to red blood cells, α1-acid glycoprotein and albumin. Tacrolimus as reported has low oral bioavailability, approximately 25% [18]. Based on Idkaidek and Arafat theory published in 2012 (SECS), the permeability and protein binding are major key factors in salivary excretion system. Permeability optimization was shown in Figure 2. Optimized effective permeability coefficient was 8.9 * 10-4 cm/ sec, with fraction absorbed (Fa)=0.99.Tacrolimus classified as class III drugs, with high protein binding and high intestinal permeability, so it exposed to salivary excretion since low fraction unbound is counterbalanced by high permeability.

Toxicology laboratory of Jordan university hospital used chemiluminescent microparticle immunoassay (CMIA) for tacrolimus analysis. Normal range considered by the lab depends mainly on the time of transplantation (according Abbott laboratories). Majority of patients in this study have been transplanted more than six months. Normal blood tacrolimus range after six months of transplantation (according to Abbott lab.) is 5-7 ng/ml.

The mean (SD) ratio of saliva to blood tacrolimus concentrations equal 0.286 (± 0.377), and the calculated normal blood and saliva levels are summarized in Table 2. The mean of ratios of LC-MS/MS to immunoassay tacrolimus concentrations equal 0.656, SD ± 0.455. This result consistent with which is reported, that immunoassay has a higher result than LC- MS/ MS, due to metabolites cross reactivity in immunoassays [19].

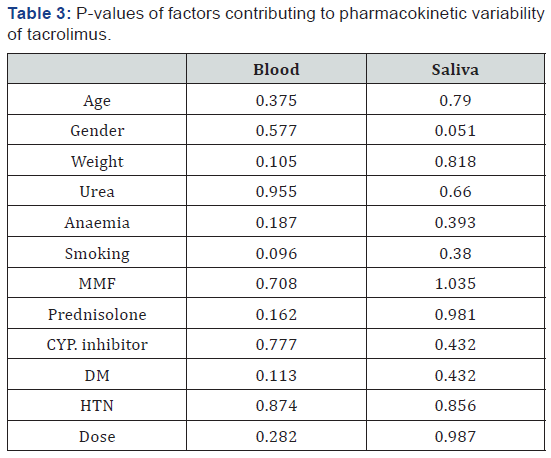
Analysis of variance (ANOVA) was also done using SYSTAT V5.0. It was found that there is no significant effect for these variable (gender, age, smoking, urea levels, diabetes mellitus (DM), hypertension (HTN) and co-administration of prednisolone, mycophenolate mofetil and CYP. Inhibitor drugs) on tacrolimus concentrations, as shown in Table 3. These results are consistent with which is reported that the CYP. genotype was the most significant covariate for the dose and dose‐adjusted trough levels of tacrolimus [20].
References
- Pillans Peter (2006) Experimental and Clinical Pharmacology: Immunosuppressants - Mechanisms of Action and Monitoring. Australian Prescriber 29(4): 99-101.
- Thomson AW, Bonham CA, Zeevi A (1995) Mode of Action of Tacrolimus (FK506): Molecular and Cellular Mechanisms. Ther Drug Monit 17(6): 584-591.
- Kino, Toru, Susumu Miyata, Noriaki Inamura, Michihisa Nishiyama, et al. (1987) FK-506, a Novel Immunosuppressant Isolated from a Streptomyces. II. Immunosuppressive Effect of FK-506 in Vitro. The Journal of Antibiotics 40(9): 1256-1265.
- Wallemacq PE, Furlan V, Möller A, Schäfer A, Stadler P, et al. (1998) Pharmacokinetics of Tacrolimus (FK506) in Pediatric Liver Transplant Recipients. European Journal of Drug Metabolism and Pharmacokinetics 23(3): 367-370.
- Kuypers DRJ, Claes K, Evenepoel P, Maes B, Vanrenterghem (2004). The Rate of Gastric Emptying Determines the Timing but Not the Extent of Oral Tacrolimus Absorption: Simultaneous Measurement of Drug Exposure and Gastric Emptying by Carbon-14-Octanoic Acid Breath Test in Stable Renal Allograft Recipients. Drug Metab Dispos 32(12): 1421-1425.
- Jusko William, Wojciech Piekoszewski, Goran B Klintmalm, Mark S Shaefer, Mary F Hebert, et al. (1995) Pharmacokinetics of Tacrolimus in Liver Transplant Patients. Clinical Pharmacology & Therapeutics 57(3): 281-290.
- Wallemacq, Pierre E, Roger K Verbeeck (2001) Comparative Clinical Pharmacokinetics of Tacrolimus in Paediatric and Adult Patients. Clin Pharmacokinet 40(4): 283-295.
- Iwasaki Kazuhide (2007) “Metabolism of Tacrolimus (FK506) and Recent Topics in Clinical Pharmacokinetics.” Drug Metab Pharmacokinet 22(5): 328-335.
- Heber MF (1997) Contributions of Hepatic and Intestinal Metabolism and P-Glycoprotein to Cyclosporine and Tacrolimus Oral Drug Delivery. Advanced Drug Delivery Reviews 27(2-3): 201-214.
- Wacher, Vincent J, Jeffrey A Silverman, Yuanchao Zhang, Leslie Z Benet (1998) Role of P-Glycoprotein and Cytochrome P450 3A in Limiting Oral Absorption of Peptides and Peptidomimetics. Journal of Pharmaceutical Sciences 87(11): 1322-1330.
- Möller A, Iwasaki K, Kawamura A, Teramura Y, Shiraga T, et al. (1999) The Disposition of 14C-Labeled Tacrolimus after Intravenous and Oral Administration in Healthy Human Subjects. Drug Metab Dispos 27(6): 633-636.
- Ansermot Nicolas, Marc Fathi, Jean Luc Veuthey, Jules Desmeules, Serge Rudaz, et al. (2008) Quantification of Cyclosporine and Tacrolimus in Whole Blood. Comparison of Liquid Chromatography–electrospray Mass Spectrometry with the Enzyme Multiplied Immunoassay Technique. Clinical Biochemistry 41(10–11): 910-913.
- Ghareeb Mwlod, Reginald Y Gohh, Fatemeh Akhlaghi (2018) Tacrolimus Concentration in Saliva of Kidney Transplant Recipients: Factors Influencing the Relationship with Whole Blood Concentrations. Clinical Pharmacokinetics 57(9): 1199-1210.
- 13. Haeckel R (1993) Factors Influencing the Saliva/Plasma Ratio of Drugs Annals of the New York Academy of Sciences 694(1): 128-1242.
- Pfaffe Tina, Cooper White J, Beyerlein P, Kostner K, Punyadeera C (2011) Diagnostic Potential of Saliva: Current State and Future Applications. Clin Chem 57(5): 675-687.
- 15. Soares Nunes, Lazaro Alessandro, Sayeeda Mussavira, and Omana Sukumaran Bindhu (2015) Clinical and Diagnostic Utility of Saliva as a Non-Invasive Diagnostic Fluid: A Systematic Review. Biochemi Med 25(2): 177-192.
- Idkaidek, Nasir, Tawfiq Arafat (2012) Saliva versus Plasma Pharmacokinetics: Theory and Application of a Salivary Excretion Classification System. Molecular Pharmaceutics 9(8): 2358-2363.
- Venkataramanan Raman, Arun Swaminathan, Tata Prasad, Ashok Jain, Sheila Zuckerman, et al. (1995) Clinical Pharmacokinetics of Tacrolimus. Clinical Pharmacokinetics 29(6): 404-430.
- Bazin C, Guinedor A, Barau C, Gozalo C, Grimbert P, et al. 2010. Evaluation of the Architect Tacrolimus Assay in Kidney, Liver, and Heart Transplant Recipients. J Pharma Biomedical Anal 53(4): 997-1002.
- Kim In Wha, Hyejin Noh, Eunhee Ji , Nayoung Han, Su Hyun Hong, et al. (2012) Identification of Factors Affecting Tacrolimus Level and 5-Year Clinical Outcome in Kidney Transplant Patients. Basic & Clinical Pharmacology & Toxicology 111(4): 217-223.


