Correlative Analysis of Serum M-Protein and Free Light Chain Values in Patients with Monoclonal Gammopathies
Raniah Al Amri*, Sarah E Wheeler and Michael R Shurin
Department of Pathology, Division of Clinical Immunopathology, University of Pittsburgh Medical Center, Pittsburgh, PA, USA
Submission:December 12, 2023;Published:January 03, 2024
*Corresponding author:Raniah Al Amri, Department of Pathology, University of Pittsburgh School of Medicine, Pittsburgh, PA, USA, E-mail Id: alamrird@upmc.edu
How to cite this article:Raniah Al A, Sarah E W, Michael R S. Correlative Analysis of Serum M-Protein and Free Light Chain Values in Patients with Monoclonal Gammopathies. J Tumor Med Prev. 2024; 4(3): 555637.DOI: 10.19080/ JTMP.2024.04.555637
Abstract
The goal of this study was to assess the correlation between the serum M-protein spike and the levels of serum free light chain concentrations and free light chain ratio. We retrospectively analyzed the serum samples of 248 patients diagnosed with monoclonal gammopathy, and sizes of M-protein, free light chain concentrations, and free light chain ratio were all correlated. Our findings revealed a statistical correlation between the size of monoclonal immunoglobulin and increased values of free light chain and free light chain ratio in kappa and lambda gammopathy patients. However, the correlation values obtained were relatively low, confirming limitations interchangeably using M-spike size and free light chain ratio. Further research is needed to explore additional factors influencing this relationship.
Keywords:Serum Protein Electrophoresis; Monoclonal Proteins; Free Light Chains; Multiple Myeloma; Monoclonal Gammopathy
Abbreviations:MGUS: Monoclonal Gammopathy of Undetermined Significance; MM: Multiple Myeloma; UPEP: Urine Protein Electrophoresis; SPEP: Serum Protein Electrophoresis; IFE: Immunofixation Electrophoresis; FLC: Free Light Chain
Introduction
Monoclonal gammopathies, also known as paraproteinemia, are distinguished by the clonal enlargement of plasma cells or undifferentiated B-cells with the expression of a monoclonal immunoglobulin or their monoclonal components. Monoclonal gammopathies include a variety of diseases, from monoclonal gammopathy of undetermined significance (MGUS), monoclonal gammopathy of clinical significance (MGCS), and smoldering or asymptomatic multiple myeloma (MM) to progressive plasma cell MM, amyloid light-chain amyloidosis, light chain deposition disease, and non-Hodgkin lymphoma, among others [1]. Laboratory procedures and techniques for diagnosis and monitoring of paraproteinemia have progressed to comprise total urine and serum protein electrophoresis (SPEP, UPEP), refinement immunofixation electrophoresis (IFE), capillary zone electrophoresis with immuno subtraction, serum and urine free light chain (FLC) assays, mass spectrometry and recently developed the QUIET method for measuring monoclonal immunoglobulin free light chains in serum [2]. Supplementary testing comprises measuring total serum and urine proteins,quantifying serum IgG, IgM, and IgA, and valuing key protein groups and monoclonal immunoglobulin in electropherograms by densitometry. Historically, in addition to SPEP and IFE, which are still the most used laboratory diagnostic techniques for the recognition of monoclonal immunoglobulins or M-spikes, the FLC assay has become an important addition for the detection and characterization of monoclonal gammopathies.
Today, the measurement of FLC represents a fundamental part of evaluating individuals with monoclonal gammopathies. In fact, serum FLC levels are accepted biomarkers of plasma cell expansion, and their evaluation has been included in current standards endorsed by the International Myeloma Working Group for managing patients suffering from plasma cell dyscrasias [3]. Different FLC assays have been evaluated and correlated and are now clinically available. Widely used nephelometry- or turbidimetry-based methods employ highly specific detection antibodies against the inner epitopes of free kappa (κ) and free lambda (λ) light chains. The assessment quantifies the free chains and their mutual κ/λ ratio. This light chain clonality index addresses the presence and proliferation of an unusual plasma cell or B-cell subset. These entities are commonly accompanied by the production of whole immunoglobulin molecules or their light chain fragments. Even in normal conditions, light chain molecules are generated more than heavy chain molecules, and a monoclonal gammopathy making the whole immunoglobulin generates an extra amount of free light chains circulating in the blood. In patients with systemic inflammation and renal failure, the increase of FLC is polyclonal and is seen as an increase in usually both light chain values and a normal κ/λ ratio. In B cell malignancies, the increase is usually monoclonal and characterized by an increase of a specific FLC leading to an abnormal κ/λ ratio [3].
The combination of the κ/λ ratio with the M-protein size and isotype has long been used as a generally accepted clinical stratification system for diagnosing and monitoring monoclonal gammopathy patients. Furthermore, the serum κ/λ ratio is a simple marker to differentiate between malignant and benign plasma cell conditions [4]. Moreover, the utilization of serum FLC is particularly important in assessing non-secretory plasma cell illnesses as the sensitivity is almost 100% in case of nonsecretory plasma cell myeloma with secreted M-proteins [5,6]. While several different analytical methods for the detection of FLC have been validated and become commercially available, providing an opportunity to acquire different values with a sizeable impact on the management of monoclonal gammopathies patients, the question of whether the serum FLC concentrations correlate with the size of M-spike seen on SPEP has not yet been resolved. Therefore, this study aimed to conduct a retrospective comparative analysis between the FLC results and M-spike densitometric values in patients with monoclonal gammopathies. This investigation sought to determine whether abnormal FLC values and κ/λ ratio could serve as a marker of the magnitude of the visual M-spike identified through serum electrophoretic techniques. Furthermore, we aimed to evaluate the clinical feasibility of adopting the FLC ratio as a substitute measure for assessing M-protein dimensions in the assessment of monoclonal gammopathy patients.
Materials and Methods
Study Design and Participants
A total of 248 divisions from October 2020 to January 2021 were submitted for standard of care clinical analysis for TPE, IEP, and FLC at the University of Pittsburgh Medical Center, Clinical Immunopathology division were included in the study. These samples were submitted as part of routine screening, diagnosis, or monitoring for monoclonal gammopathies, including MGUS, multiple myeloma, Waldenström disease, and plasmacytoma, and had TPE, IEP, and FLC measurements performed. Blood samples were harvested in serum separator vacutainer tubes and centrifuged at 2,000 g for 10 min at room temperature for serum collection. The serum samples were then used for TPE, IEP, and FLC assays. All test results obtained during the study period were collected from the database in anonymized form according to the UPMC quality assurance regulations, the Declaration of Helsinki, and all applicable local legislations.
Protein Electrophoresis and Immunofixation Electrophoresis
TPE and IEP tests were done on the Helena SPIFE 3000 analyzer (Helena Laboratories Corp., Beaumont, TX, USA) based on the manufacturer’s protocols and reagents. All serum samples were diluted and loaded automatically by Helena Electrophoresis Sample Handler. Total protein concentrations in serum specimens were measured by digital refractometry (Index Instruments US Inc., Kissimmee, FL, USA). Antibodies to IgG, IgA, IgM, and kappa and lambda chains for immuno electrophoresis were provided by the SPIFE Immuno Fix kits. The relative percent and absolute values of each protein band, including the size of the M-spike, were automatically determined by the Helena Quick Scan 2000 densitometer with the Helena Software package. All proteins in the TPE procedure were stained with acid blue dye. After the immunofixation of immunoglobulins, acid violet was utilized for protein staining, and the monoclonal bands and polyclonal areas were visually identified by the experienced pathologists.
Measurements of Serum-Free Light Chains
Concentrations of free κ and free λ light chains in serum specimens were determined by latex-enhanced κ sFLC and λ sFLC Freelite assays (The Binding Site Group Ltd, Birmingham, UK) using Optilite turbidimeter (The Binding Site) according to the manufacturer’s protocols. Specific protein concentrations in these test samples were automatically determined using a calibration plot established by the instrument. The free light chain concentrations and κ/λ ratio were reported abnormal if they were beyond the normal reference range established by the manufacturer (κ: 3.3-19.4 mg/L; λ: 5.7-26.3 mg/L; κ/λ ratio: 0.26- 1.65).
Statistical Analysis
Correlation analysis was performed utilizing Pearson correlation as our measurements were taken from an interval scale. For the evaluation of normality, the Shapiro-Wilk normality test was used which showed skewed distribution of the data. Hence, the free κ, λ, and the ratios data were transformed to logarithmic values and plotted with log scale of M-spike size. Hypothesis testing was two-sided, and p values < 0.05 were considered significant. Statistical analysis, data evaluation, and result presentation were conducted using Prizm (Version 9, GraphPad, San Diego, CA, USA) and SigmaPlot (SPSS, Palo Alto, CA, USA) (Table 1).
Results
Distribution Analysis of Free Light Chain Data
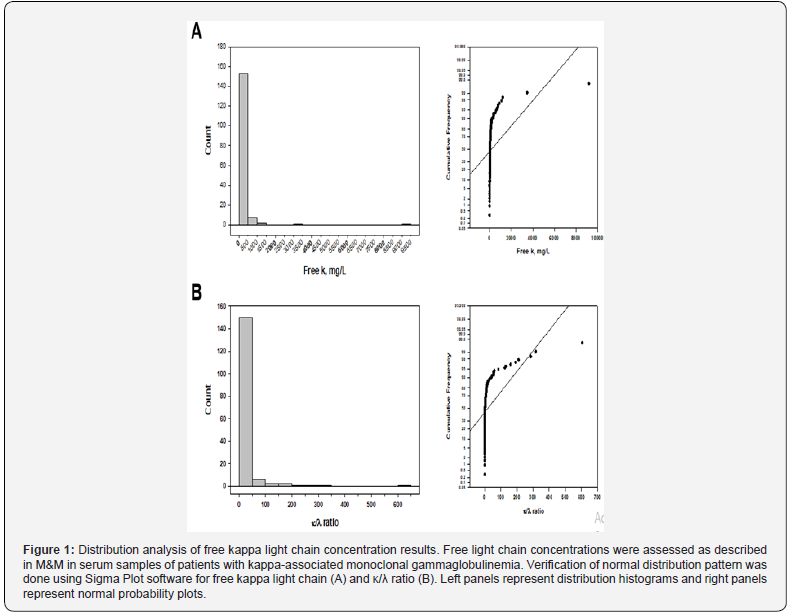
Initial evaluation of data for kappa-associated gammopathies, including free κ, κ/λ ratio, and M-spike size (n=164, Shapiro-Wilk normality test) revealed that normality tests failed indicating a significant data variation compared with the pattern anticipated when the results are obtained from a set with a normal distribution. Both the visual distribution of FLC data and the normal probability plot confirm this conclusion. Figure 1 shows histograms of a rightskewed distribution for both free κ (Figure 1A) and κ/λ ratio (Figure 1B) results (left panels). The right panels represent normal probability plots that graphically identify substantive departures from normality. Importantly, there was a significant correlation between the free κ and κ/λ ratio data (r=0.878, p<0.001) for patients with kappa-associated gammopathies confirming the clinical meaning of these results. Descriptive statistical results are summarized in Table 2.


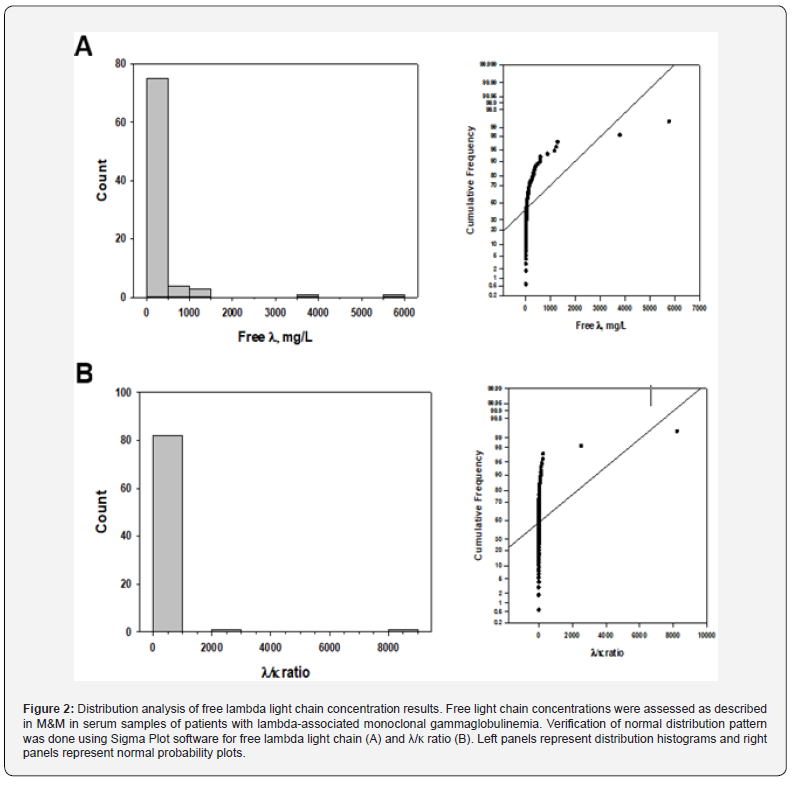
Evaluation of data for lambda-associated gammopathies, including free λ, λ/κ ratio and M-spike size (n=84, Shapiro-Wilk normality test) revealed similar results. Histograms of a rightskewed distribution for both free λ (Figure 2A) and λ/κ ratio (Figure 2B) results (left panels) together with normal probability plots (Figure 2 right panels) demonstrate the normal distribution of analyzed serum parameters. Of note, λ/κ ratio numbers were used instead of very low κ/λ ratio numbers for improved analysis and visualization of results reflecting data correlation for lambdaassociated gammopathies. Furthermore, the correlation between the free λ and λ/κ ratio data was statistically significant (r=0.912, p<0.001) confirming the clinical meaning of these parameters. Descriptive statistical results are summarized in Table 3.

Correlation analysis of M-spike size and free light chain data
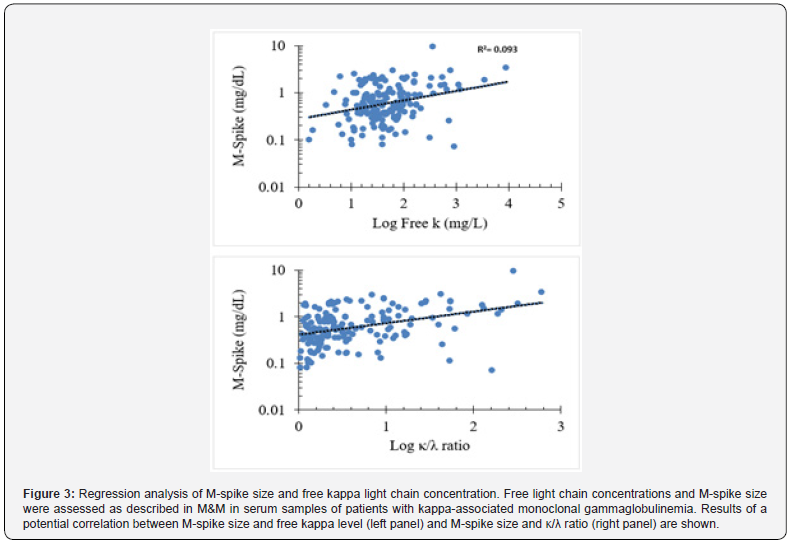
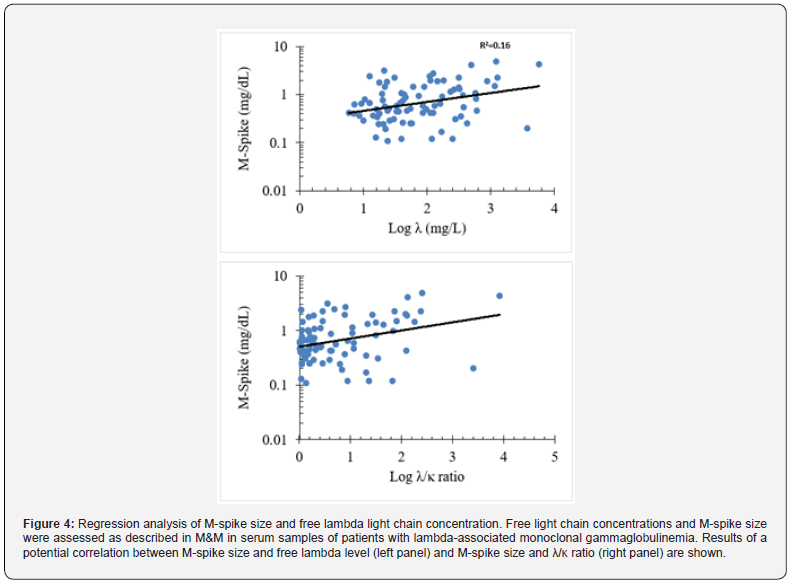
The correlation between free κ light chain and M-spike variables for kappa-associated gammopathies was R = 0.305, which indicates variables that have little (linear) correlation as p< 0.0001 (Figure 3, left panel). Since R2 = 0.093, it implies that only ~9% of the variation in M-spike size can be associated with specific free κ light chain concentrations. A higher positive correlation was identified between κ/λ ratio and M-spike size with R2 = = 0.453 (p<0.0001) (Figure 3, right panel). These results suggest that the size of the M-spike positively correlates with increased values of free kappa light chain and κ/λ ratio in serum from patients diagnosed with kappa-associated monoclonal gammopathies. Next, Pearson correlation analysis of M-spike values and free λ and λ/κ ratio data for lambda-associated gammopathies revealed correlation R2 = 0.404 (p<0.0001) and R2 = 0.473 (p<0.0001), respectively (Figure 4). Since R2 = 0.16, it implies that ~16% of the variation in M-spike size can be associated with specific free κ light chain concentrations. These results revealed that the size of the M-spike assessed by serum TPE analysis positively correlated with increased values of free lambda light chain and λ/κ ratio in serum from patients diagnosed with lambda-associated monoclonal gammopathies.
Discussion
In our study, the enumerated parameters of M-protein and corresponding alterations in FLC values and light chain ratio were correlated. The results revealed a relatively low, although statistically significant, correlation between M-spike size and concentrations of serum FLC, especially for the free kappa light chain but a markedly higher correlation between M-protein values and FLC ratios. Although it is reported that elevated serum FLC (κ+λ) levels are highly correlated with an added risk of developing monoclonal gammopathy [7]. Furthermore, Singh et al. emphasized that FLC concentrations and κ/λ ratio were less consonant with the proven identification of monoclonal gammopathy [7]. In their report, the FLC κ/λ ratio rates did not detect 27% of all monoclonal gammopathies, specifically the κ/λ ratio was within the normal reference interval for 31.2% of λ-associated gammopathies and 23.7% of κ-associated gammopathies. However, for MGUS, 55% of the samples tested had a κ/λ ratio rate within the reference interval, concluding that these methods cannot serve as a stand-alone diagnostic assessment to rule out MGUS, and should be confirmed with electrophoresis methods and/or the analysis of the bone marrow specimens to establish a diagnosis of monoclonal gammopathy [8]. Our data, on the other hand, showed that λ and λ/κ ratio had a slightly better correlation with M-spike size than κ and κ/λ ratio. Regardless, the deficiencies of FLC detection and enumeration in individuals with and without established paraproteinemia have been reported in specific clinical settings [9,10]. SPEP and IFE results were reported to be more concurring with the proven disease more frequently than κ/λ ratio values, which does not exclude the possibility of monoclonal gammopathy by having a normal κ/λ ratio values, as shown herein and elsewhere [8,9].
The measurement of FLC in serum specimens is a highly specific and sensitive method, although it encounters several deficiencies, including cases with kidney dysfunction where the serum FLC concentrations are greatly affected. In the case of chronic kidney disease, the half‐life of FLC in serum elevates significantly and, thus, interferes with the accurate characterization of FLC concentrations [11]. Second, given that FLC is unique in each person, the detection of individual light chains may vary considerably depending on the utilized methodology [12]. Since the Free lite method used here utilizes one type of polyclonal antibody for detecting FLC, it is possible that not all antigenic determinants can be detected, and certain types of FLC alterations common in paraproteinemia may evade correct assessment [10]. In addition, pure correlations observed between the two parameters in our study might be due to the polymerization of free light chains, causing a possible overrating in certain samples [13]. Despite the utilization of methodologies that correctly capture antigen excess, some specimens comprising specific monoclonal light chains may demonstrate a non-linear dilution trend resulting in higher anticipated results in the subsequent diluted samples [14]. It was also reported that sufficient concentrations of polyclonal FLC can mask correct levels of serum κ/λ ratios [15]. Interestingly, it was also shown that the incorrect values of κ/λ ratio may be induced by the deficiency of light chain production of secretion, predominantly κ light chain. Such cases with suspicious κ/λ ratio and typically decreased concentrations of serum FLC may point to a B cell misfunction, rather than a B cell clonal expansion [16].

In humans, it has been documented that plasma cell myelomas are 60:40 of κ to λ chain, like the ratio of immunoglobulins production [7]. In the present study, the κ chain gammopathy was two-fold higher than λ gammopathy. This may raise the possibility that λ gammopathy is under-detected if only serum testing has been performed and urine proteins were less than 200 mg/L [17]. Furthermore, our results suggest that patient screening or management based exclusively on FLC detection may underscore some patients due to incorrect differential classification. Some patients may be judged at greater risk in the case of MGUS or may have an inadequate reaction to therapy in the case of multiple myeloma. For instance, an increase in false-negative κ/λ ratio rate was reported in patients with visible monoclonal gammopathy with λ light chain monoclonal immunoglobulins [8]. Thus, although the correlation between M-protein size and abnormal FLC concentrations and ratio was detected, the clinical feasibility of practical utilization of these results is still questionable.

Limitations
The limitation of the present study relies on its retrospective nature and the lack of comprehensive clinical characterization of the gammopathy subtype. Secondly, the patient’s clinical conditions, such as kidney function status, were not studied in relation to serum light chain concentrations. The current data allow us to question the interchangeable usage of M-spike and serum FLC parameters for monitoring patients with proven monoclonal gammopathy as well as the clinical practicability of the FLC ratio as a substitute for M-protein size in evaluating these patients.
Conclusion
In conclusion, our results revealed a statistical correlation between the size of serum M-spike detected by electrophoresis assay and increased values of free light chains and FLC ratios. However, the low correlation coefficient values between the M-spike size and free light chain ratio does not necessarily suggest that these tests may be used interchangeably for diagnosis or monitoring purposes.
Acknowledgment
The authors are thankful to the technologists in the Division of Clinical Immunopathology, Section of Laboratory Medicine, Department of Pathology. This study did not receive grants from any funding agency in the public, commercial, or not-for-profit sectors.
Author Declarations
The authors confirm that all relevant ethical guidelines have been followed, and all necessary IRB and/or ethics committee approvals have been obtained. Helena Lab and Binding Site Inc. had no role in experimental design, collection of results, data analysis and interpretation, or writing or editing of the manuscript. The authors had complete access to all the databases and confirmed final responsibility for the decision to submit for publication.

References
- Attaelmannan M, Levinson SS (2000) Understanding and identifying monoclonal gammopathies. Clin Chem 46(8 Pt 2): 1230-1238.
- Singh G (2020) Serum and Urine Protein Electrophoresis and Serum-Free Light Chain Assays in the Diagnosis and Monitoring of Monoclonal Gammopathies. J Appl Lab Med 5(6): 1358-1371.
- Dispenzieri A, Kyle R, Merlini G, Miguel JS, Ludwig H, et al. (2009) International Myeloma Working Group guidelines for serum-free light chain analysis in multiple myeloma and related disorders. Leukemia 23(2): 215-224.
- Xu B, Tang Y, Zhou J, Zhang P, Li H (2017) Disease spectrum of abnormal serum free light chain ratio and its diagnostic significance. Oncotarget 8(47): 82268-82279.
- Milani P, Palladini G, Merlini G (2016) Serum-free light-chain analysis in diagnosis and management of multiple myeloma and related conditions. Scand J Clin Lab Invest Suppl 245: S113-118.
- Heaney JLJ, Richter A, Bowcock S, Pratt G, Child JA, et al. (2020) Excluding myeloma diagnosis using revised thresholds for serum free light chain ratios and M-protein levels. Haematologica 105(4): e169-e171.
- Kumar S, Larson DR, Dispenzieri A, Therneau TM, Murray DL, et al. (2019) Polyclonal serum free light chain elevation is associated with increased risk of monoclonal gammopathies. Blood Cancer J 9(6): 49.
- Singh G (2017) Serum Free Light Chain Assay and κ/λ Ratio: Performance in Patients with Monoclonal Gammopathy-High False Negative Rate for κ/λ J Clin Med Res 9(1): 46-57.
- Jaskowski TD, Litwin CM, Hill HR (2006) Detection of kappa and lambda light chain monoclonal proteins in human serum: automated immunoassay versus immunofixation electrophoresis. Clin Vaccine Immunol 13(2): 277-280.
- Caponi L, Romiti N, Koni E, Fiore AD, Paolicchi A, (2020) Inter-assay variability in automated serum free light chain assays and their use in the clinical laboratory. Crit Rev Clin Lab Sci 57(2): 73-85.
- Basnayake K, Stringer SJ, Hutchison CA, Cockwell P (2011) The biology of immunoglobulin free light chains and kidney injury. Kidney Int 79(12): 1289-1301.
- Abroud H, Beldi-Ferchiou A, Audard V, Lemonnier F, Le Bras F, et al. (2022) Evaluation of a new ELISA assay for monoclonal free-light chain detection in patients with cardiac amyloidosis. EJHaem 3(3): 828-837.
- De Kat Angelino CM, Raymakers R, Teunesen MA, Jacobs JF, Klasen IS (2010) Overestimation of serum kappa free light chain concentration by immunonephelometry. Clin Chem 56(7): 1188-1190.
- Te Velthuis H, Drayson M, Campbell JP (2016) Measurement of free light chains with assays based on monoclonal antibodies. Clin Chem Lab Med 54(6): 1005-1114.
- Levinson SS (2010) Polyclonal free light chain of Ig may interfere with interpretation of monoclonal free light chain κ/λ Ann Clin Lab Sci 40(4): 348-353.
- Unsworth DJ, Wallage MJ, Sarkar E, Lock RJ (2012) Abnormalities of serum-free light chain in patients with primary antibody deficiency in the absence of B lymphocyte clonality. J Clin Pathol 65(12): 1128-1131.
- Lee WS, Singh G (2018) Serum Free Light Chains in Neoplastic Monoclonal Gammopathies: Relative Under-Detection of Lambda Dominant Kappa/Lambda Ratio, and Underproduction of Free Lambda Light Chains, as Compared to Kappa Light Chains, in Patients with Neoplastic Monoclonal Gammopathies. J Clin Med Res 10(7): 562-569.


