Metabolic Syndrome, Health-Related Quality of Life, and Social Risk: A Structural Equation Modeling Analysis
Peter D Hart1-3*
1Health Promotion Program, Montana State University - Northern, Havre, Montana
2Kinesmetrics Lab, Montana State University - Northern, Havre, Montana
3Health Demographics, Havre, Montana
Submission: January 17, 2018; Published: January 24, 2018
*Corresponding author: Peter D Hart, Associate Professor, Health Promotion College of Education, Arts & Sciences and Nursing, Montana State University - Northern, Havre, Montana, Fax: 406.265.4129; Tel: 406.265.3719; Email: peter.hart@msun.edu
How to cite this article: Peter D Hart. Metabolic Syndrome, Health-Related Quality of Life, and Social Risk: A Structural Equation Modeling Analysis. J Phy Fit Treatment & Sports. 2018; 1(4): 555568 DOI: 10.19080/JPFMTS.2018.01.555568
Abstract
Background: The purpose of this study was to use SEM to investigate the relationship between a latent construct of metabolic syndrome (MetS) and health-related quality of life (HRQOL) through a measure of social risk (SR) in younger adults.
Methods: Data for this research came from the 2013-14 NHANES and included (N=1,060) adults 20 to 49 years of age. A latent construct of MetS was created using five indicators that included waist circumference, high density lipoprotein, triglycerides, glucose, and mean arterial pressure. A SR score was created using four variables that included race (non-white), income (below poverty threshold), education (less than high school), and marital status (single). HRQOL was determined from a single five category question regarding self-rated general health ranging from excellent to poor.
Results: The MetS measurement model showed adequate fit (χ2/d/=4.76, GFI = 0.99, CFI = 0.99, and RMSEA=0.06) with all indicators significantly (ps<.001) loading to the construct. Multi-group analysis indicated a significant lack of measurement invariance by sex (χ2= 1.99, p=.017). Sex-specific structural models showed adequate fit with significant direct effects (beta, p-value) of MetS on HRQOL (males: -0.45, <.001 and females: -0.51, <.001) and SR on HRQOL (males: -0.16,<.001 and females: -0.15, <.001). SR partially mediated the MetS and HRQOL relationship with a positive indirect effect seen in males (b=.002, p=.020) and a negative indirect effect seen in females (b=-.002, p=.004).
Conclusion: SR was found to mediate the MetS and HRQOL relationship in younger adults, with SR contributing to its total negative relationship in females.
Keywords: Structural equation modeling (SEM); Epidemiology; Metabolic syndrome; Social risk; Health-related quality of life (HRQOL)gies
Abbreviations: SEM: Structural equation modeling; HRQOL: Health-Related Quality of Life; MetS: Metabolic Syndrome; SR: Social Risk; NCEP'S: National Cholesterol Education Program's; WC: Waist Circumference; SBP: Elevated Systolic; DBP: Diastolic Blood Pressure; HDL: High Density Lipoprotein; NHANES: National Health and Nutrition Examination Survey; MAP: Mean Arterial Pressure; AIC: Akaike's Information Criterion
Introduction
The Third Report of the Expert Panel on Detection, Evaluation, and Treatment of High Blood Cholesterol in Adults (ATP III) (which is the National Cholesterol Education Program's (NCEP's) guidelines for cholesterol testing and management) defines metabolic syndrome (MetS) as a clustering of any three (3) of the following risk factors: large waist circumference (WC), elevated systolic (SBP) or diastolic blood pressure (DBP), elevated triglycerides, low high density lipoprotein (HDL), or elevated fasting blood glucose [1,2]. MetS has become a major medical concern because of its strong relationship with increased risk for heart disease [3-5], stroke [6-8], diabetes [911], premature mortality [12-14] and even mental illness [1517]. Health-related quality of life (HRQOL) is a broad measure that most often involves an individual's subjective view of their own physical and/or mental health status [18]. HRQOL is an outcome measure commonly used in health science research, including both cross-sectional correlation studies and longitudinal behavioral interventions [19-22].
In the U.S., socially disadvantaged individuals are at increased risk of both poor HRQOL [23-25] and MetS [26-28]. However, less is known about the cumulative effect of several social risk factors on health outcomes such as HRQOL [29]. Additionally, MetS is known to be associated with poor HRQOL [30-32]. Given these known associations between MetS, SR, and HRQOL, supporting evidence specifically showing how much cumulative SR contributes to the MetS and HRQOL relationship is limited. Additionally, few studies have investigated the extent to which sex moderates the mediating effects of SR on the MetS and HRQOL relationship. Therefore, the purpose of this study was to use structural equation modeling (SEM) to investigate the mediating effects of SR on the MetS and HRQOL relationship.
Methods
Participants and design
The 2013-14 National Health and Nutrition Examination Survey (NHANES) was used for this study. The National Center for Health Statistics and Centers for Disease Control and Prevention are responsible for collecting NHANES data, which include health and demographic survey responses (e.g., age, marital status, food frequency, smoking history, physical activity behavior, etc.) as well as physical exam (e.g., blood pressure, waist circumference, grip strength, etc.) and laboratory (e.g., fasting blood glucose, HDL cholesterol, pregnancy test, etc.) measures [33]. This study used all three types of data, which were downloaded from four different NHANES component areas: Demographics, Examination, Laboratory, and Questionnaire. Data for this study were restricted to participants who had complete information for all relevant study variables and who 20 to 49 years of age were. The current study was only interested in establishing relationships in a convenient sample of adults, therefore, NHANES sampling weights and complex sampling methods were not employed.
Measures
This study used four different types of observed variables:
a) MetS indicator variables,
b) SR,
c) HRQOL and
d) Control variables.
MetS indicator variables were used to measure latent MetS and included waist circumference (WC), high density lipoprotein (HDL) cholesterol, fasting blood glucose (GLUC), blood triglycerides (TRIG), and mean arterial pressure (MAP) [33]. WC was measured by a trained NHANES health professional. WC location was just above the uppermost lateral border of the right ilium at the midaxillary line. MAP was computed using mean values of systolic (SBP) and diastolic blood pressure (SBP) measurements and the following formula: MAP= (2*DBP+SBP)/3. Finally, HDL, GLUC, and TRIG were measured by medical staff via fasting blood samples. SR was assessed using self-reported demographics data regarding participant race/ ethnicity, income, education, and marital status [34]. The first step in creating the SR score was to create binary variables of each SR factor.
The original race/ethnicity variable was recorded into a binary variable where '1' indicated 'non-white' and ‘0’ indicated 'white'. The original income variable was recorded into a binary variable where '1' indicated 'below poverty threshold' and '0' indicated 'at or above poverty threshold'. The original education variable was recorded into a binary variable where '1' indicated 'less than high school educated' and '0' indicated 'at least high school educated'. Finally, the original marital status variable was recorded into a binary variable where '1' indicated 'single status’ and '0' indicated 'not single statuses. The second and last step involved creating the SR score variable by summing the four binary SR factors. SR scores ranged from zero to four where zero represented the lowest level of social risk and four represented the highest level of social risk. HRQOL was assessed using a single item from the Current Health Status section [33]. Specifically, general HRQOL was assessed from the following question: "Would you say your health in general is: Excellent, Very good, Good, Fair, or poor?". In this study, the HRQOL variable was coded as follows: 5= Excellent, 4= Very good, 3= Good, 2= Fair and 1= Poor. Finally, control variables were used to control for possible confounding and included respondent age and sex.
Statistical Analysis
Descriptive statistics, including means and standard deviations, were computed for all MetS indicator variables across HRQOL status. Because some MetS variables had slight skewness, both parametric (t tests) and nonparametric (Wilcoxon tests) statistics were used to ensure robust findings. Correlation coefficients were computed to show the extent of linear relationships in study variables, where both Pearson and Spearman correlation coefficients were computed. Since both sets of coefficients were similar, Pearson coefficients only were reported. The SEM analysis was performed in a series of steps, including:
a) Specifying, identifying, and assessing fit of the MetS measurement model,
b) Assessing measurement model invariance across sex groups by running a multi-group analysis,
c) Assessing fit of the MetS, SR, and HRQOL structural model, and
d) Assessing the mediating effect of SR on the MetS and HRQOL relationship.
Model fit was assessed using the following statistics and criteria: comparative fit index (CFI > 0.90), root mean square error of approximation (RMSEA < 0.08), goodness of fit index (GFI > 0.90), adjusted goodness of fit index (AGFI > 0.90), Tucker-Lewis index (TLI > 0.90), normed fit index (NFI > 0.90), and Akaike's information criterion (AIC, relatively lower values indicate better fit) [35]. As well, the chi-square statistic (χ2) to degrees of freedom (df) ratio (i.e., normed chi-square) was used with acceptable criteria of less than 5.0 [36]. Mediation was tested using the Bias-corrected Bootstrap method [37]. SPSS and AMOS version 24 and the R lavaan package were used for SEM procedures with both maximal likelihood and nonparametric estimation methods [38-40]. SAS version 9.4 was used for all descriptive statistics [41].
Results
Table 1 displays descriptive statistics of the MetS risk factors, overall and by sex. On average, males had larger WC, greater values of GLUC, TRIG, and MAP and lower values of HDL, as compared to females (ps<.05). Additionally, younger adults reporting good HRQOL had superior (ps<.05) MetS risk factor values, with exception of male TRIG, as compared to those reporting poor HRQOL. Table 2 displays a correlation matrix of study variables. All relevant variables were significantly (ps<.05) related to each other, with the exception of SR with MetS risk factors. Figure 1 displays the fitted MetS measurement model for all younger adults, which specifies that latent MetS causes WC, HDL, GLUC, TRIG, and MAP. This measurement model fit well (χ2/df= 4.76, GFI = 0.99, CFI = 0.99, and RMSEA= 0.06) and significantly (ps<.001) predicted all observed variables (Table 3). The loadings indicate the positive relationship between MetS and its risk factors, except for HDL, which is negatively related. The displayed measurement model also reflects the correlations between three sets of error terms (WCerror with TRIG error , HDLerror TRIGerror , and GLUCerror with TRIGerror ), with which significantly improved model fit (χ2 = 56.94, p<.001).
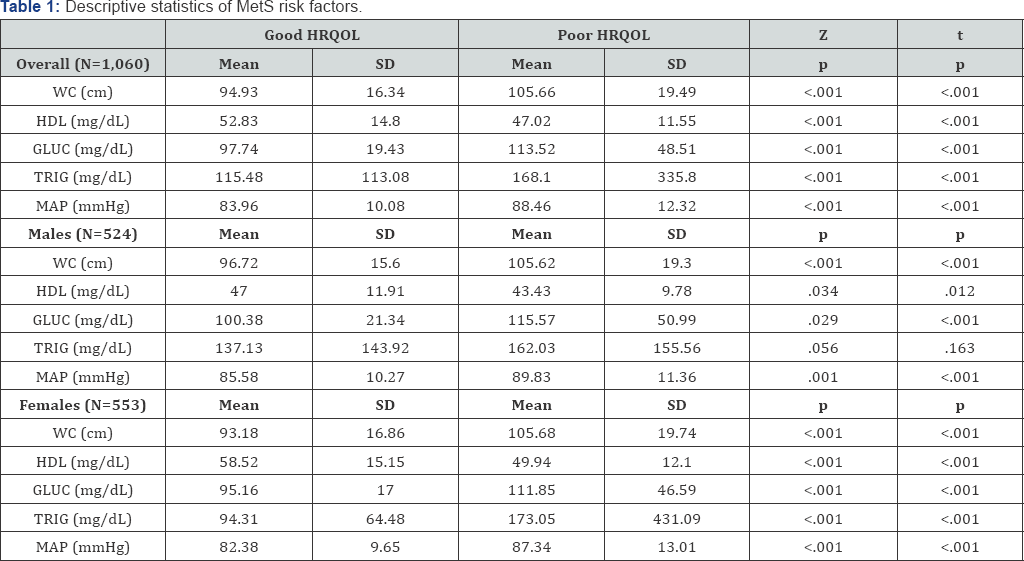
Note: WC is waist circumference. HDL is high density lipoprotein. GLUC is fasting glucose. TRIG is triglycerides. MAP is mean arterial pressure. Min is minimum value. Max is maximal value. Mean is average. SD is standard deviation. Good HRQOL was defined as adults reporting either 'excellent', 'very good', or 'good' general health. Poor HRQOL was defined as adults reporting either 'fair' or 'poor' general health. Z test p-value is for Wilcoxon independent samples test. T test p-value is for independent samples t test.

Note: N=1,060. WC is waist circumference. HDL is high density lipoprotein. GLUC is fasting glucose. TRIG is triglycerides. MAP is mean arterial pressure. MVPA is moderate and vigorous physical activity. HRQOL is health-related quality of life. Pearson and Spearman coefficients were similar and Pearson coefficients are presented. Coefficients in bold are significant (p<.05).

Note: χ2/df is chi-square divided by degrees of freedom. CFI is comparative fit index. RMSEA is root mean square error of approximation. GFI is goodness of fit index. AGFI is adjusted goodness of fit index. TLI is Tucker-Lewis index. NFI is normed fit index. AIC is Akaike's information criterion. *a relatively smaller AIC indicates a better fit.

Note: χ2 statistics for multi-group analyses constrains parameters to be equal across sex groups, with a null hypothesis that the more constrained model is correct under the assumption that the less constrained model is correct.
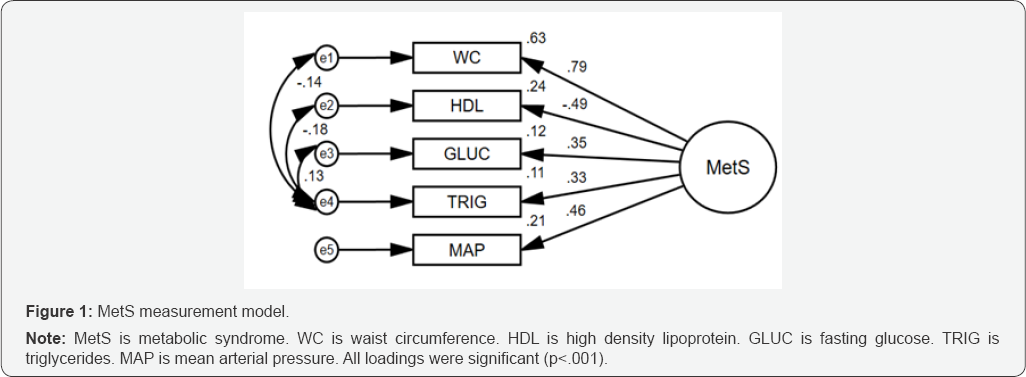
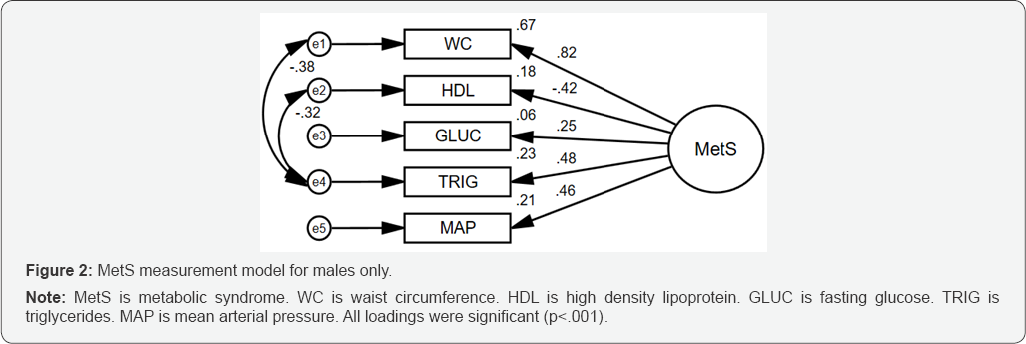
Table 4 contains results from the multi-group analysis by sex. When constraining the measurement weights, setting them equal in male and female models, the null hypothesis was found to be rejected (χ2 = 11.99, p=.017). That is, we rejected the constrained model as the correct model and concluded that the MetS measurement model is not invariant across sex groups. Therefore, separate sex-specific measurement models were fit (Table 3). Figure 2 displays the male-specific MetS measurement model, which fit well after removing and RMSEA = 0.00). Figure 4 displays the male-specific MetS structural model with latent MetS as the main independent variable, SR as the mediating variable, HRQOL as the dependent variable, and age as a control variable. The structural model fit well (χ2/df =2.581, GFI = 0.98, CFI = 0.95, and RMSEA=0.06) and all hypothesized structural effects (excluding age) were significant (ps<.05) (Table 5). The Bootstrap mediation test showed that SR significantly (b = 0.002, p =.020) mediated the MetS and HRQOL relationship. Furthermore, the direct effect of Mets on HRQOL (b = -0.046) remained significant (p<.001), therefore, SR only partially mediated the relationship.
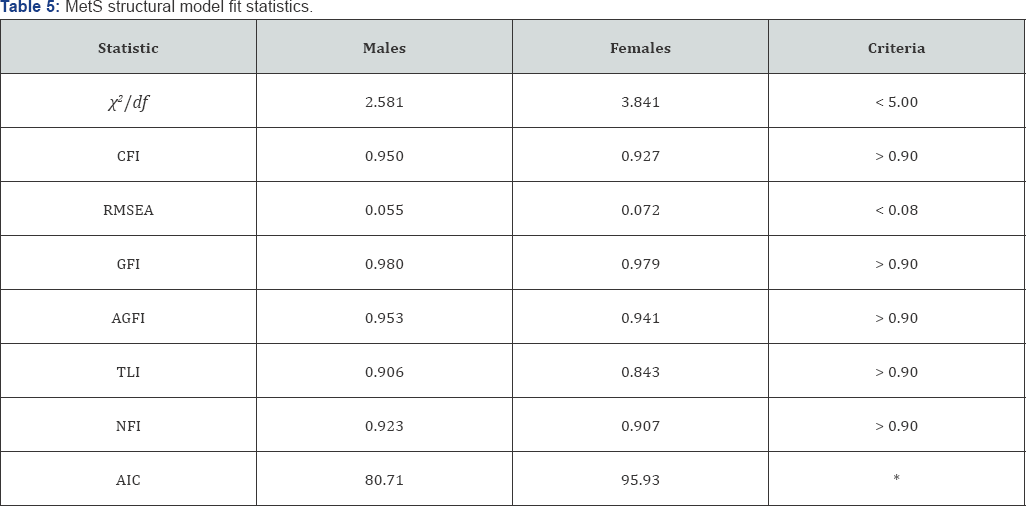
Note: χ2/df is chi-square divided by degrees of freedom. CFI is comparative fit index. RMSEA is root mean square error of approximation. GFI is goodness of fit index. AGFI is adjusted goodness of fit index. TLI is Tucker-Lewis index. NFI is normed fit index. AIC is Akaike's information criterion. *a relatively smaller AIC indicates a better fit.
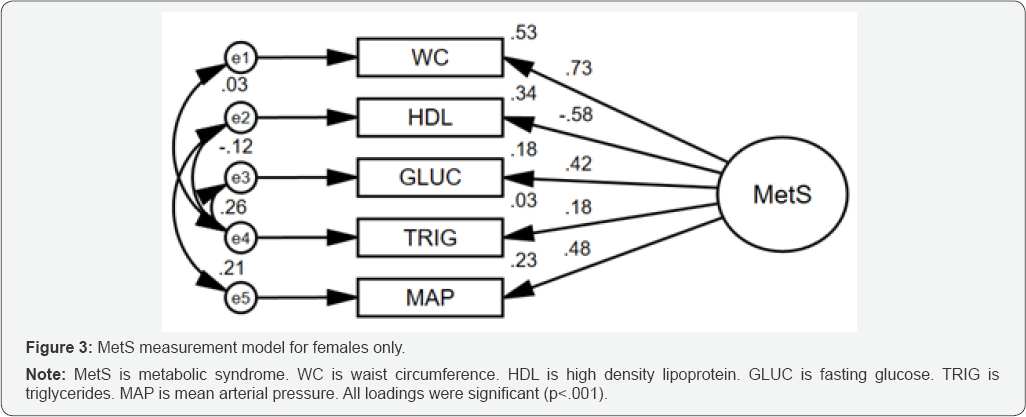

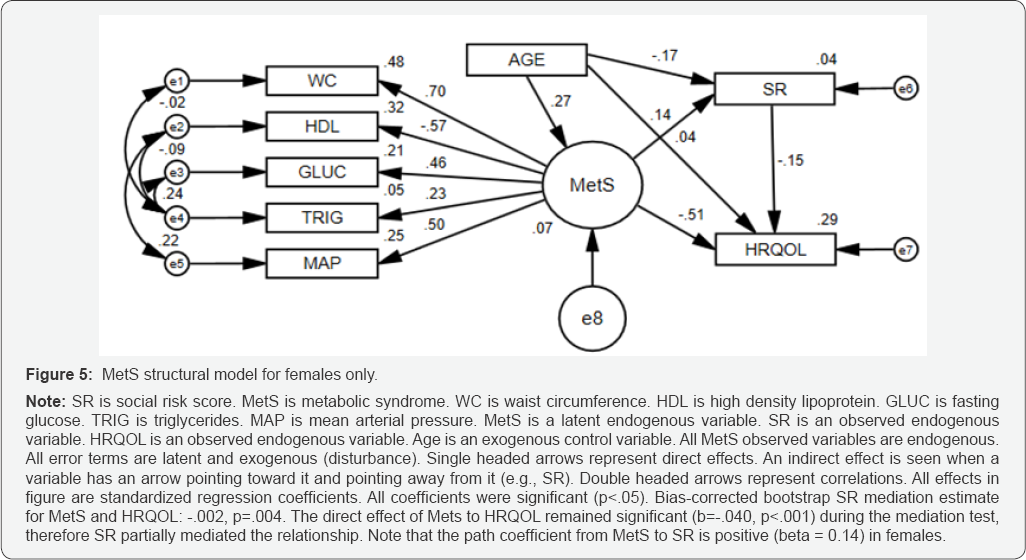
Since the indirect effect was positive, SR therefore improves the total effect of MetS on HRQOL in males. That is, given T represents the total effect, D represents the direct effect, and I represents the indirect effect (i.e., the product of MetS to SR and SR to HRQOL unstandardized effects), then: T = D + I [42]. And so, with D = -0. 046, and I = 0.002, then T decreases in magnitude to -0.044. Figure 5 displays the female-specific MetS structural model with the same specified paths. The structural model fit well (χ2/df= 3.84, GFI = 0.98, CFI = 0.93, and RMSEA=0.07) and all hypothesized structural effects (excluding age) were significant (ps<.05) (Table 5). The Bootstrap mediation test showed that SR significantly (b = -0.002, p =.004) mediated the MetS and HRQOL relationship. As well, the direct effect of Mets on HRQOL (b = -0.040) remained significant (p<.001), therefore, SR also partially mediated the relationship in females. Since the indirect effect was negative, SR therefore worsens the total effect of MetS on HRQOL in females. That is, with D = -0.040, and I = -0.002, then T increases in magnitude to -0.042.
Discussion
The purpose of this study was to use SEM to investigate the mediating effects of SR on the MetS and HRQOL relationship in a convenience sample of younger adults. The results showed firstly that SEM can be used to measure a latent construct of MetS, albeit separately in males and females. Results also showed that SR significantly and partially mediates the MetS and HRQOL relationship. Although these findings are not corroborated in the literature, the cumulative effect of social risk has been shown to affect other health outcomes. For example, a recent study showed that adults with two or more social risk factors participated in significantly less moderate-to-vigorous physical activity and had more than twice the risk of mortality, as compared to their counterparts with zero social risk factors [43]. Another study, a cross-sectional research of U.S. adults, showed that exposure to three or more social risk factors increased odds of having diabetes by almost three times, as compared to those with zero social risk factors [44]. A final study, using a representative sample of U.S. adults from years 1999 to 2006, showed that adults with low income, low education, who are non-white, and who are single were less likely to have ideal cardiovascular health (as measured by the Life's Simple 7 Metric), as compared to their counterparts [45].
Furthermore, this study reported an inverse relationship between the number of social risk factors and the odds of good cardiovascular health, emphasizing a cumulative social risk. The current study also showed differences in the mediating effects of SR between sex groups, with SR contributing to the negative MetS and HRQOL relationship in females yet improving the negative relationship in males. These results were primarily driven by the opposing relationships between MetS and SR in males and females. That is, males with greater SR were more likely to have lower MetS scores and females with greater SR were more likely to have higher MetS scores. To date, there is no published data supporting the relationship between high MetS trait in high SR females and high MetS trait in low SR males. More research on this topic is suggested to corroborate these findings. The major strength of this study was its use of SEM to first assess a measurement of MetS and then subsequently examine its relationship with HRQOL through SR. To date, no published studies have examined such relationships with latent models.
Despite this strength, there are study limitations worth mentioning. One limitation is the use of continuous measures of MetS risk factors, as opposed to the standard procedure of counting the number of risk factors based on specified cut-off score criteria [46]. Despite this lack of conventional methodology, the specific study population was made up of younger adults (20 to 49 years), typically at less risk of MetS, as compared to older adults. Therefore, using continuous-level risk factor measures allowed for the measurement of latent MetS for those adults who may have had risk below and even slightly below cutoff criteria. Additionally, using continuous variables allow for more psychometric information in terms of basic measurement theory [47]. Another limitation worth mentioning is the use of self-reported data for the outcome variable of HRQOL. Although the limitations associated with self-reported data usage are well established, the single HRQOL item used in this study is widely used and has acceptable psychometric properties [48-51]. Regardless, results from this study should be interpreted with caution.
Conclusion
Results from this study support the novel use of SEM to validate a latent construct of MetS. Furthermore, SR was found to mediate the MetS and HRQOL relationship in younger adults, with SR contributing to its total negative relationship in females and improving the relationship in males. Health promotion and medical professionals should be aware that social risk does contribute to the MetS and HRQOL relationship, albeit differently for males thanfor females.
References
- Alberti MM, Eckel RH, Grundy SM, Zimmet PZ, Cleeman JI, et al. (2009) Harmonizing the Metabolic Syndrome: A Joint Interim Statement of the Association for the Study of Obesity Heart Federation; International Atherosclerosis Society; and International National Heart, Lung, and Blood Institute; American Heart Association; World International Diabetes Federation Task Force on Epidemiology and Prevention. Circulation 120(16): 1640-1645.
- Expert Panel on Detection E (2001) Executive summary of the Third Report of the National Cholesterol Education Program (NCEP) expert panel on detection, evaluation, and treatment of high blood cholesterol in adults (Adult Treatment Panel III). Jama 285(19): 2486-2497.
- Hadaegh F, Mohebi R, Cheraghi L, Tohidi M, Moghaddam NB, et al. (2012) Do Different Metabolic Syndrome Definitions Predict Cerebrovascular Events and Coronary Heart Disease Independent of Their Components?. Stroke 43(6): 1669-1671.
- Wang J, Sarnola K, Ruotsalainen S, Moilanen L, Lepisto P, et al. (2010) The metabolic syndrome predicts incident congestive heart failure: a 20-year follow-up study of elderly Finns. Atherosclerosis 210(1): 237242.
- Noda H, Iso H, Saito I, Konishi M, Inoue M, et al. (2009) The impact of the metabolic syndrome and its components on the incidence of ischemic heart disease and stroke: The Japan public health center- based study. Hypertension Research 32(4): 289-298.
- Sarrafzadegan N, Gharipour M, Sadeghi M, Nezafati P, Talaie M, et al. (2017) Metabolic syndrome and the risk of ischemic stroke. Journal of Stroke and Cerebrovascular Diseases 26(2): 286-294.
- Wang GS, Tong DM, Chen XD, Yang TH, Zhou YT, et al. (2016) Metabolic Syndrome Is a Strong Risk Factor for Minor Ischemic Stroke and Subsequent Vascular Events. PloS one 11(8): e0156243.
- Chen YC, Sun CA, Yang T, Chu CH, Bai CH, et al. (2014) Impact of metabolic syndrome components on incident stroke subtypes: a Chinese cohort study. J Hum Hypertens 28(11): 689-693.
- Kurotani K, Miyamoto T, Kochi T, Eguchi M, Imai T, et al. (2017) Metabolic syndrome components and diabetes incidence according to the presence or absence of impaired fasting glucose: The Japan Epidemiology Collaboration on Occupational Health Study. J Epidemiol 27(9): 408-412.
- Cho NH, Ahn CH, Moon JH, Kwak SH, Choi SH, et al. (2016) Metabolic syndrome independently predicts future diabetes in women with a history of gestational diabetes mellitus. Medicine 95(35): e4582.
- Hui ZH, Chen YA, Chen DO, Zhirong GU, Xiaoshu HU, et al. (2014) Predictive Power for Type 2 Diabetes Mellitus using Dynamic Change of Metabolic Syndrome, Dynamic Change of Fasting Plasma Glucose, Metabolic Syndrome and Fasting Plasma Glucose. Iran J Public Health 43(4): 432-440.
- Tamariz L, Hassan B, Palacio A, Arcement L, Horswell R, et al. (2009) Metabolic syndrome increases mortality in heart failure. Clinl cardiol 32(6): 327-331.
- Khosravi A, Sadeghi M, Barghikar M (2017) Which Components of Metabolic Syndrome have a Greater Effect on Mortality, CVA and Myocardial Infarction, Hyperglycemia, High Blood Pressure or Both?. Adv Biomed Res 6: 121.
- Gathirua-Mwangi WG, Monahan PO, Murage MJ, Zhang J (2017) Metabolic syndrome and total cancer mortality in the Third National Health and Nutrition Examination Survey. Cancer Causes Control 28(2): 127-136.
- Mulvahill JS, Nicol GE, Dixon D, Lenze EJ, Karp JF, et al. (2017) Effect of Metabolic Syndrome on Late-Life Depression: Associations with Disease Severity and Treatment Resistance. J Am Geriatr Soc 65(12): 2651-2658.
- Shinkov A, Borissova AM, Kovatcheva R, Vlahov J, Dakovska L, et al. (2017) Increased prevalence of depression and anxiety among subjects with metabolic syndrome and known type 2 diabetes mellitus-a population-based study. Postgrad Med 5: 1-7.
- Akbari H, Sarrafzadegan N, Aria H, Garaei AG, Zakeri H (2017) Anxiety but not depression is associated with metabolic syndrome: The Isfahan Healthy Heart Program. J Res Medical sciences 22(7):90.
- Hart PD, Kang M, Weatherby NL, Lee YS, Brinthaupt TM (2015) Systematic Review of Health-Related Quality of Life Assessments in Physical Activity Research. World Journal of Preventive Medicine 3(2): 28-39.
- Hart PD, Kang M (2015) Reliability of the Short-Form Health Survey (SF-36) in Physical Activity Research Using Meta-Analysis. World Journal of Preventive Medicine 3(2): 17-23.
- Hart PD, Benavidez G, Erickson J (2017) Meeting recommended levels of physical activity in relation to preventive health behavior and health status among adults. J Prev Med Public Health 50(1): 10-17.
- Hart PD (2016) Sex differences in the physical inactivity and health- related quality of life relationship among rural adults. Health promotion perspect 6(4): 185-189.
- Hart PD (2016) Meeting recommended levels of physical activity and health-related quality of life in rural adults. J Lifestyle Med 6(1):1-6.
- Jia H, Moriarty DG, Kanarek N (2009) County-level social environment determinants of health-related quality of life among US adults: a multilevel analysis. Journal of Community Health 34(5): 430-439.
- Pinheiro LC, Wheeler SB, Chen RC, Mayer DK, Lyons JC, et al. (2015) The effects of cancer and racial disparities in health-related quality of life among older Americans: A case-control, population-based study. Cancer 121(8): 1312-1320.
- Zhang L, Ferguson TF, Simonsen N, Chen L, Tseng TS (2014) Racial/ ethnic disparities in health-related quality of life among participants with self-reported diabetes from NHANES 2001-2010. The Diabetes Educator 40(4): 496-506.
- Krishnadath IS, Toelsie JR, Hofman A, Jaddoe VW (2016) Ethnic disparities in the prevalence of metabolic syndrome and its risk factors in the Suriname Health Study: a cross-sectional population study. BMJ Open 6(12): e013183.
- Yang JJ, Yoon HS, Lee SA, Choi JY, Song M, et al. (2014) Metabolic syndrome and sex-specific socio-economic disparities in childhood and adulthood: the Korea National Health and Nutrition Examination Surveys. Diabetic Medicine 31(11): 1399-1409.
- Ramphal L, Zhang J, Suzuki S (2014) Ethnic disparities in the prevalence of the metabolic syndrome in American adults: data from the Examination of National Health and Nutrition Examination Survey 1999-2010. Proceedings (Baylor University. Medical Center) 27(2): 92-95.
- Erqou S, Echouffo-Tcheugui JB, Kip KE, Aiyer A, Reis SE (2017) Association of cumulative social risk with mortality and adverse cardiovascular disease outcomes. BMC Cardiovasc Disord 17(1): 110.
- Deihim T, Amiri P, Hatami H, Cheraghi L, Azizi F (2016) Association between metabolic syndrome and health-related quality of life among individuals with normal and impaired glucose regulation: Findings from Tehran Lipid and Glucose Study. Arch Iran Med 19(8):577-583.
- Amiri P, Deihim T, Taherian R, Karimi M, Gharibzadeh S, et al. (2015) Factors affecting gender differences in the association between health- related quality of life and metabolic syndrome components: Tehran Lipid and Glucose Study. PloS one 10(12): e0143167.
- Okosun IS, Annor F, Esuneh F, Okoegwale EE (2013) Metabolic syndrome and impaired health-related quality of life and in non- Hispanic White, non-Hispanic Blacks and Mexican-American Adults. Diabetes Metab Syndr 7(3): 154-160.
- (2017) National Center for Health Statistics. National Health and Nutrition Examination Survey.
- Caleyachetty R, Tehranifar P, Genkinger JM, Echouffo-Tcheugui JB, Muennig P (2015) Cumulative social risk exposure and risk of cancer mortality in adulthood. BMC Cancer 15(1): 945.
- Schumacker RE, Lomax RG (2016) A beginner's guide to structural equation modeling. Psychology Press.
- Hooper D, Coughlan J, Mullen M (2008) Structural equation modelling: Guidelines for determining model fit. Articles 6(1): 53-60.
- Bollen KA, Stine Rm (1990) Direct and indirect effects: Classical and bootstrap estimates of variability. Sociological methodology 20: 115140.
- Byrne Barbara M (2010) Structural Equation Modeling with Amos: Basic Concepts, Applications, and Programming. Routledge, New York, pp. 438.
- Lomax RG, Schumacker RE (2012) A beginner's guide to structural equation modeling. Routledge Academic, New York, USA.
- Rosseel Y (2014) The lavaan tutorial. Department of Data Analysis: Ghent University, Belgium, Europe.
- Cody RP, Smith JK (1985) Applied statistics and the SAS programming language. North Holland.
- Gunzler D, Chen T, Wu P, Zhang H (2013) Introduction to mediation analysis with structural equation modeling. Shanghai archives of psychiatry 25(6): 390.
- Loprinzi PD, Davis RE (2016) Socioecological Risk Predictors of Physical Activity and Associated Mortality. American Journal of Health Promotion 32(1): 106-111.
- Echouffo Tcheugui JB, Caleyachetty R, Muennig PA, Narayan KM, Golden SH (2016) Cumulative social risk and type 2 diabetes in US adults: The National Health and Nutrition Examination Survey (NHANES) 19992006. European Journal of preventive cardiology 23(12): 1282-1288.
- Caleyachetty R, Echouffo Tcheugui JB, Muennig P, Zhu W, Muntner P, et al. (2015) Association between cumulative social risk and ideal cardiovascular health in US adults: NHANES 1999-2006. International journal of cardiology 191: 296-300.oos
- Ford ES, Giles WH, Dietz WH (2002) Prevalence of the metabolic syndrome among US adults: findings from the third National Health and Nutrition Examination Survey. Jama 287(3): 356-359.
- Breakwell GM, Martin S, Hammond S, Fife-Schaw C, Smith JA (2006) Research methods in psychology. Sage Publications, London.
- Cunny KA, Perri III M (1991) Single-item vs multiple-item measures of health-related quality of life. Psychological reports 69(1): 127-130.
- Tsai J, Rolle IV, Singh T, Boulet SL, Mc Afee TA, et al. (2017) Patterns of marijuana and tobacco use associated with suboptimal self-rated health among US adult ever users of marijuana. Preventive Medicine Reports 6: 251-257.
- Garbarski D (2016) Research in and prospects for the measurement of health using self-rated health. Public opinion quarterly 80(4): 977997.
- Inkrot S, Lainscak M, Edelmann F, Loncar G, Stankovic I, et al. (2016) Poor self-rated health predicts mortality in patients with stable chronic heart failure. European Journal of Cardiovascular Nursing 15(7): 504512.


