Epidemiology of Exercise-Related Injuries Presenting to U.S. Emergency Departments: 10-year Trends
Peter D Hart1-3*
1Health Promotion Program, Montana State University - Northern, USA
2Kinesmetrics Lab, Montana State University - Northern, USA
3Health Demographics, USA
Submission: November 03, 2017; Published: December 06, 2017
*Corresponding author: Peter D Hart, Associate Professor, Health Promotion College of Education, Arts & Sciences and Nursing, Montana State University - Northern, USA, Tel: 406-265-3719; Fax: 406-265-4129; Email: peter.hart@msun.edu
How to cite this article: Hart P D. Epidemiology of Exercise-Related Injuries Presenting to U.S. Emergency Departments: 10-year Trends. J Phy Fit Treatment & Sports. 2017; 1(3): 555562 DOI: 10.19080/JPFMTS.2017.01.555552
Abstract
Background: Most studies of exercise-related injury have focused on either sport-related exposures or specific at-risk populations. The purpose of this study was to investigate injuries related to both non-equipment exercise (NEE) as well as strength training activity (STA) in U.S. adults.
Methods: Data for this research came from the 2006-2015 National Electronic Injury Surveillance System (NEISS) which collects data annually from a representative sample of U.S. emergency departments (EDs). Product codes were used to identify injuries related to NEE and injuries related to STA in adults 18+ years of age. Analyses focused on estimating the number of exercise-related injuries and changes in injury estimates across years. SAS survey procedures were used to compute descriptive statistics and estimate total weighted number of injuries. Linear regression was used for 10-year trend analyses.
Results: Trend analysis of NEE injuries showed a significant linear increase (R2= .939, RMSE= 14,874, p< .001). Trend analysis of STA as well showed a significant linear trend (R2= .933, RMSE= 3,413, p< .001).
Conclusion: Results from this study show that exercise-related injuries increased linearly from 2006 to 2015. Furthermore, injury trends were similar for NEE and STA.
Keywords: Exercise; Strength training; Injury; Epidemiology; Trends; NEISS
Abbreviations: NEE: Non - Equipment Exercise; STA: Strength Training Activity; NEISS: National Electronic Injury Surveillance System; EDs: Emergency Departments; BRFSS: Behavioral Risk Factor Surveillance System
Introduction
Unintentional injury remains a leading cause of death and disability in the U.S. [1]. One particular pastime related to unintentional injury is the participation of exercise-related activities [2]. Exercise can be defined as any planned and structured form of physical activity where specific fitness- related outcomes are expected [3]. Recent data from the 2016 Behavioral Risk Factor Surveillance System (BRFSS) shows that approximately three-quarters of U.S. adults participate in some form of physical activity [4]. With the above definition in mind, then, muscular strength training can be considered an exercise-related activity. In 2015, the BRFSS data showed that approximately 30% of U.S. adults participate in muscle strengthening activity two or more times per week. With such large numbers of U.S. adults engaging in exercise-related activity, the potential for increased injury risk becomes a public health concern.
Many studies have reported estimates and trends associated with exercise-related injuries. One study recently researched the injuries associated with home exercise equipment that resulted in emergency department treatment and found that treadmills were involved in a majority of the cases [5]. Running- related injuries in school-aged children and adolescents were examined in another study, where an increasing trend was found over the years of 1994-2007 [6]. A final study researched the sex differences in resistance training injuries in a younger aged population and found that males experienced more sprains and strains than females [7]. Most studies that have reported incidence and trend estimates on exercise-related injuries, however, have focused on either specific exposures, specific injuries or specific at-risk populations [8]. Therefore, the purpose of this study was to investigate injuries related to both non-equipment exercise (NEE) as well as strength training activity (STA) in U.S. adults.
Methods
Participants and Design
Data for this research came from the 2006-2015 National Electronic Injury Surveillance System (NEISS) which collects data annually from a representative sample of U.S. emergency departments (EDs) [9]. This study was limited to adults 18 years of age and older who presented to one of the sampled U.S. EDs. Ten different datasets, corresponding to years 2006 thru 2015,were downloaded from the NEISS. Each dataset included the same set of variables, such as date of treatment, case number, date of birth, age of patient, sex of patient, diagnosis, body part affected, case disposition, product code(s), injury intention, location of incident, fire-related, work-related, race of patient, and comments. As well, each case in each dataset has sampling weight and associated complex sampling variables. After each dataset was downloaded, they were concatenated to build one single dataset.
Measures

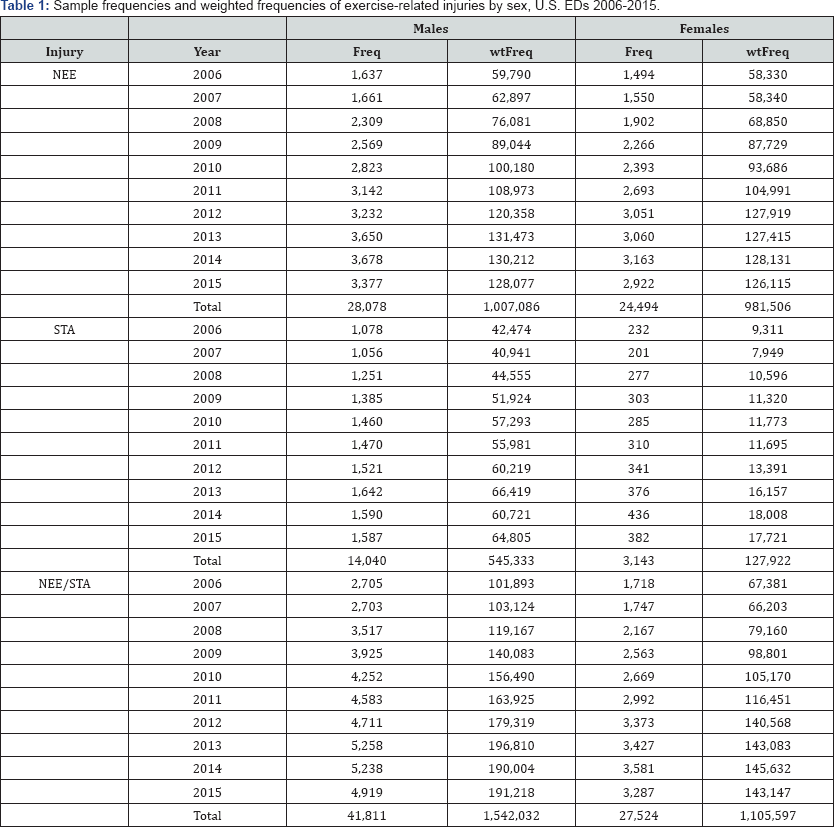
Note. Freq is sample frequency and wtFreq is the weighted frequency. NEE is non-equipment exercise. STA is strength training activity. NEE/ STA frequencies may not sum to NEE + STA because of some overlap in reporting.


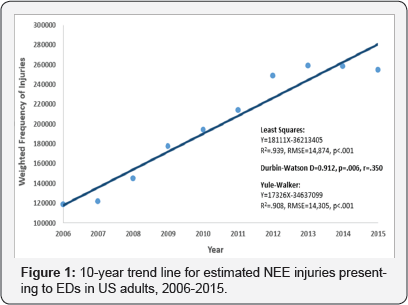
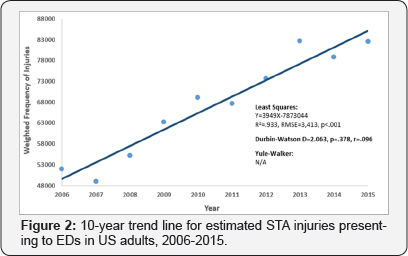
Product codes were used to identify injuries related to NEE and injuries related to STA [10]. Three different analyses were run using different exercise-related injury outcomes. First, a NEE analysis was performed where patients were considered treated for a NEE injury if they had product code 3299. Second, an STA analysis was performed where patients were considered treated for an STA injury if they had product code 3265. Finally, a NEE/STA analysis was performed if a patient had either code mentioned above. For each analysis, the two main variables were weighted frequency of injury (NEE, STA, NEE/STA) and year (2006 to 2015) (Table 1) (Figures 1-3).
Statistical Analysis
Analyses focused on estimating the number of exercise- related injuries and changes in injury estimates across the years 2006-2015. SAS survey procedures were used to compute descriptive statistics and estimate total weighted number of injuries [11]. Linear regression was used for 10-year trend analyses [12]. Inspection of residuals and computation of the Durbin-Watson statistic were both performed to detect autocorrelation in the data. If autocorrelation was detected, the SAS PROC AUTOREG was used to correct for it [13].
Results
Average annual number of actual (and weighted) ED visits across the 10-year period was 5,257 (198,870) for NEE and 1,719 (67,334) for STA. Weighted number of NEE injuries more than doubled in the 10-year period from 118,135 in 2006 to 254,192 in 2015. Trend analysis of NEE injuries showed a significant linear increase (R2= .939, RMSE= 14,874, p<.001). Weighted number of STA injuries also increased from 51,857 in 2006 to 82,526 in 2015. Trend analysis of STA injuries as well showed a significant linear trend (R2= .933, RMSE= 3,413, p< .001). When analyzing injury estimates per 100,000 U.S. mid-year population, trends remained for both NEE (R2= .918, RMSE= 6.50, p< .001) and STA (R2= .898, RMSE= 1.48, p< .001).
Discussion
The purpose of this study was to investigate injuries related to both NEE as well as STA in U.S. adults. Specifically, this study examined the trends across a 10-year period beginning 2006 and ending 2015. Findings here showed that NEE injuries dramatically increased across this time period. One possible explanation for this is an associated increase in NEE participation by U.S. adults. In any epidemiological analysis, assuming a fixed incidence, the larger the exposed population, the greater the number of infected [14]. However, data supporting this associated trend are lacking. BRFSS data show a very similar prevalence in physical activity participation across these years [4].
However, some data do support the prevalence of meeting recommended amounts of physical activity is increasing in U.S. adults [15,16]. Results of this study also showed a large proportional increase in STA injuries across the study period. This too may be explained simply by an increased number of exposed individuals. Some data do support the increasing prevalence in muscle strengthening activity. One such report noted increases in muscle strengthening activity among U.S. adults 65+ years of age, from the years 2000-2002 to the years 2013-2015 [17]. Even with these few supporting studies, more research is needed to better understand this growing trend in exercise-related injuries in U.S. adults.
Despite this study's strength in reporting trends across an extended (10-year) time period using data representative of all ED centers in the U.S., there are some limitations worth mentioning in this study. The main limitation is the fact that these data come from a sample of hospital EDs. This aspect of the study may bias the estimates because some exercise-related injuries may have presented to clinics or healthcare settings other than EDs. Therefore, caution should be applied when considering these results.
Conclusion
Results from this study show that exercise-related injuries increased linearly from 2006 to 2015. Furthermore, injury trends were similar for NEE, STA, and combined. These findings indicate that health promotion efforts should include injury prevention strategies in combination with physical activity promotion.
References
- Centers for Disease Control and Prevention, National Center for Injury Prevention and Control. WISQARS Fatal Injury and Nonfatal Injury.
- (2020) US Department of Health and Human Services, Office of Disease Prevention and Health Promotion, US Department of Health and Human Services, Office of Disease Prevention and Health Promotion. Healthy people.
- (2013) American College of Sports Medicine, editor. ACSM's health- related physical fitness assessment manual. Lippincott Williams & Wilkins, USA.
- (2017) Centers for Disease Control and Prevention, National Center for Chronic Disease Prevention and Health Promotion, Division of Population Health. BRFSS Prevalence & Trends Data.
- Graves JM, Iyer KR, Willis MM, Ebel BE, Rivara FP, et al. (2014) Emergency department-reported injuries associated with mechanical home exercise equipment in the USA. Injury prevention 20(4): 281285.
- Mehl AJ, Nelson NG, McKenzie LB (2011) Running-related injuries in school-age children and adolescents treated in emergency departments from 1994 through 2007. Clinical pediatrics 50(2): 126-132.
- Quatman CE, Myer GD, Khoury J, Wall EJ, Hewett TE (2009) Sex differences in "weightlifting” injuries presenting to United States emergency rooms. Journal of strength and conditioning research/ National Strength & Conditioning Association 23(7): 2061-2067.
- Jones CS, Turner LW (2005) Non-equipment exercise-related injuries among US women 65 and older: emergency department visits from 1994-2001. Journal of women & aging 17(1-2): 71-81.
- Ches Jones, Bart Hammig (2001) US Consumer Product Safety Commission. NEISS Sample Design 1997-Present. US Consumer Product Safety Commission 4(9).
- (2017) US Consumer Product Safety Commission. NEISS coding manual. US Consumer Product Safety Commission.
- Gossett J, Jo CH, Simpson P (2006) US health and nutrition: SAS survey procedures and NHANES. SAS Users Group International 31: 140-231.
- Cody RP, Smith JK (2008) Applied statistics and the SAS programming language. North-Holland.
- Yaffee RA, McGee M (2000) An introduction to time series analysis and forecasting: with applications of SAS and SPSS. Academic Press.
- Last JM, Abramson JH, Freidman GD (2001) A dictionary of epidemiology. New York: Oxford university press.
- Gu JK, Charles LE, Ma CC, Andrew ME, Fekedulegn D, et al. (2016) Prevalence and trends of leisure-time physical activity by occupation and industry in US workers: The National Health Interview Survey 2004-2014. Annals of epidemiology 26(10): 685-692.
- Keadle SK, McKinnon R, Graubard BI, Troiano RP (2016) Prevalence and trends in physical activity among older adults in the United States: A comparison across three national surveys. Preventive medicine 89: 37-43.
- QuickStats: Percentage of Adults Aged > 65 Years Meeting 2008 Federal Guidelines for Leisure-Time Aerobic and Muscle-Strengthening Activities, by Age and Type of Activity-United States, 2000-2002 and 2013-2015. MMWR Morb Mortal Wkly Rep 65(37): 1019.


