Test-Retest Stability of Four Common Body Composition Assessments in College Students
Peter D Hart1-3*
1Health Promotion Program, Montana State University - Northern, Havre, MT USA
2Kinesmetrics Lab, Montana State University - Northern, Havre, MT USA
3Health Demographics, Havre, MT USA
Submission: November 03, 2017; Published: November 22, 2017
*Corresponding author: Peter D Hart, Associate Professor, Health Promotion College of Education, Arts & Sciences and Nursing , Montana State University-Northern, Havre, MT USA, P.O. Box 7751, Fax: 406 265 4129; Tel: 406 265 3719; Email: peter.hart@msun.edu
How to cite this article: Hart PD. Test-Retest Stability of Four Common Body Composition Assessments in College Students. J Phy Fit Treatment & Sports. 2017; 1(2): 555561 DOI: 10.19080/JPFMTS.2017.01.555561
Abstract
Background: Field-based techniques are the most practical form of body composition (BC) assessment in generally healthy populations.
Purpose: The purpose of this study was to examine the test-retest stability of four common BC assessments in college students.
Methods: Data for this research came from a larger BC measurement study. A total of 38 participants who signed IRB approved consent form and had BC measurements taken from each of four methods at two different time points were included in this analysis. The four BC assessments were
a) percent body fat (PBF) by skinfold technique (SF)
b) waist circumference (WC)
c) body mass index (BMI), and
d) PBF by handheld bioelectrical impedance (HH)
Pearson correlation coefficients, Cronbach alphas, Cohen's kappas, and Bland and Altman limits of agreement (LOA) plots were used to evaluate stability.
Results: Mean differences (SD) for SF (%), WC (cm), BMI (kg/m2), and HH (%) were -0.07 (1.52), 0.39 (3.17), -0.03 (0.53), and -0.21 (2.19), respectively. Test-retest correlations were all greater than .95 (ps<.001) with non-significant t-tests (ps >.05). Cronbach's alphas were all greater than .97. Weighted kappas were strong for SF, BMI, and HH (K's >.92) and moderately strong for WC (K=.71). All LOA plots showed at least 95% of differences within range. WC LOA were clinically large (± 6.2 cm). However, after the removal of two WC outliers, WC LOA became reasonable (± 3.8 cm).
Conclusion: Results of this study provide evidence for acceptable test-retest stability of common field-based BC assessments in college students.
Keywords: Body composition; Reliability; Health-related fitness; Percent body fat 3
Abbreviations: SF: Skinfold Technique; PBF: Percent Body Fat; WC: Waist Circumference ; BMI: Body Mass Index; LOA: Altman limits of agree-ment; HH: Handheld; IRB: Internal Review Board
Introduction
The five components of health-related physical fitness are cardio respiratory fitness, muscular strength, muscular endurance, flexibility, and body composition [1]. Although not a performance measure, BC does have strong associations with chronic diseases such as heart disease [2], cancer [3,4], diabetes [5], and stroke [6] as well as injury [7] and all-cause mortality [8]. BC has also been receiving more recent attention across the health sciences because of the increased prevalence of obesity [9,10]. By definition, BC refers to a set of measures that indicate the distribution of fat, lean mass, and minerals in the body [11]. There are many criterion methods available to assess BC (e.g., hydrostatic weighing), but are generally restricted to lab settings [12].
Field-based techniques are the most practical form of BC assessment in generally healthy populations [13]. Among college student populations, field-based BC methods are likely the only option when one is interested in simple pre-program assessment or formative and summative fitness evaluation. Despite a plethora of evidence supporting the accuracy of field- based BC assessments, a necessary prerequisite for validity is their ability to measure scores consistently across different time points [14]. Therefore, the purpose of this study was to examine the test-retest stability of four common BC assessments in college students.
Methods
Participants and design
A total of 38 participants who signed an IRB approved consent form and had BC measurements taken from each of four methods at two different time points were included in this analysis. A repeated measures design was used with participants assessed on two separate 4 Occasions (in the same week) on four different BC field methods. All methods and procedures for this study were reviewed by the institution's internal review board (IRB).
Body composition measures
Four different BC measures were used in this study. Percent body fat (PBF) by skinfold technique (SF) was measured (%) using the Siri equation, where body density was first measured using the sum of chest, abdomen, and thigh skin folds (for males) or triceps, suprailiac, and thigh skinfolds (for females) [15]. Waist circumference (WC) (cm) was measured similarly for males and females and required an elastic tape placed at the narrowest point between the xyphoid process and umbilicus [15]. Body mass index (BMI) (kg/m2) was measured similarly for males and females and required measuring height (cm) using a wall mounted stadiometer and weight (kg) using an electronic floor scale. Finally, PBF (%) by handheld bioelectrical impedance (HH) was measured using the Omron BF306 handheld device, as described by the manufacturer [16].
Statistical Analysis
Three statistical approaches were used to evaluate stability. First, Pearson's correlation coefficients, paired t-tests, and Cronbach alphas were used to show how consistent each assessment was across trials [17]. Second, Cohen’s kappas were used after transforming each variable into quartiles to assess the amount of categorical agreement across trials [18,19]. Third, Bland and Altman plots and limits of agreement (LOA) were constructed to evaluate the spread and pattern of mean differences across trials [20]. All analyses were conducted using SAS version 9.4 [21].
Results
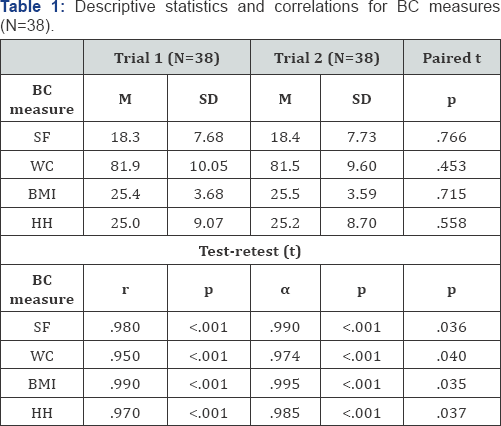
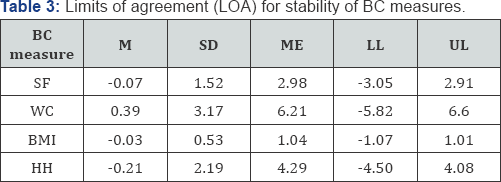
Table 1 contains descriptive statistics and Pearson correlation coefficients for the test-retest study. Mean differences (SD) for SF (%), WC (cm), BMI (kg/m2), and HH (%) were -0.07 (1.52), 0.39 (3.17), -0.03 (0.53), and -0.21 (2.19), respectively. Test-retest correlations were all very strong (rs >.95, ps<.001) with non-significant t-tests (ps>.05). Cronbach's alphas were also very strong (as>.97) and significantly greater than .70 (reliability cutoff) (ps<.05). Table 2 contains the categorical agreement statistics for stability. Weighted kappas were strong for SF, BMI, and HH (K's >.92) and moderately strong for WC (K=.71). Figure 1 contains the LOA plots for test-retest data on each BC assessment. LOA plots are constructed so the vertical axes represent the difference (i.e., trial 1 - trial 2) between the two BC assessment trials.


Note: M is mean. SD is standard deviation. r is Pearson correlation coefficient. a is Cronbach alpha coefficient. Paired t is paired t statistic. t is test statistic for difference between Cronbach alpha coefficient and 0.70

Note: Fleiss simple and weighted kappas are .807 and .863, respectively. x2 is chi-square test statistic. x2M is McNemar chi- square statistic. P is proportion of agreement statistic. r is the Pearson correlation coefficient for quartile categories. K is simple kappa. KW is weighted kappa. a indicates significant at .05 level. b indicates not significant at .05 level.

Note: M is mean. SD is standard deviation. ME is 95% margin of error. LL: Lower Limit. UL: Upper Limit.
Thus, a value located at the zero horizontal line would indicate that the participant received the same BC score on both trials. Alternatively, the farther values are (vertically) from the horizontal line, the more difference there was between the two BC trial scores. For example, a value located at the +2.0 vertical position in the SF LOA plot, would indicate that the individual received a SF value 2.0 percentage point higher on the first trial as compared to the second trial. Overall, none of the four LOA plots showed systematic bias toward a method (i.e., scatter equally distributed above and below the horizontal zero line).Additionally, all LOA plots showed at least 95% of differences within range. WC LOA were clinically large (±6.2 cm) (Table 3). However, after the removal of two WC outliers, WC LOA became reasonable (±3.8 cm) (not shown).

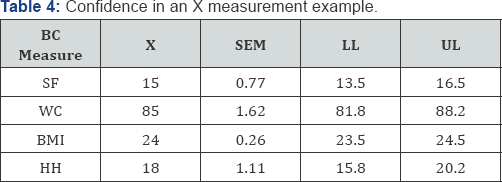
Note: X is an example of a single measurement of BC. SEM is standard error of measurement. LL and UL are lower and upper limits of 95% confidence interval.
Finally, Table 4 contains the standard error of measurement (SEM) values for the four BC assessments. A SEM is similar to other standard errors but is specifically regarding the variability we might expect in an individual's score [22]. Given this, a SEM can be used as a 6 measure of reliability of a single measurement, where the smaller the SEM the greater our confidence in the score. For example, note that the SEM for BMI is 0.26 (kg/m2). This value can be used to form a 95% confidence interval (CI), similar to a prediction interval in regression analysis. Thus, a college student with a BMI measured at 24.0 could be 95% confident that their true BMI is contained in the interval bound by 23.5-24.5 (kg/m2). The X values and CIs are only examples in this table, whereas the SEMs are constants found from the study.
Discussion
The aim of this study was to examine the test-retest stability of four common BC assessments in college students. The results of this study clearly support adequate test-retest stability of these field-based BC assessments in college students. These findings have considerable implications. For example, measurement theory assumes that scores from an assessment are reliable only under particular situations [22]. That is, assessments found reliable in general populations are not necessarily reliable in college students. Many factors common on college campuses can in fact affect an assessment’s stability, such as fatigue, practice, subject variability, testing circumstances, and precision of measurement. This study shows that such factors do not impede the stability of common field-based BC assessments in college students. The limitations in a study's design should always be consulted before generalizing its findings.
One such limitation was the specific population in which the sample was drawn. As previously stated, since BC scores are situation specific, results from this study should be considered only for college students attending a rural public university. Therefore, the strong reliability evidence found in this study should not be generalized to other populations. A second limitation was the relatively small sample size. A larger sample might have provided more 7 variability in BC measures and in turn allowed for the inspection of possible patterns and bias in the LOA plots. Nevertheless, it should also be noted that larger samples for a repeated measures design with four different BC tests can take up a lot of time and effort both on the researcher and the participant.
Conclusion
Results of this study provide evidence for acceptable test- retest stability of common field-based BC assessments in college students. Practitioners and researchers who assess BC in college students using field-based techniques should be aware that the measurement error attributed by different time points is negligible in this population.
References
- American College of Sports Medicine (2013) ACSM's health-related physical fitness assessment manual. Lippincott Williams & Wilkins, USA.
- Moholdt T, Lavie CJ, Nauman J (2017) Interaction of Physical Activity and Body Mass Index on Mortality in Coronary Heart Disease: Data from the Nord-Trøndelag Health Study. The American Journal of Medicine 130(8): 949-957.
- Fesinmeyer MD, Gulati R, Zeliadt S, Weiss N, Kristal AR, et al. (2009) Effect of population trends in body mass index on prostate cancer incidence and mortality in the United States. Cancer Epidemiology and Prevention Biomarkers 18(3): 808-815.
- Hong JS, Yi SW, Yi JJ, Hong S, Ohrr H (2016) Body mass index and cancer mortality among Korean older middle-aged men: a prospective cohort study. Medicine 95(21): e3684.
- Chang HW, Li YH, Hsieh CH, Liu PY, Lin GM (2016) Association of body mass index with all-cause mortality in patients with diabetes: a systemic review and meta-analysis. Cardiovascular diagnosis and therapy 6(2): 109-119.
- Wang HJ, Si QJ, Shan ZL, Guo YT, Lin K, et al. (2015) Effects of body mass index on risks for ischemic stroke, thromboembolism and mortality in Chinese atrial fibrillation patients: a single-center experience. Plos one 10(4): e0123516.
- Nye NS, Kafer DS, Olsen CH, Carnahan DH, Crawford PF (2017) Abdominal Circumference Versus Body Mass Index as Predictors of Lower ExtremityOveruse Injury Risk. Journal of Physical Activity and Health 1-26.
- Jackson CL, Yeh HC, Szklo M, Hu FB, Wang NY, et al. (2014) Body-mass index and all-cause mortality in US adults with and without diabetes. Journal of general internal medicine 29(1): 25-33.
- Seidell JC, Halberstadt J (2015) The global burden of obesity and the challenges of prevention. Annals of Nutrition and Metabolism 66(Suppl 2): 7-12.
- Freedman DS (2011) Centers for Disease Control and Prevention (CDC). Obesity-United States, 1988-2008. MMWR Surveill Summ 60(Suppl): 73-77.
- RavenP, Wasserman D, Squires W, Murray T (2012) Nelson Education.
- Kraemer WJ, Fleck SJ, Deschenes MR (2011) Exercise physiology: integrating theory and application. Lippincott Williams & Wilkins, USA.
- McArdle WD, Katch FI, Katch VL (2010) Exercise physiology: nutrition, energy, and human performance. Lippincott Williams & Wilkins, USA.
- Strube MJ, Grimm LG, Yarnold PR (2000) Reliability and generalizability theory. In Reading and understanding multivariate statistics. American psychological association.
- American College of Sports Medicine (2013) ACSM's guidelines for exercise testing and prescription. Lippincott Williams & Wilkins, USA.
- Omron Fat Loss Monitor (2012) Model HBF-306. Omron Healthcare Co. Ltd.
- Cronbach LJ (1951) Coefficient alpha and the internal structure of tests. Psychometrical 16(3): 297-334.
- Fleiss JL, Levin B, Paik MC (2013) Statistical methods for rates and proportions. John Wiley & Sons.
- Cohen J (1968) Weighted kappa: Nominal scale agreement provision for scaled disagreement or partial credit. Psychological bulletin 70(4): 213-220.
- Bland JM, Altman D (1986) Statistical methods for assessing agreement between two methods of clinical measurement. The lancet 1(8476): 307-310.
- Cody RP, Smith JK (2006) Applied statistics and the SAS programming language, 5th edn. Pearson.
- Morrow J, Mood D, Disch J, Kang M (2015) Measurement and Evaluation in Human Performance, 5th edn. Human Kinetics.


