




 JOJPH Home



Introduction
By definition, Statistics is the science of data. Data is a set of values collected or obtained when gathering information on some issues of interest. There are two major branches of statistics, each with specific goals and specific objectives: descriptive and inferential. Each of these branches of statistics is important, using different techniques for the accomplishment of the following objectives.
1.To help researchers design experiments and surveys, collect and analyse data
2.To describe data by summarizing main features in datasets
3.To make inferences and generalization on population based on sample data
4.To guide draw conclusion from data as a decision in decision-making processes
5.To predict future outcomes based on historical outcome data
6.To compare groups and evaluate the possible interaction among variables of interest to identify possible data patterns
7.To provide a basis for policy formulation and evaluation
8.To assess and manage public health risks and potential threats
9.To drive further research through new hypotheses
Research, being a process of steps used to collect and analyze information to increase our understanding of a topic or issue, consists of three steps: pose a question, collect data to answer the question, and present an answer to the question [1]. Generally, to establish or confirm facts, support theorems, or develop new theories and increase the stock of knowledge through the identifying of the risk factors associated with a problem circumstance, prevention and control outbreak of disease, remedial actions to improve negative conditions, intervention programmes, and formulation of relevant policies. Statistics, health care and research institutes rely on the availability of information based on data [2, 3].
A unique situation which recently acknowledged and highlighted this finding was a report on how the joint commitments of the federal, provincial and territorial governments on a shared health priority areas such as primary health care, health workforce and surgeries, mental health and substance use, electronic health information and aging with dignity optimized the input from the public, health system experts, health care providers and decision makers to respond to pressing concerns, by choosing indices of measurement with necessary feedback, on the progress of identified areas of priority, regarding the pressing concerns of Canadians [4].
So also, academic studies use different sets of data and methodologies for generating indices that best present the situation, progress and areas of need [2, 4]. The ability to understand the process is key to inequalities, linking relevant factors with inequities, understanding the underlying cause, and gaining more insights into the mechanisms that link conditions to relevant circumstances [4, 5].
Methods
Definitions and Examples
Descriptive Statistics refers to the type of data analysis which helps describe, show or summarize data in a meaningful way. In other words, descriptive statistics uses numbers to describe a known data set.
Examples of Descriptive Statistics
Frequency distributions; table that displays the frequency of various outcomes in a sample, measures of central tendency which locates the centre of a data set (mean, median, and mode), measures of the spread of a data set (range or standard deviation), overall description of data (five number summary), other measurements such as skewness and kurtosis and presentation of statistical results in graphical form; graphs like pie charts and bar charts that describe data are all examples of descriptive statistics
For instance, the average test score of a statistics class would be a descriptive statistic because we are using all of the students in the class to determine a known average. Suppose a Medical staff member who earns $10,000 monthly pays insurance, house rent, water and electricity bills. If the individual paid $1,000 to an insurance company, then one description of the data on expenditure would be that 10% of the monthly income was spent on insurance. Also, if we assume that a large hospital specializes in anesthesiology, dentistry, surgery and cardiology. If there are 1000 medical doctors and 400 out of 1000 are specialized in anesthesiology, then 40% of the hospital specialists who are anesthetists would be one descriptive statistic.
Inferential Statistics is concerned with making inferences or predictions about a population from analyses of sample data. i.e. determination of what might be happening in a population based on a sample of the population, where the information about the population is not stated as a number or determination of what might happen in the future.
Examples of Inferential Statistics
Linear regression analyses (assesses if change in one variable predicts change in another variable), analysis of variance (ANOVA) (tests whether a hypothesis about the mean is true or not), structural equation modelling (a technique which uses the combination of factor analysis and multivariate statistical framework to analyze structural relationships and complex relationships between directly (measured) and indirectly (latent) observed variables, to name a few are all examples of inferential statistics.
For example, one could predict the average test score of a whole school by calculating the average test score of a sample of students, and then utilize the prediction to make some test statistics and check if a certain value for the mean of the population is likely or not. Inferential Statistics is when you use the characteristics of a sample to make guesses (predictions) on the same characteristics of the whole population.
Results
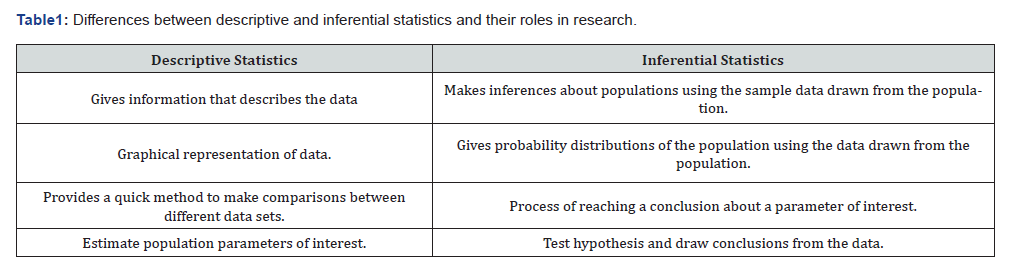
The broad overview of the statistical data analysis gives the following information, compiled in a table, indicating the general differences between the descriptive and inferential statistics as well as the roles of each in research.
Statistics
(Table 1)
Hence, the differences between descriptive and inferential statistics could be based on the intention of the researcher using the statistic, or based on how it is typically used.
Discussion
The use of statistical data analysis involves the extraction of information from its raw form to a meaningful state. Such information could be drawn through segmentation and classification of data, for description of the subject of interest or prediction modelling, to identify individuals who would benefit from health care or lifestyle changes, and those individuals at risk of developing a specific disease who would benefit from preventive care.
Statistical data analysis, which seeks to transform data from its raw state to present information that best expresses the condition, to gain a good understanding of the association between variables of interest, differences and progress over time, has become complex and generated several complications in the field. Many individuals encountered difficulties, while some were unable to figure out the appropriate approach which can be used in describing problems or making inferences with clarity to explain the cause and effect of the underlying variables.
Appropriate statistical analysis results will provide accurate information for the target audience for a suitable and effective intervention strategy. The effect of these results cannot be overemphasized, especially in the field of health and research; [6, 7] statisticians, health practitioners and research institutions can investigate and conclude, clearly identify patients who are at the greatest risk of negative outcomes for prompt intervention, effective comparison among alternatives and treatment plans to accordingly promote effectiveness and improved outcomes [8].
Conclusion
Statistical data analysis depends on the objective that you wish to achieve; descriptive or inferential. Knowing the difference between descriptive and inferential statistics helps choose the appropriate statistical method and its application to a real-world situation. Choosing an appropriate statistical analysis provides accurate results and the achievement of research objectives in real-world situations, which is paramount to productive resource utilization, eradicating epidemic conditions, promoting the wellbeing of people and prolonging human lives [6].
Each of the descriptive and inferential statistics is important and gives different insights into the nature of the data gathered, using different analytic techniques, and to achieve specific objectives. In a case where either descriptive or inferential alone cannot give the whole picture of the situation of interest, together they provide a powerful tool for both description and prediction.
References
- Creswell JW, Guetterman TC (2024) Educational research: Planning, conducting, and evaluating quantitative and qualitative research (7th ed).
- Rana K, Poudel P, Chimoriya R (2023) Qualitative methodology in translational health research: current practices and future directions. Healthcare (Basel) 11(19): 1-16.
- Khan US, Jain PR (2025) Research Designs and Methodologies. In: Jain PR, Khan US (eds) Introduction to Public Health and Research. Springer Singapore Pp: 17-57.
- Canadian Institute for Health Information. Using health data to help build better health care systems for Canadians.
- Oluwakemi R A (2017) A Two-Phase Longitudinal Study on Nutrition and School Performance among Grades 1-3 Children in Kwazulu-Natal, South Africa. Biostat Biometrics Open Acc J 1(3).
- Cutler DM, Lleras-Muney A (2010) Understanding differences in health behaviors by education. J. Health Econ 29(1): 1-28.
- Abutabenjeh S, Jaradat R (2018) Clarification of research design, research methods, and research methodology: a guide for public administration researchers and practitioners. Teach Public Adm 36(3): 237-258.
- Petra Kokko (2022) Improving the value of healthcare systems using the Triple Aim framework: A systematic literature review. Health Policy 126(4): 302-309.

























