Latent Class Analysis of Physical Activity and Mortality in U.S. Adults
Peter D Hart1'3
1Health Promotion Program, Montana State University Northern, USA
2Kinesmetrics Lab, Montana State University Northern, USA
3Health Demographics, USA
Submission: December 18, 2017; Published: December 22, 2017
*Corresponding author: Peter D Hart, Associate Professor, Health Promotion College of Education, Arts & Sciences and Nursing Montana State University Northern P.O. Box 7751 Havre, MT 59501, Tel: 7751 406 265 3719; Fax: 406 265 4129; Email: peter.hart@msun.edu
How to cite this article: Peter D H. Latent Class Analysis of Physical Activity and Mortality in U.S. Adults. JOJ Pub Health. 2017; 3(1): 555602. DOI: DOI: 10.19080/JOJPH.2017.03.555602
Abstract
Background: Latent class analysis (LCA) is a statistical technique used to identify unobservable group membership using a set of observed variables. Many large national surveys contain questions regarding physical activity (PA) and can be used to form latent classes. The purpose of this study was to use LCA with PA indicators to predict all-cause mortality in U.S. adults.
Methods: Data for this research came from the 2001-02 National Health and Nutrition Examination Survey (NHANES) and linked mortality file. Only participants who were 18+ years of age and eligible for mortality linkage were used in the analysis. Four PA variables were used: home/ yard (HPA), moderate recreational (MPA), vigorous recreational (VPA), and muscle strengthening (MSPA). Each PA variable was dichotomized to represent participation (yes/no). Cox proportional hazards regression was used to model the effects of latent PA on mortality while controlling for age, sex, race, and income.
Results: A total of 54,477 person-years of follow-up was observed with 864 deaths. Three latent classes of PA showed the best fitting model. Class 1 consisted of those not likely to report any forms of PA. Class 2 consisted of those more likely to report HPA and MPA only. Class 3 consisted of those more likely to report all four forms of PA. In the unadjusted model, adults in class 3 (Hazard Ratio (HR) =0.22, 95% CI: 0.15, 0.33) and class 2 (HR=0.38, 95% CI: 0.31, 0.47) were at less risk of all-cause mortality as compared to their class 1 counterparts. The fully adjusted model remained significant with adults in class 3 (HR=0.42, 95% CI: 0.30, 0.58) and class 2 (HR=0.46, 95% CI: 0.38, 0.55) at less risk of all-cause mortality as compared to their class 1 counterparts.
Conclusion: Results from this study indicate that latent classes of PA strongly predict all-cause mortality in U.S. adults.
Keywords: Latent class analysis (LCA); Epidemiology; Mortality; Physical Activity
Introduction
Physical activity (PA) is recommended for all U.S. individuals for its protection against and treatment of chronic disease [1-4] as well as its relationship with increased longevity [57] and increased health-related quality of life [8-9]. Current U.S. guidelines for PA recommend all adults accumulate 150+ minutes each week of moderate-intensity PA or an equivalent amount of combined moderate and vigorous-intensity PA [10]. Furthermore, different types of PA selected, independent of duration, has been shown to affect health outcomes in adults [11]. Given these known relationships between PA and health, it is still commonly understood that PA is a complex behavior that is generally assessed with varying amounts of measurement error [12]. This is true of both subjective [13,14] and objective methods [15]. Therefore, a need exists for advanced methods that may be able to measure complex behavior such as PA. Latent class analysis (LCA) is a statistical technique used to identify unobservable group membership using a set of observed variables [16,17].
PA behavior can be regarded as an unobservable (latent) behavior, in that it is too complex to measure precisely among free-living populations. Thus, latent variables can be indirectly measured using a number of related observed variables [18]. LCA, then, is a viable statistical method that aims to categorize objects into different groups where objects within each group are similar in terms of their responses to the observed variables while objects in other groups are as different as possible from other group objects [19]. More specifically, LCA has the ability to use scale items from a PA assessment and create latent groups of similar respondents that differ in the PA trait across groups. Furthermore, many large national surveys contain questions regarding PA behavior and can be used to form latent classes. Therefore, the purpose of this study was to use LCA with PA indicators from a large national health survey to predict allcause mortality in U.S. adults.
Methods
Participants and Design
The2001-02 National Health and Nutrition Examination Survey (NHANES) was used for this research. NHANES is a large national survey representing all non institutionalized U.S. citizens. NHANES is designed to assess health and nutrition information with datasets organized by category: demographics, dietary, examination, laboratory, questionnaire, and limited access. The National Centre for Health Statistics (NCHS) is responsible for linking mortality data to NHANES participants using a probability matching procedure [20]. The most recent mortality follow-up ending this past December 31, 2011. Only participants who were 18+ years of age and eligible for mortality linkage were used in the analysis.
Measures
Four PA variables were used in this study: home/yard (HPA), moderate recreational (MPA), vigorous recreational (VPA), and muscle strengthening (MSPA). The four PA variables (HPA, MPA, VPA, and MSPA) were determined from a series of questions asking respondents if they participated in that specific type of activity [20-22]. Each PA variable was dichotomized to represent participation (yes/no). HPA was assessed by the following question: "Over the past 30 days, did you do any tasks in or around your home or yard for at least 10 minutes that required moderate or greater physical effort? By moderate physical effort I mean, tasks that caused light sweating or a slight to moderate increase in your heart rate or breathing. [Such as raking leaves, mowing the lawn or heavy cleaning.]" MPA was assessed by the following question "Over the past 30 days, did you do moderate activities for at least 10 minutes that cause only light sweating or a slight to moderate increase in breathing or heart rate? Some examples are brisk walking, bicycling for pleasure, golf, and dancing."
VPA was assessed by the following question "Over the past 30 days, did you do any vigorous activities for at least 10 minutes that caused heavy sweating, or large increases in breathing or heart rate? Some examples are running, lap swimming, aerobics classes or fast bicycling." Finally, MSPA was assessed by the following question: "Over the past 30 days, did you do any physical activities specifically designed to strengthen your muscles such as lifting weights, push-ups or sit-ups?" Those respondents answering "yes" to either question were considered participating in that type of PA. Finally, five covariates were used for PSM: age, sex, race, and income.
Statistical Analysis
PROC LCA was used to determine distinct latent groups of PA behavior among U.S. adults [23,24]. LCA model fit was determined using the log-likelihood (G2) chi-square statistic, Akaike information criterion (AIC), and Bayesian information criterion (BIC). AIC is a measure of difference between the data and model likelihood functions. BIC is similar to AIC, however, BIC imposes a larger penalty (2 times the number of parameters add to AIC as opposed to log (N) times the number of parameters added to BIC) for increasing the number of model parameters. Both AIC and BIC (more so BIC) penalize for more complex models, with lower values indicating a relatively better model fit [25-27]. Prevalence estimates with their 95% confidence intervals (CIs) were computed for PA types, overall and across demographic variables. PA estimates were also computed across newly found latent classes and differences in prevalence tested using the chi-square statistic. PROC SURVEYPHREG was used to run Cox proportional hazards regression to model the effects of latent PA on mortality while controlling for age, sex, race, and income. SAS version 9.4 was used to account for the sampling design [28-30]. All significance levels were set to p=.05.
Results

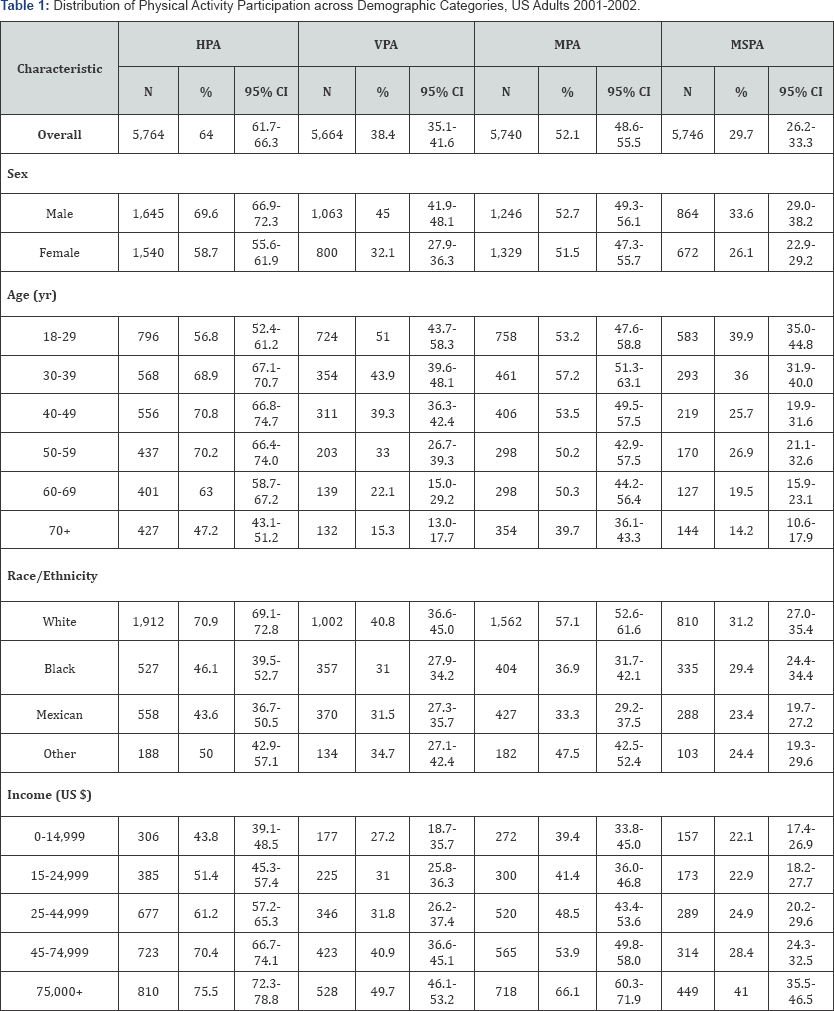
Note: HPA is home/yard PA. VPA is vigorous PA. MPA is moderate PA. MSPA is muscle strengthening PA. Estimates (%) refer to those that reported participating in that type of PA. CI is confidence interval. N is unweighted sample size.
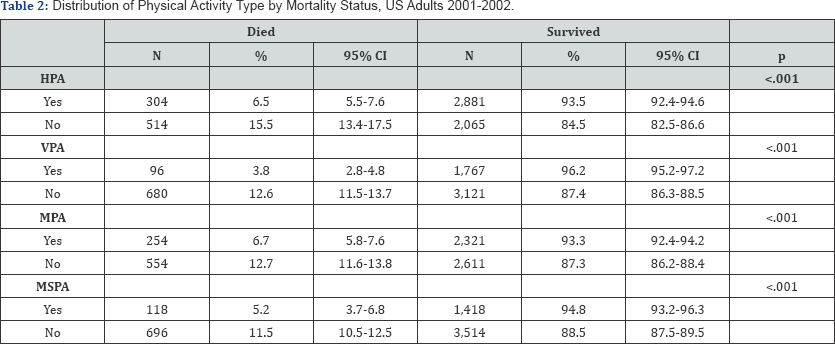
Table 1 displays baseline self-reported PA distributions by type and by demographic categories. Overall, 64, 38.4, 52.1, and 29.7% of participants reported engaging in HPA, VPA, MPA, and MSPA in 20101-02, respectively. More males reported participating in PA, across all types, than females. More younger participants reported VPA and MSPA than older ones. More White participants reported participating in different types of PA than their counterparts. Finally, more participants in the higher income groups reported different PA types than their counterparts. Table 2 displays self-reported PA distributions by type and by mortality status. Mortality rates were lowest for adults reporting VPA and MSPA, as compared to other types of PA. Table 3 displays LCA results from five different models (i.e., 1 thru 5 classes). The 3-class LCA model appeared to be the best fitting model, in terms of AIC and BIC measures.

Note: HPA is home/yard PA. VPA is vigorous PA. MPA is moderate PA. MSPA is muscle strengthening PA. CI is confidence interval. N is unweighted sample size.

Note: N=5,839. P is # of parameters. LL is the log-likelihood. AIC is Akaike information criterion (AIC=G2+2P). BIC is Bayesian information criterion (BIC=G2+log(N)P). G2 is the LL chi-square fit statistic. df is degrees of freedom. p is the p-value for G2. Tests of fit unavailable for negative df. A 3 class model was the selected LCA model. The intercept only model LL is -13885.53.

Note: N=5,839. HPA is home/yard PA. VPA is vigorous PA. MPA is moderate PA. MSPA is muscle strengthening PA. Prob is the conditional probability. SE is the standard error for prod. Class I consisted of those not likely to report any forms of PA. Class II consisted of those more likely to report all four forms of PA. Class III consisted of those more likely to report HPA and MPA only. Values in bold indicate high probability of endorsing that PA type.
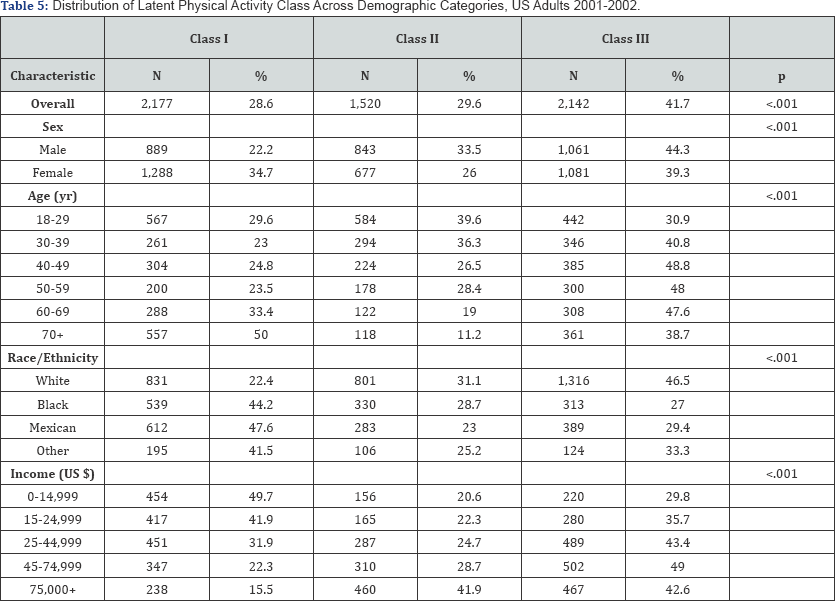
Table 4 shows the conditional probabilities associated with the 3-class LCA model. Each class showed a distinctly clear latent PA subgroup. That is, class I consisted of those not likely to report any forms of PA. Class II consisted of those more likely to report all four forms of PA. And class III consisted of those more likely to report HPA and MPA only. Table 5 displays distributions of latent PA class by demographic categories. More participants were categorized in class III than the other two (p<.001). More males were categorized in class II and class III, whereas, more females were categorized in class I (p<.001). More younger participants were categorized in class II, as compared to their counterparts (p<.001). More white participants were categorized in class III, as compared to their counterparts (p<.001). And finally, more participants in the higher income groups were categorized in both class II and III, as compared to their counterparts (Tables 6,7) display results of the combined LCA and mortality analyses.

Note: Class I consisted of those not likely to report any forms of PA. Class II consisted of those more likely to report all four forms of PA. Class III consisted of those more likely to report HPA and MPA only. p value is for the Rao-Scott chi-square statistic.

Note: Class I consisted of those not likely to report any forms of PA. Class II consisted of those more likely to report all four forms of PA. Class III consisted of those more likely to report HPA and MPA only. p value is for the Rao-Scott chi-square statistic.

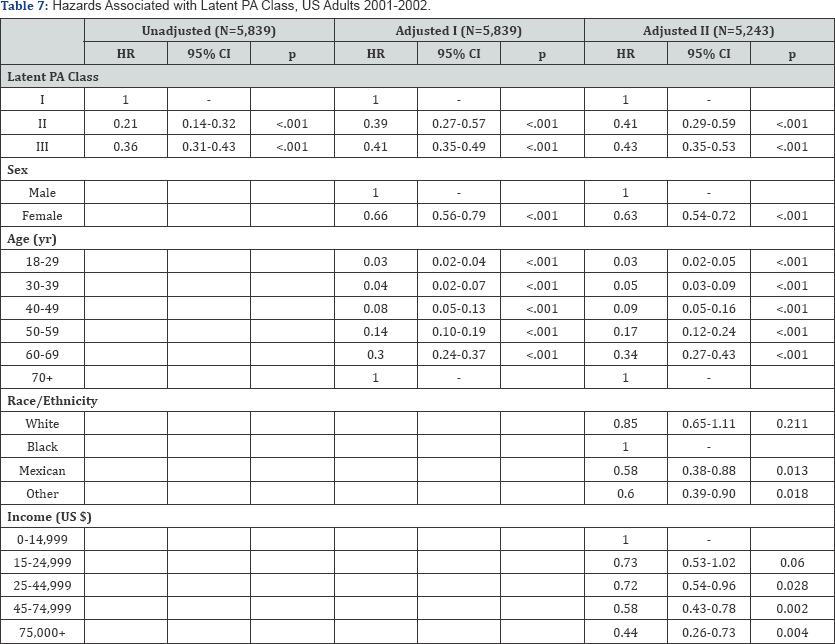
Note: HR is hazard ratio. CI is confidence interval. Class I consisted of those not likely to report any forms of PA. Class II consisted of those more likely to report all four forms of PA. Class III consisted of those more likely to report HPA and MPA only. p value is for t-statistic testing the HR. Adjusted I model is adjusted for age and sex. Adjusted II model is fully adjusted for age, sex, race/ethnicity, and income.
A total of 54,477 person-years of follow-up was observed with 864 deaths. Table 6 displays distribution of latent PA by mortality status. Mortality rates were lowest for class II (4.4%; 95% CI: 2.9-6.0) and class III (7.6%; 95% CI: 6.4-8.6). Table 7 displays hazards associated with latent PA. In the unadjusted model, adults in class III (Hazard Ratio (HR) =0.36, 95% CI: 0.31, 0.43) and class II (HR=0.21, 95% CI: 0.14, 0.32) were at less risk of all-cause mortality as compared to their class I counterparts. The age-sex adjusted model remained significant with adults in class III (HR=0.41, 95% CI: 0.35, 0.49) and class II (HR=0.39, 95% CI: 0.27, 0.57) at less risk of all-cause mortality as compared to their class I counterparts. Finally, the fully adjusted model remained significant with adults in class III (HR=0.43, 95% CI: 0.35, 0.53) and class II (HR=0.41, 95% CI: 0.29, 0.59) at less risk of all-cause mortality as compared to their class I counterparts.
Discussion
The purpose of this study was to first find a best fitting LCA model using four observed PA variables from a large national health survey. Results from LCA determined that a 3-class latent model fit the data best. The first group (class I) was made-up of respondents not likely to endorse any of the four PA variables (HPA, VPA, MPA, and MSPA). Thus, this group of individuals would be considered largely inactive. The second group (class II) was made-up of respondents more likely to endorse all four PA variables. Thus, this group would be considered highly active and possibly even structured exercisers. Finally, the third group (class III) was made-up of respondents more likely to endorse only HPA and MPA. This group would be considered moderately active and possibly even lifestyle or leisure participants of PA. The weighted prevalence of these classes at baseline are consistent with known distributions of physical inactivity and known distributions of adults meeting PA guidelines [31,32].
The second purpose of this study was to use the newly constructed latent PA classes to predict all-cause mortality in U.S. adults using a representative sample. Results clearly showed a dose-response relationship in latent PA and mortality. Specifically, mortality rates were lowest in class II participants, followed by a significantly and higher rate in class III participants, followed by a significantly and even higher mortality rate in class I participants. These findings are also consistent with previous findings, where adults participating in moderate-to-vigorous PA have been shown to be at lower risk of mortality as compared to their less active counterparts [33-35]. A unique aspect of this current study is its use of LCA to develop different classes of homogenous participants, different in their PA behavior, where other methods have provided less than optimal results.
Although using LCA to develop latent PA classes is novel, it is not unheard of in the PA literature. LCA has been successfully used to develop latent groups regarding food and PA proximity [36], PA patterns [37], diet and PA behavior [38], PA, sleep, and sedentary behavior [39], as well as accelerometer-determined latent PA [40]. This study has limitations worth discussing. One limitation is the use of self-reported PA behavior at baseline, as opposed to the use of a more objective method (e.g., accelerometers). This limitation may introduce a certain amount of error in classifying participants in terms of their endorsement of each of the four indicator variables. Although this fact should be considered, it however, should not be viewed as serious as if this study used self-reported items to measure duration and intensity of PA.
As a reminder, this study used self-reported variables that were only concerned with whether a participant engaged in a certain "type" of activity (i.e., HPA, VPA, MPA, and MSPA). Therefore, PA mis classification in this study may have been less severe as compared to other studies that aimed to more precisely measure PA. Another limitation is the use of baseline PA as an indirect predictor in a prospective study. That is, this study had no means of assessing changes in PA across the observational period. This fact is additionally true for all covariates used in model adjustments. Therefore, it is possible that some participants changed their behavior and/or changed their demographic status over the course of the study period. Thus, the findings in this study should be viewed with caution before considering their implications.
Conclusion
TResults from this study indicate that 3 latent classes of PA behavior exist among U.S. adults. Furthermore, latent classes of PA strongly predict all-cause mortality in U.S. adults. Health promotion specialists should consider latent PA classes as a means of marketing in physical activity interventions aimed at increasing longevity.
Acknowledgement
No financial assistance was used to assist with this project.
References
- Turner JE, Lira VA, Brum PC (2017) New Insights into the Benefits of Physical Activity and Exercise for Aging and Chronic Disease. Oxidative Medicine and Cellular Longevity.
- Ma Y, Wang YJ, Chen BR, Shi HJ, Wang H, et al. (2017) Study on association of working hours and occupational physical activity with the occurrence of coronary heart disease in a Chinese population. PloS one 12(10): e0185598.
- Abbott SE, Camacho F, Peres LC, Alberg AJ, Bandera EV, et al. (2017) Recreational physical activity and survival in African-American women with ovarian cancer. Cancer Causes & Control 29: 1-10.
- Bakrania K, Edwardson CL, Khunti K, Henson J, Stamatakis E (2017) Associations of objectively measured moderate-to-vigorous-intensity physical activity and sedentary time with all-cause mortality in a population of adults at high risk of type 2 diabetes mellitus. Preventive Medicine Reports 5: 285-288.
- Keadle SK, Arem H, Moore SC, Sampson JN, Matthews CE (2015) Impact of changes in television viewing time and physical activity on longevity: a prospective cohort study. International Journal of Behavioral Nutrition and Physical Activity 12(1): 1-156.
- Stessman J, Jacobs JM (2014) Diabetes mellitus, physical activity, and longevity between the ages of 70 and 90. Journal of the American Geriatrics Society 62(7): 1329-1334.
- Zahrt OH, Crum AJ (2017) Perceived physical activity and mortality: Evidence from three nationally representative US samples. Health Psychology 36(11): 1000-1017.
- Hart PD, Benavidez G, Erickson J (2017) Meeting recommended levels of physical activity in relation to preventive health behavior and health status among adults. Journal of Preventive Medicine and Public Health 50(1): 1-10.
- Hart PD (2016) Meeting recommended levels of physical activity and health-related quality of life in rural adults. Journal of lifestyle medicine 6(1): 1-111.
- Physical Activity Guidelines Advisory Committee (2008) Physical activity guidelines advisory committee report, Washington, DC: US Department of Health and Human Services
- Hart PD (2017) Physical Activity Mode and Survival in U.S. Adults. American Journal of Applied Mathematics and Statistics 5(4): 154-158.
- Edbrooke L, Denehy L, Parry SM, Astin R, Jack S, et al. How is physical activity measured in lung cancer? A systematic review of outcome measures and their psychometric properties. Respirology 22(2): 263277.
- Kim Y, Welk GJ (2017) The accuracy of the 24-h activity recall method for assessing sedentary behaviour: the physical activity measurement survey (PAMS) project. Journal of sports sciences 35(3): 255-261.
- Lim S, Wyker B, Bartley K, Eisenhower D (2015) Measurement error of self-reported physical activity levels in New York City: assessment and correction. American journal of epidemiology 181(9): 648-655.
- Zorrilla Revilla G, Mateos A, Prado Novoa O, Vidal Cordasco M, Rodriguez J (2017) Carrying loads: Validating a portable tri-axial accelerometer during frequent and brief physical activity. Journal of Science and Medicine in Sport.
- Sartipi M, Nedjat S, Mansournia MA, Baigi V, Fotouhi A (2016) Assets as a Socioeconomic Status Index: Categorical Principal Components Analysis vs. Latent Class Analysis. Archives of Iranian Medicine (AIM) 19(11).
- Tabachnick BG, Fidell LS, Osterlind SJ Using multivariate statistics.
- Everitt B, Skrondal A (2002) The Cambridge dictionary of statistics: Cambridge. Cambridge University Press, USA.
- Kongsted A, Nielsen AM (2017) Latent class analysis in health research. Journal of physiotherapy 63(1): 55-58.
- Zipf G, Chiappa M, Porter KS (2010) National Health and Nutrition Examination Survey: Plan and operations, 1999-2010. National Center for Health Statistics Vital Health Stat 1(56): 2013.
- CDC/National Center for Health Statistics. NCHS Data Linked to NDI Mortality Files.
- National Center for Health Statistics (2013) Office of Analysis and Epidemiology: Analytic Guidelines for NCHS 2011. Linked Mortality Files, Hyattsville, Maryland.
- PROC LCA , PROC LTA (2015) University Park: The Methodology Center, Penn State.
- Lanza ST, Dziak JJ, Huang L, Wagner A, Collins LM (2015) PROC LCA & PROC LTA users' guide University Park: The Methodology Center, Penn State.
- Dziak JJ, Coffman DL, Lanza ST, Li R (2012) Sensitivity and specificity of information criteria. The Methodology Center and Department of Statistics Penn State the Pennsylvania State University 16(30): 1-140.
- Wurpts IC, Geiser C (2014) Is adding more indicators to a latent class analysis beneficial or detrimental? Results of a Monte-Carlo study. Frontiers in psychology 5: 920.
- Finch HA (2015) Comparison of Statistics for Assessing Model Invariance in Latent Class Analysis. Open Journal of Statistics 5(3): 1-191.
- Allison PD (2010) Survival analysis using SAS: a practical guide. SAS Institute.
- Stokes ME, Davis CS, Koch GG (2012) Categorical data analysis using SAS. SAS institute.
- Cody RP, Smith JK (1985) Applied statistics and the SAS programming language. North-Holland.
- Centers for Disease Control and Prevention (CDC. Adult participation in recommended levels of physical activity--United States, 2001 and 2003. MMWR. Morbidity and mortality weekly report. 54(47): 12001208.
- Macera CA, Jones DA, Yore MM, Ham SA, Kohl HW, et al. (2003) Prevalence of physical activity, including lifestyle activities among adults-United States, 2000-2001. Morbidity and Mortality Weekly Report 52(32): 764-769.
- LaMonte MJ, Buchner DM, Rillamas Sun E, Di C, Evenson KR, et al.(2017) Accelerometer Measured Physical Activity and Mortality in Women Aged 63 to 99. Journal of the American Geriatrics Society.
- Dohrn M, Sjostrom M, Kwak L, Oja P, Hagstromer M (2017) Accelerometer-measured sedentary time and physical activity A 15 year follow-up of mortality in a Swedish population-based cohort. Journal of science and medicine in sport.
- Fan M, Yu C, Guo Y, Bian Z, Li X, et al. (2017) Effect of total, domain- specific, and intensity-specific physical activity on all-cause and cardiovascular mortality among hypertensive adults in China. Journal of hypertension
- De Weese RS, Ohri Vachaspati P, Adams MA, Kurka J, Han SY, et al.(2018) Patterns of food and physical activity environments related to children's food and activity behaviors: A latent class analysis. Health & place 49: 19-29.
- Lawler M, Heary C, Nixon E (2017) Variations in adolescents' motivational characteristics across gender and physical activity patterns: A latent class analysis approach. BMC public health 17(1): 600-661.
- El Ansari W, Berg Beckhoff G (2017) Country and Gender-Specific Achievement of Healthy Nutrition and Physical Activity Guidelines: Latent Class Analysis of 6266 University Students in Egypt, Libya, and Palestine. Nutrients 9(7): 700-738.
- Kim Y, Umeda M, Lochbaum M, Stegemeier S (2016) Peer Reviewed: Physical Activity, Screen-Based Sedentary Behavior, and Sleep Duration in Adolescents: Youth Risk Behavior Survey, 2011-2013. Preventing chronic disease
- Evenson KR, Herring AH, Wen F (2017) Accelerometry-assessed latent class patterns of physical activity and sedentary behavior with mortality. American journal of preventive medicine 52(2): 135-150.


