


Abstract
The criteria for the fulfillment of the quantum fluctuations theorem (QFT) of statistical physics for luminescence spectra are the thermal equilibrium of the initial quantum states and the uniformity of the emitting centers. In this paper, the applicability of QFT for thermoluminescence (TL) emission spectra of crystalline homogeneous structures is considered. As a rule, the measured emission spectra of thermoluminescence do not correspond to QFT. It is proposed in this paper to take into account the screening of TL centers to match the emission spectra of TL and QFT. Such accounting allows to find the position of a pure electronic transition by using the QFT method. It is found that the ensemble of TL emission starting states depends on the uniformity of the crystal structure. For crystals damaged by exciting irradiation the spectrum of emitting centers is broadened due to nonuniformity, but within close limits, which makes it possible to determine the average value of a pure electronic transition. As in other types of atomic-molecular luminescence the pure electronic transition is shifted to a shorter wavelength region relative to the maximum of the emission spectrum. According to the QFT the amount of displacement decreases with screening increase.
Keywords:Luminescence; Thermoluminescence; Pure electronic transition; Screening; Quantum fluctuation theorem
Introduction
Fulfillment of the Quantum Fluctuations Theorem (QFT) for the spectra of electronic transitions of molecular and other electron-nuclear structures have been studied for various types of their electronic spectra [1-4]. At the same time, it is necessary to keep in the mind that the QFT for electronic spectra provides regularities of adiabatic electronic transitions from the thermalized starting electron-nuclear structure. It turned out that not only optical, but also non-optically excited chemi- and bio- [1], electro- [2], tribo-, and other [3] luminescence’s satisfy QFT. The luminescence of directly optically excited luminescence centers of crystals, impurity crystals, F-centers, and impurity glasses satisfies the QFT [4]. However, due to the specificity of the excitation thermoluminescence was not considered despite the relevance. This article fills existing gaps.
Theory
As it was stated before, the form of QFT for luminescence with the assumption of approximate mirror symmetry model was obtained in [1,3]. In [4] the well-known basic QFT relation was used for optically excited luminescence centers of crystal structures. This relation belongs to a fairly wide section of statistical physics - the physics of fluctuations for fast state transitions of composite systems [1-3,5]. The main provision underlying the main ratio of QFT is the following [5-7]:
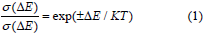
It connects cross sections (probabilities) of transitions in the absorption (“+”) and luminescence (“-”) spectrum with positive and negative fluctuations of the transition energy, where h is Planck’s constant, E00 and ν00 - are the energy and frequency of a pure electronic transition, E and ν – are the current energy and frequency of the luminescence spectrum, Т – is the temperature, k - is the Boltzmann constant.
Consideration of emission electron transitions from the internal orbitals of atoms in [8] showed that their spectra do not satisfy the QFT. The reason for this is a decrease in the electronnuclear interaction and influence on fluctuations of the elementary electronic transition. This type of influence can include both the overlap of the cross-section spectra of different transitions, and a range of internal and external disturbances. To account for this effect, it is necessary to introduce a correction factor that takes into consideration the change in the energy of fluctuations of the elementary emission transition by disturbances generically named “screening” [8]. Therefore, it was proposed to introduce corrections in relation (1) for the “ screening “ of fluctuations and a pure electronic transition in the form of their attenuation coefficient Ns:
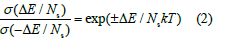
It can be seen from relation (2) that with such screening the contour of the spectrum narrows with increasing Ns, and the intensity of elementary transitions decreases.
For testing the ratio (2), as well as (1), is more convenient to represent as [7]:

where the pure electronic transition E00 is determined by the condition ΔE = E − E00 = 0 . For a better visibility of the function ϕ along the spectrum it is better to use the logarithmic form:
in absorption(E ≥ E00 )

and in emission (E ≤ E00)

These relations are symmetric with respect to E00, where ΔE = 0, and ϕ (E) has an extremum regardless of Ns. This allows you to determine E00 for any Ns. This symmetry reflects the symmetry of transition probabilities (micro-reversibility) at the elementary, quantum level [9]:

Analysis of the photoemission spectra shows that the nature of the “ screening” interactions is mainly intra-atomic. As an example, Figure 1 shows the photoemission spectrum of neon in the gas phase (as function at a pressure of 7.5 Pa [10]. The external disturbances here have only a collision nature. But the primary experimental spectrum does not satisfy the QFT. This discrepancy is eliminated only by the correction for screening. At Figure 1 the function ϕ (E) of the experimental spectrum is almost degenerated into a straight line. In accordance with relations (3) and (4) the function ϕ (E) should degenerate into a linear one only at large ΔE = E − Emax what is being observed in the spectra of homogeneous emission centers.

At the same time the spectrum of photo-emitted electrons from external valence orbitals does not show shielding as demonstrated by the spectrum of gaseous SF6 in Figure 2 taken from [10]. The pure electronic transition shifts to the maximum of the spectrum with increasing screening.
Spectrum analysis.
TL emission spectra of initially homogeneous
crystalline structures have been used. But the application of
thermoluminescence is usually focused on high-energy, X-ray, or
even corpuscular irradiation. We have previously showed [4] that
the E00 of luminescence and absorption for impurity centers are
well determined by the considered method. In this paper the type
of thermoluminescence in crystals with mentioned irradiation
and pretreated by annealing is considered [4]. For this purpose,
Figure 3 shows the thermoluminescence emission spectrum
at a temperature 4830 K for crystalline Li2B4O7 with copper as
impurity when beta irradiated by 90Sr/90Y at a dose 1600 Gy [11].
Here, the extremums of the φ-functions are extremely broadened what is caused by the inhomogeneity of the emitting centers. The same was observed for inhomogeneous centers in optically excited luminescence [4]. But despite the shielding and broadening due to the inhomogeneity of the emitting centers the generalized ϕ -functions have an extremum. It should be taken into account that, as noted above, the logarithmic form of the ϕ -function is used for the convenience to test the method.

More precisely, the extremum is set not by the logarithm, but in accordance with (2’) when the relative errors of the TL emission spectra measurement and ϕ -function spectra are equal. This is illustrated by comparing logarithmic (Figure 3, Ns =4) and simple (Ns =4’) forms of functions. According to such a broadened extremum E00 can naturally be attributed to the average value over all broadened by inhomogeneity radiating ensembles. Moreover, a comparison of the frequency dependence of the ϕ -function for the primary experimental spectrum (Ns =1) in Figure 1-3 data indicates the inhomogeneity of the screening of thermoluminescence centers.
In addition to the above regularity, it is possible to present the same effect, but on amorphous fused quartz Figure 4 [12]. In this case gamma irradiation with the same dose also causes inhomogeneity although somewhat weaker than in the previous Figure 3.

To confirm the nature of the inhomogeneity caused by β-irradiation Figure 5 shows the luminescence spectrum excited by 230nm light of the same as in Figure 3 Li2B4O7: Cu+ crystal, but not irradiated by β-particles [13]. The extremes of the ϕ -functions of the luminescence spectra here are noticeably narrower, but the primary spectra do not satisfy the QFT due to observed inhomogeneity of the screening the spectra are also somewhat broadened because the introduction of impurity ions reduces the uniformity of the crystal.


So, to conclude the evaluation of the influence of the effect of irradiation quanta energy on the thermoluminescence emission spectrum, here is an example of high-intensity irradiation by gamma quanta of a Li2B4O7 crystal doped with cerium [14]. Despite the dose of 1MR, the width of the extremes of the ϕ -function is noticeably smaller here in comparison with β-irradiation, i.e. the uniformity of the QFT ensemble is slightly higher.
It should be noted that the above regularities are also observed in polydoped crystals. Figure 6 shows the thermoluminescence emission spectra of a LiF crystal doped with magnesium, copper, sodium, and silicon in various proportions. The inhomogeneity of the emitting centers and their screening is approximately the same here, despite the difference in the ratio of concentrations of impurity centers.
Conclusion
Provided data show that also thermoluminescence emission spectra satisfy the QFT in the case of taking into account the screening. When excited by high-energy quanta that disrupt the crystal structure, the thermoluminescence centers are inhomogeneous, but form a generalized ensemble which is close to homogeneous. The preservation of inhomogeneity under all types of irradiations may also indicate the influence of a complex mechanism of excitation transfer with the resulting inhomogeneity of sites with luminescence centers, or the initial inhomogeneity of sites violating the agreement with QFT. Nevertheless, it is possible to determine an average pure electronic transition taking into account the changes caused by screening. As in other luminescence spectra, the pure electronic TL transition is shifted to the short-wavelength side from the maximum of the spectrum.
References
- Tolkachev V (2023) Pure Electronic Transition and Homogeneity of Luminophore from Chemi- and Bioluminescence. Spectra J Appl Spectr 90: 88-91.
- Tolkachev V (2023) Pure Electronic Transition in the Electroluminescence Spectrum. J Appl Spectr 90: 965-969.
- Tolkachev V, Kalinov V (2024) Pure Electronic Transitions of Non-Optically Excited Luminescence. JOJ Material Sci 9(1): 555753.
- Tolkachev V (2019) Zero-Phonon Transition Frequency in Diffuse Electronic Spectra of Color Centers in Crystals and Glasses. J Appl Spectr 86: 504-507.
- Kazachenko L, Stepanov B (1957) Mirror symmetry and form of emission and absorption bands of complex molecules. Optics and Spectroscopy 2(3): 339-349.
- Evans J, Searles J (2002) Fluctuation theorem. Adv Phys 51(7): 1529-1585.
- Kurchan J (1998) Fluctuation theorem for stochastic dynamics. Journal of Physics A: Math Gen 31 (16): 3719-3729.
- Tolkachev V (2025) Electron Photoemission Spectra of Molecular Structure and Quantum Fluctuation Theorem. J Appl Spectr 92: 705-710.
- Kawamoto T (2011) Microscopic analysis of the microscopic reversibility in quantum systems. J Stat Mech 2011: 11019.
- Gelius U (1974) Recent progress in ESCA studies of gases. J Electr Spectrosc & Relat Phenom 5 (1): 985-1057.
- Tiwari B, Rawat N, Desai D, Singh S, Tyagi M, et al. (2010) Thermoluminescence studies on Cu-doped Li2B4O7 single crystals. J Lumin 130(11): 2078-2083.
- Huntley D, Smith DG, Thewalt M, Prescott T, Hutton J (1988) Some quartz thermoluminescence spectra relevant to thermoluminescence dating. International Atomic Energy Agency (IAEA) 14(1/2): 27-33.
- Fairchild R, Mattern P, Lengweiler K, Levy P (1978) Thermoluminescence of LiF TLD‐100: Emission‐spectra measurements. J Appl Phys 49(8): 4512-4522.
- Lee I, Lee D, Kim J, Chang S (2006) Thermoluminescence emission spectra for the LiF: Mg, Cu, Na, Si thermos luminescent materials with various concentrations of the dopants (3-D measurement). Radiat Protect Dosim 119(1-4): 293-299.


