




 JOJHA Home




UAV and GIS Technologies for Urban Tree Health Canopy Structure
Hacı Murat Yılmaz1* and Murat Yakar2
1Department of Geomatics Engineering, Aksaray University, Aksaray, Türkiye
2Department of Surveying Engineering, Mersin University, Türkiye
Submission:September 25, 2026;Published: October 06, 2026
*Corresponding author: Hacı Murat Yılmaz, Department of Geomatics Engineering, Aksaray University, Aksaray, Türkiye
How to cite this article: Hacı Murat Y, Murat Y. UAV and GIS Technologies for Urban Tree Health Canopy Structure. JOJ Horticulture & Arboriculture, 6(4). 555691. DOI: 10.19080/JOJHA.2026.06.555691.
Abstract
Urban trees relieve heat, habitat, aesthetic, and carbon storage but municipal inventories are often partial (usually representing only street trees), outdated or at least seldom updated-in many cases developed years earlier than even the latest data census-and weakly connected to maintenance effects. When realized through unmanned aerial vehicle (UAV) sensing and geographic information systems (GIS), these inventories enable spatially explicit, repeatable tree-level evidence. This review integrates UAV RGB, multispectral, thermal and LiDAR data in GIS to synthesize narrow- down methods for observing urban tree health canopy structure biomass carbon. This compares acquisition design, photogrammetric and point-cloud workflows, crown delineation as well as health indicators with allometric modelling from the canopy area volume-based model which is directly computed explicitly to uncertainty communication. Applications in the review also include updating inventories regularly, drought and pest monitoring, analysing canopy equity, biomass & carbon reporting and maintaining streams of prioritisation. We conclude that for operational value, a neural network is less valuable than an efficient workflow which links time-series field reference data with co-registration metrics, tree identity and GIS decision rules to validate models in space. Long-standing challenges include occlusion, seasonal effects, overlaps between crowns from differing trees within the same pixel size or in an image taken at a subsequent time stamp, misalignment of sensors on different cameras is of high concern for predicting carbon transferability as well as uncertainty if tree measurements can propagate down to accurate estimates. We present a proactive framework that integrates multi-temporal UAV surveys with field measurements, interoperable GIS inventories and uncertainty layers for model governance. However, this approach supports arboricultural practice while allowing enough traceability to inform of defensible urban-greening and carbon-management decisions
. Keywords: UAV; GIS; Urban forestry; Tree health; Canopy structure; LiDAR; Biomass; Carbon; Photogrammetry; Remote sensing
Abbreviations: UAV:Unmanned Aerial Vehicle; GIS: Geographic Information Systems
Introduction
Urban trees are living infrastructure. The benefits produced are location-specific, species- specific (according to local climatic and social context), condition dependent as well as size dependent; the ability of municipal organizations to translate observations into action also contributes. Traditional inventories usually register a tree only at the time of ground survey. In contrast, UAV surveys have the potential to deliver centimeter-resolution imagery and three-dimensional data for parks, streetscapes, campuses and other managed green spaces. The spatial database, with analytical environment and reporting layer that powers those observations is GIS. This allows for repeated observation, comparison between dates and an explicit prioritization of inspections or interventions.
Photogrammetry is an important discipline that enables accurate measurement and spatial information extraction from images. Alyılmaz et al. [1], Mohanad [2], Yakar [3]. The technical foundation is ready but isn't automatic to implement. UAV photogrammetry utilizes overlapping images to produce dense point clouds, orthomosaics and surface models; UAV LiDAR samples three-dimensional canopy geometry directly. The two sources complement in that image texture and spectral response support health assessment, and point clouds support height, crown dimensions and structural metrics. Candan and Kaçar showed a real-time 3D point-cloud mapping workflow with UAV LiDAR, Özdemir et al. Method for the automated extraction of tree trunks from mixed LiDAR point clouds based on return properties. This research is particularly relevant where dense built form and diverse urban contexts obscure segmentation Yüksel [4]. Karatas [5].
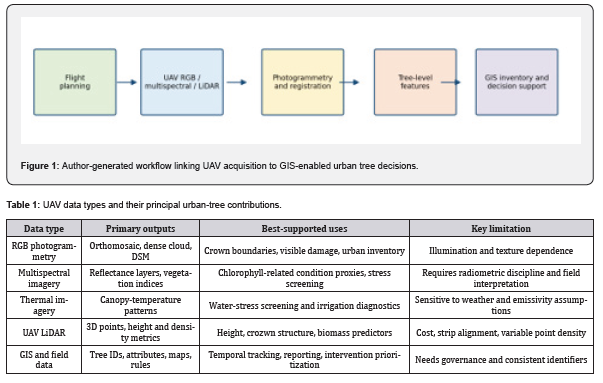
This manuscript synthesizes recent UAV-GIS methods across four related task workflows: (i) tree health assessment, (ii) canopy-structure characterization, (iii) biomass and carbon estimation; and ultimately for use in deep forest or urban canopies to inform future industrial decisions. More like urban arboriculture than broad-area forest inventory It comprises relevant publications provided by the author which cover UAV photogrammetry, terrestrial and mobile LiDAR and point-cloud-processing studies alongside IJEG. TUJE- is an extensive literature review in areas related to drones it combines Frontiers with a limited or no cross-matching study framework omitted for this volume timeline analysis-inferring only 1 focus stream of DRONE data as highlighted previously. We do not report a meta-analysis because sensor configurations, field protocols and tree species are too (Figure 1).
Georeferencing Registration and Quality Control
Spatial consistency is required before you can perform change detection or sensor fusion. For each acquisition, you need to provide documentation for ground control points, checkpoints, camera calibrations, and a coordinate reference system. The way in which the control points are distributed will have a significant impact on how well the positional data is generated using UAVs, particularly in areas that are long and thin or have rapid elevations changes, according to Yakar & Yılmaz [6] . This also holds true for urban tree monitoring: while producing a visually pleasing orthomosaic is great, if it is going to be used to compare trees to one another or maintain a record of trees over time, then having accurate location information is essentia (Table 1).
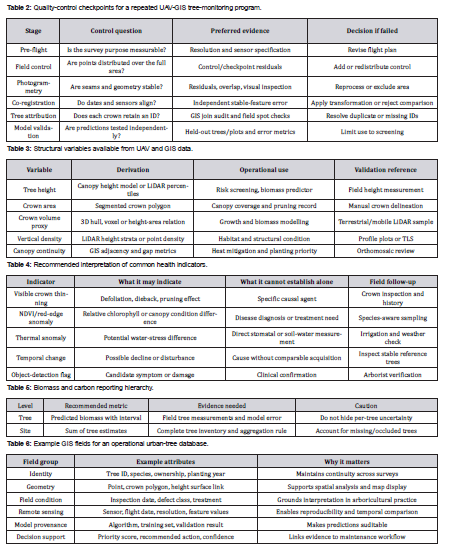
The Frontiers research topic developed by the author of this paper identifies robust alignment, feature extraction, similarity measures, and validation under complex transformations as being central to the problem of remote sensing applications. Registration errors exist within each flight line; across flight lines; and across different types of data (modality). In addition to assessing how well your images align visually, you should also assess registration through the use of independent stable features. Examples of such features include buildings, pavement markings, and permanent ground targets. However, canopy movement should never be used as a reference point for registration (Table 2).
Canopy Structure and Individual Tree Delineation
Canopy architecture can be assessed in different ways; for example, on a per-tree basis (the crowns), on a per-site basis (the park/stand) or on a citywide basis (the canopy network). Per-tree assessment includes metrics such as tree height, crown area, crown diameter, proxy for crown volume, vertical distribution and gap fraction. In most cases, a canopy-height model is derived from the difference between an elevation surface and a representation of the ground surface. If there are areas where the ground surface cannot be seen, a good digital terrain model will likely need to be created with data collected during a time when the leaves have fallen off the trees (leaf-off acquisition), through LiDAR, or with other sources of elevation data. It is important to state which method was used to create the digital terrain model so that researchers can understand if tree heights are being overestimated due to errors in creating the digital terrain model.
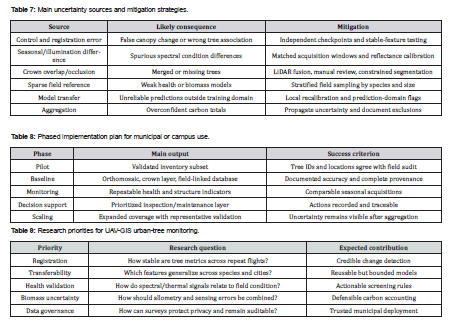
The individual tree delineation converts a continuous image or point cloud into an administrative unit. Open grown crowns continue to use local maxima and watershed techniques; however, there are many situations where performance can be improved by using object based image analysis, region growing, and deep learning. There are also several other types of failures that occur frequently such as overlapping crowns, shadow effects, leaf off period for deciduous trees, utility wires, and narrow streets. Zeybek [7]. showed how random forest could be used with UAV point clouds, and Canaz Sevgen [8] utilized random forest with airborne LiDAR in a complex urban environment. Both studies indicate the benefit of utilizing both geometric and radiometric data instead of just height thresholds (Figure 3).
Tree Health Assessment
UAV health assessment should be interpreted as a screening and prioritization system, not as a substitute for arborist diagnosis. RGB imagery can reveal defoliation, crown dieback, discoloration, broken branches, and visible pest damage. Multispectral data extend this with reflectance-based indices, but an index is a proxy whose meaning varies by species, phenological stage, canopy background, and illumination. Thermal imagery may reveal water-status differences, yet air temperature, wind, time of day, and surface properties all influence the signal.
Recent Frontiers reviews reinforce both the opportunity and the limitation. Ionova [9]. found that tree-pest and disease studies are increasingly dominated by UAV imagery and deep learning, but also reported limited generalizability across species, regions, and acquisition conditions. Beverly [10] .similarly showed that imaging approaches for plant water status need a biophysical interpretation and carefully designed measurements. Therefore, health models should be trained and evaluated with field-assessed condition classes, not only with image labels derived from the same acquisition. (Table 4).
Biomass and Carbon Assessment
Forest aboveground biomass, as estimated using remote-sensing predictors from a tree attribute observed on the field. Recommended initial was to build a locally suitable allometric model according to dbh, height or wood density as well as species and sometimes even combination of these. UAV data can either predict field attributes directly, or serve as predictors to an existing biomass model (after calibration). It is important to note that the biomass obtained from this calculation can only be converted to carbon if you mention what conversion factor, what pool definition, and uncertainty assumptions. Carbon stock, annual sequestration and avoided emissions are distinct quantities that should not be conflated.
One of the major advantages for using UAV LiDAR is that it provides measures related to canopy geometry on an individual-tree basis. Fu et al. For example, Bredehoeft et al. Wang et al. Reviewing multi-modal forest-resource monitoring (2026), you argue that optical, radar, LiDAR, UAV/satellite/ground observations are » complementary rather than interchangeable. This complementarity is also important in cities, where crown form, species mixture and surrounding built features deviate dramatically from forest-plot assumptions. Figure 3 Calibration chain from field reference to biomass and carbon maps when the author does that (Table 5).
GIS Integration and Municipal Applications
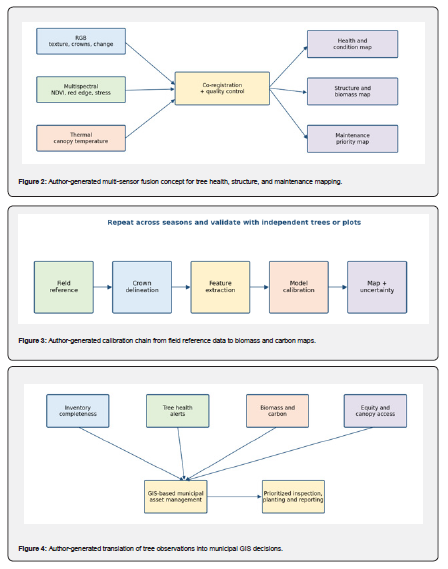
It is GIS that transforms these remotely sensed products into an inventory, which can be queried and updated, as well as communicated. A pragmatic schema connects a long-lasting tree identifier with geometry, species, planting date and ownership; last condition inspection history (and its recent remote-sensing data), new derived features for prediction by model version used in calculation of uncertainty and recommended action. It is supported by joins to irrigation zones, land ownership parcels, heat exposure measures, demographic indicators and maintenance routes. Automated tree detection is relevant to urban green space monitoring Alfarhood and Alabdullah [12] .while UAV-based land-cover analysis established that very fine-resolution imagery can serve as a bridge between field observations and landscape assessment. (Table 6).
Having a map of just one variable is probably the least valuable output. An example of a Maintenance-priority Layer combines Health Flag, distance to the nearest target, canopy size and broadleaf extent where it is prone-to-drought exposure as well as inspection age and confidence score. It should be interpretable: the decision rule and each input must visible to users. GIS can flag canopy deficits and aid in equitable planting decisions, but these outputs need social boundaries that are not derivable from vegetation data alone (Figure 4).
Challenges and Uncertainty
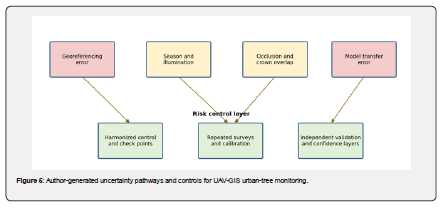
Uncertainties of urban tree mapping are unique to each other. Overlap, shadows and pruning Understory Façades, parked vehicles and wires often make street trees partially invisible. Seasonal comparisons may confuse genuine change with leaf phenology, light environment and flight geometry. Apparent growth or decline at crown edges can be caused by image registration. Biomass models do not transfer well between species, management regimes and size classes. Overlapping facets of error: a small horizontal misalignment alters crown area; the altered crown area affects a biomass predictor, and subsequently carbon difference propagates through larger uncertainty than it should (Figure 5).
Implementation Roadmap
One-off survey has a less stable foundation than an incremental program. Phase 1 establishes a representative tiny pilot, area protocol for the field & distance framework of stage as well as moderate GIS scheme. Phase 2 contrasts one RGB or multispectral survey with field inventory data and defines tree IDs. See Section 3. Phase 3 incorporates LiDAR or repeated acquisitions in cases where structural estimates, complex crowns or high-value trees warrant sufficient economic justification to incur the cost of frequent flights and/or airborne collection (Boon et al., 2020). Phase 4 is to intelligent feedback inspection and maintenance, meaning getting physical outputs from the field back into the next model cycle for improvement. The components of this cycle ought to be data-retention rules, privacy-aware flight planning and a procedure for making corrections on tree records that is documented (Table 8).
Future Directions
Future research should be focused on the transition between isolated demonstrations and integrated, multi-scale urban-tree observatories. Some of the most promising directions for research and application include multi-sensor fusion, multi-temporal change models, lightweight field applications to verify results by local ground-truth confirmation or satellite products with known quality assurance metrics (as opposed to target estimates alone); open but privacy-aware benchmark data; plus other model cards that describe the intended use case as well any non-standard failure states. This research on registration is critical, as UAV surveys must separate biological change from geometric inconsistency. In fact, one of the Frontiers research topics on complex image registration explicitly calls for studies addressing relevant problems that include but are not limited to remote-sensing applications (e.g., Figure 1) and methods providing benchmarking data and validation framework needed for reliable urban-tree change analysis as encountered in ecorestoration science (Frontiers in Imaging; http://www.frontiersin.org/research-topics/2050). AI can speed up crown delineation, symptom screening and point-cloud classification but requires domain-generalisation with caution. Research involving decision-making in forests emphasizes that predictive methods must reflect the dynamics and scale of their applications, rather than simply optimizing an objective accuracy score Rana [14]. This implies that for urban trees you will need to assess whether a model enhances field inspection, pruning, irrigation, planting or risk-management decisions. A system that detects uncertainty and requests inspection is better than a type which makes some unguided prediction [15-25] (Table 9).
Conclusion
In conclusion, when UAV and GIS technologies are designed as an integrated workflow rather than separate mapping exercises they can provide a powerful evidence system for urban arboriculture. RGB, multispectral, thermal and LiDar observations are complementary each providing different information; however field measurements registration controls tree identifiers GIS data determined whether that information can be trusted. The most effective applications integrate repeat assessment with the ability to report uncertainty and provide update input. Tree health products, biomass and carbon estimates should not replace diagnosis but inform inspections: methods for obtaining models, boundaries & uncertainty should be specified. An iterative implementation strategy provides early, useful inventory and maintenance benefits then expands toward integrated, multi-temporal decision support. Keeping track of urban tree carbon with this approach makes Urban Tree Monitoring an implementable, green-infrastructure management component that is transparent and continuously improving.
References
- Alyilmaz C, Alyilmaz S, Yakar M (2010) Measurement of petroglyhps (rock of arts) of Qobustan with close range photogrammetry. International Archives of Photogrammetry Remote Sensing and Spatial Information Sciences 38(Part 5): 29-32.
- Mohammed, Yakar M Yersel (2016) Modeling of places of worship with photogrammetric method. Selcuk University Journal of Engineering Sciences 15(2): 85-95.
- Yakar M, Yildiz F (2006) Digital photogrammetric methods in documentation of cultural heritages and Beysehir example In CIPA XX International Symposium 26.
- Yüksel G, Ulv A, Yakar M (2022). Usage of unmanned aerial vehicles in open mine sites. Intercontinental Geoinformation Days 4: 13-16.
- Karabacak A, Yakar M (2022) Wearable mobile LiDAR usage areas and 3D modeling of Cambazlı. Church Lidar Magazine Turkey 4(2): 31-12.
- Yakar M, Yılmaz HM (2025) Ground control point distribution in the production of location data with unmanned aerial vehicles. Geomatics 11(1): 16-12.
- Zeybek M (2021) Classification of UAV point clouds by random forest machine learning algorithm. Turkish Journal of Engineering 5(2): 48-57.
- Canaz Sevgen S (2019) Airborne lidar data classification in complex urban area using random forest. A case study of Bergama Turkey. International Journal of Engineering and Geosciences 4(1): 1-2.
- Ionova S, Wäldchen J, Mäder P (2026) Deep learning for the identification of tree pests, pathogens and disease symptoms: A systematic review. Frontiers in Forests and Global Change 9.
- Beverly DP (2020) Biophysically informed imaging acquisition of plant water status. Frontiers in Forests and Global Change 3.
- Krzystek P, Kranefeld E, Rathmann L, Kammel RA (2026) Single-tree delineation by instance segmentation using drone-based LiDAR and multispectral imagery A comparative study in various forest structures. PFG Journal of Photogrammetry Remote Sensing and Geoinformation Science 94: 333-357.
- Alfarhood M, Alabdullah N (2026) Satellite based tree detection for urban green space monitoring in arid environments. Frontiers in Environmental Science 14.
- Beverly D (2020) Biophysically informed imaging acquisition of plant water status. Frontiers in Forests and Global Change 3.
- Rana P (2021) Trustworthy predictive algorithms for complex forest system decision making. Frontiers in Forests and Global Change 3.
- Candan L, Kaçar E (2023) Methodology of real time 3D point cloud mapping with UAV lidar. International Journal of Engineering and Geosciences 8(3): 15-10.
- Colomina I, Molina P (2014) Unmanned aerial systems for photogrammetry and remote sensing A review. ISPRS Journal of Photogrammetry and Remote Sensing 92: 79-97.
- Dandois JP, Ellis EC (2013) High spatial resolution three dimensional mapping of vegetation spectral dynamics using computer vision. Remote Sensing of Environment 136: 259-276.
- Fassnacht FE, (2016) Review of studies on tree species classification from remotely sensed data.
Remote Sensing of Environment 186: 64-87. - Fu X, Ma W, Chen, Zhang, G Zhang (2026) Estimation of individual tree aboveground biomass of genetically diverse Catalpa bungei based on nonlinear mixed effects models and UAV LiDAR data. Frontiers in Plant Science 17.
- Karataş L, Alptekin A, Yakar M (2022) Detection and documentation of stone material deterioration in historical masonry structures using. UAV photogrammetry A case study of Mersin Aba Mausoleum Advanced UAV 2(2): 51-64.
- Karataş L, Alptekin A, Yakar M (2022) Restitution suggestion for Mardin TatlıDede Mansion. Advanced Engineering Days (AED) 4: 61-63.
- Moore C (2019) Human appropriated net primary productivity of complex mosaic landscapes. Frontiers in Forests and Global Change 2: 38.
- Wang M (2026) Research progress on multimodal data fusion in forest resource monitoring Frontiers. in Plant Science 16.
- Yilmaz H M, Yakar M, Yildiz F, Karabork H (2010) Determining rates of erosion of an earth pillar by terrestrial laser scanning Arabian Journal for Science and Engineering, 35(2A): 163-172.
- Özdemir S, Akbulut Z, Karslı F, Acar H (2021) Automatic extraction of trees by using multiple return properties of the lidar point cloud. International Journal of Engineering and Geosciences 6(1): 20-26.