


Chemical and Coloristic Profiles of Red and Rosé Wines from Domestic Production and Wineries of Moravia Wine Region
Tereza Huskova1, Lubomir Lapcik1,2*, Tomas Valenta1, Shweta Gautam1, Barbora Lapcikova1 and Miroslav Fisera2
1Department of Food Technology, Faculty of Technology, Tomas Bata University in Zlín, nám. T. G. Masaryka 5555, 760 01 Zlín, Czechia
2Department of Physical Chemistry, Faculty of Science, Palacky University Olomouc, 17. Listopadu 1192/12, 779 00 Olomouc, Czechia
Submission:April 22, 2025;Published: May 05, 2025
*Corresponding author: Lubomir Lapcik, Department of Physical Chemistry, Faculty of Science, Palacky University Olomouc, 17. Listopadu 1192/12, 779 00 Olomouc, Czechia
How to cite this article: Tereza H, Lubomir L, Tomas V, Shweta G, Barbora L, et al. Chemical and Coloristic Profiles of Red and Rosé Wines from Domestic Production and Wineries of Moravia Wine Region. Juniper Online Journal of Public Health, 9(5). 555664DOI: 10.19080/JOJHA.2025.05.555664.
Abstract
Polyphenols are crucial compounds in wines, influencing wines quality and sensory attributes such as color and taste. Understanding the factors affecting polyphenols concentration, as well as anthocyanins and mineral elements content, is essential for comprehending wine characteristics. This study aimed to investigate the influence of anthocyanins, polyphenols and mineral elements on the chemical and coloristic profiles of red and rosé wines from the Moravia wine region, specifically from Bzenec and Uherské Hradiště bio-regions. Color components were identified using CIELAB color assessment, while spectrophotometric and spectrometric methods were employed for chemical analyses. Mineral content was determined through inductively coupled plasma mass spectrometry. This study revealed that wines with higher polyphenolic content exhibited greater color intensity and increased astringency. Rosé wines showed lower anthocyanin levels compared to red wines. Notably, home-produced wines demonstrated exceptionally high polyphenol content, attributed to longer grape maceration times. This suggests a linear relationship between maceration time and polyphenolic content, emphasizing its impact on wine quality. The findings underscore the significance of polyphenols in determining wine characteristics and highlight the role of winemaking techniques in influencing polyphenol extraction.
Keywords:wine, domestic production, polyphenols, mineral elements, spectrophotometric methods, color analysis
Abbreviations: ICP: Inductively Coupled Plasma, MS: Mass Spectrometry, CIELAB: CIELAB Colors Assessment, UV/VIS: Ultraviolet-Visible Spectroscopy, CoSO4.7H2O: Cobalt Sulphate heptahydrate, MS: Mass Spectrometry, HNO3: Nitric Acid, GAE: Gallic Acid; TAC: Total Anthocyanin Content, H2O2: Hydrogen Peroxide, TPC: Total Phenolic Content, L*: Lightness, a*, b*: Chromaticity Coordinates, C*: Chroma, h°: Hue Angle
Introduction
Polyphenols play an important role in the wine industry because they are responsible for the quality and organoleptic properties of red wines, such as taste, and color. Polyphenolic substances vary greatly in their structure and are divided into flavonoid and non-flavonoid groups. Polyphenol content decreases in order from red to rosé and white wines where the content is the lowest [1]. In red wine, the polyphenol content is estimated to range from 800 to 6000 mg/L, while in white wines it is only 50 to 350 mg/L [2-4]. Measurement of total polyphenols is one of the basic analytical methods to assess wine quality. The Folin-Ciocalteau assay used in this study has been accepted by the European Copies as a basic method for the analysis of cellular content of polyphenols in wine [4-7]. Grapes are the main source of polyphenolic compounds in wine, mainly found in the skin and pulp, and in smaller amounts in the stones and juice. Another source of these important compounds may be the wooden barrels made of oak in which the wine is aged. Smaller quantities of phenolic compounds may also be produced by certain species of yeasts [8-9].
Flavonoid phenolic substances
Chemical structure of flavonoids consists of two benzene nuclei connected by a six-membered heterocycle with one oxygen heteroatom. They are derived from the oxygen heterocyclic compound flavan formed by two benzene nuclei linked by a heterocyclic pyran. These three rings undergo substitution by hydroxy or methoxy groups and the resulting derivatives then differ only in the degree of specific substitution and oxidation. Based the degree of oxidation at C3 position of the carbon, flavonoids are divided into: anthocyanidins, leucoanthocyanidins, flavanones, flavonols, which are most abundant in nature, and catechins [10].
Non-flavonoid phenolic substances
The non-flavonoid phenolic substances include hydroxybenzoic acids containing a carboxyl group bound to phenol. In grapes, these acids occur as glycosides, as compounds with sugars. From the glycosides it is possible, in the presence of alkaline hydrolase, to convert glycosides to their free form, which occurs particularly in red wines [11]. Hydroxycinnamic acids, which are among the main compounds found in white wine. As esters of tartaric acid, they are then present directly in the flesh of the berries and in the vacuoles of the grape skin. They are relatively easily oxidized and therefore have a significant effect on the browning of white wine and musts, when the transition from colorless substances to yellow-colored compounds takes place. In red wine hydroxycinnamic acids with anthocyanins formed acylated pigments mostly with p-coumaric and caffeic acids [12]. Stilbenes are substances present in wine, in grapes and in oak wood. They are complex polyphenols composed of two benzene nuclei linked by an ethylene or vinylene hydrocarbon residue. The stilbenes include trans- and cis-resveratrol, piceid and piceatannol [13]. The most important stilbenes include resveratrol. It is found in the skins of grape berries, from which it is extracted during fermentation of red wines, where it reaches concentrations of 1-3 mg/L [14]. The content and composition of polyphenolic compounds is influenced by several factors, ranging from the climatic conditions of grape cultivation to the winemaking technology and the way the grapes are processed [15-18].
Factors affecting the organoleptic characteristics of wine
The majority of coloring agents in red wines are anthocyanins, which are the most important dyes in vascular plants. Anthocyanins are found in grapes, red cabbage, elderberries, etc., providing them the red, blue or purple color. In grapes, anthocyanins are found mainly in the skins of the berries and in the peripheral layers of the flesh. During the maceration process, they influence the degree of wine coloring; the longer the grapes are macerated, the darker their coloring will be. Anthocyanins are known for their antioxidant capacity, especially in the prevention of cardiovascular disease, diabetes and cancer [19,20]. Anthocyanins are classified as polyphenolic compounds [20]. Naturally occurring anthocyanins are heteroglycosides that consist of both sugar and non-sugar components. The non-sugar component is an aglycone - anthocyanidin. The sugar component consists of five main carbohydrates, which are D-glucose, L-glucose, L-glucose, D-xylose, D-galactose or L-arabinose [21]. The sugar component binds to the aglycone by glycosidic linkage at the C3, C5 or C7 positions. Once the carbohydrate is glycosidic ally bound to the non-sugar component, the aglycone becomes an anthocyanin [20]. The major anthocyanins found in red wine include 3-O-monoglucosides such as: cyanidin (purple), Delphi din (purple blue), malvidin (purple), peonidin (purple), and petunidin (purple-blue). Malvidin (malvidin-3-O-glucoside) is generally the most abundant in wines, accounting for up to 90% of all anthocyanins in wine.
Acetylation of anthocyanins is also possible, e.g., by acetic, p-coumaric, oxalic, caffeic acids, etc.; acetylated anthocyanins are found in Cabernet Sauvignon grapes [22-24]. Grape varieties can be divided into two groups according to the presence or absence of anthocyanins in the berry skins. In white varieties, the regulatory gene required for the activation of anthocyanin biosynthesis is not present, hence anthocyanin (red) dyes cannot be synthesized. The skins of white berries are rich in chlorophyll (a, b) and other dyes. The riper the grape, the less chlorophyll it contains, as these dyes are gradually lost as the grape ripens. However, they are retained for the longest time in the outer layer of the skin cells and thus enter the must during pressing, together with carotenoids including xanthophylls. The quantity of these coloring agents can be increased in the musts if the crushed grapes are stored for a longer period and pressed at high pressures before pressing [25,26]. The color of wine is also influenced by factors such as aging process and oak barrel aging. During the ageing of red wine, the individual components of taste, color and aroma develop. The flavor of the wine changes to a milder one with less bitterness during ageing. The color can range from cherry red to deep brick red. In the oldest wines, a change to orange tones can be observed. It is not only the organoleptic characteristics mentioned above that can change, depending on external factors or the composition of the wine itself. These changes can be measured, for example, according to external conditions, which include oxidation phenomena, time and temperature.
The way a wine ages is also influenced by its phenolic composition (total phenolics), the ratio of tannin pigments to anthocyanins, and the type of tannins. Plant and yeast polysaccharides also influence the ageing potential. Anthocyanins and tannins extracted from grape skins are part of various reactions that produce a variety of compounds. These reactions include degradation, color stabilization, modification, polymerization of tannins or condensation with other components [11]. A very important factor in ageing is the type of container in which the wine is aged, as the extraction of compounds when wine is aged in wooden barrels is simply not comparable to aging wine in glass bottles. The ageing of wine in wooden casks is accompanied by many reactions in which the aforementioned phenols and anthocyanins react. The taste of the wine is more delicate as the astringency is reduced during the ageing in wooden casks. The intensity of the color also decreases, and the wine becomes browner in color. The change in color can be measured by reducing the absorbance to 520 nm in the red band and increasing the absorbance at 420 nm in the orange to brown band. Young red wines acquire their color largely due to monomeric anthocyanins. After more than one year, at least 50 % of the monomeric anthocyanins are replaced by the action of polymerizing anthocyanin pigments, which are less affected by temperature, pH changes or Sulphur dioxide. Polymerizing anthocyanin pigments therefore provide greater color stability [27]. Copigmentation is a natural process that is based on non-covalent complexation. It is the main mechanism for the stabilization and modulation of color in fruit, especially berries, and in foods derived from them, such as wine [28].
This is particularly the case for the color’s violet, red and blue, which suggests that copigmentation phenomena are mainly involved in the stabilization of anthocyanin color [28-30]. Thus, copigmentation phenomena occur between anthocyanins (pigments) and co-pigments, especially phenolic acids and flavonoids, where the basic role is to protect the flavylium ion from hydration and the formation of the hemiacetal form [31-33]. It is known that other pigments and dyes also form supramolecular structures, such as carotenoid aggregates [34]. However, aggregations of this type do not belong to copigmentation phenomena, as they are interconnections controlled by dispersion interactions. Copigments have no color and may be phenolic substances, metal ions, organic acids, polysaccharides or amino acids [20,24,30]. Minerals such as iron (Fe), magnesium (Mg), manganese (Mn), and potassium (K) can also affect the color of the wine. There are many studies that have investigated the influence of minerals on the color of wines, whereas information on the most important minerals, which is mainly potassium, is relatively scarce [35]. High iron content in the soil can lead to reddish-brown shades in red wines, while low iron content can cause more purple tones. In addition to iron, magnesium also affects the color of wine, and a lack of magnesium can lead to red wines with orange tints. Manganese also has a strong influence on the quality of wine. The results of studies show that wines with higher manganese content tend to oxidize faster [36]. It has been shown that higher concentrations of manganese in wine lead to oxidative losses of anthocyanins and tannins [37].
Potassium is able to maintain the red color of the wine, while a lack of potassium can lead to a loss of color. In addition to the above-mentioned minerals, elements such as copper, nickel, tin, aluminum, and zinc, as well as toxic metals like arsenic, chromium, lead, and cadmium, have been found to negatively affect the aroma, color, and taste of wine [38]. These elements can act as oxidation catalysts, leading to deterioration in wine quality. Their presence, even in trace amounts, may interfere with phenolic stability and accelerate degradation reactions, especially in red wines. Moreover, several studies have shown that cork or synthetic closures are more permeable to oxygen than screw caps, which contributes to a more rapid loss of color intensity and increased astringency. This oxidative degradation can be exacerbated by the presence of metal ions that promote oxidation reactions [39]. While other factors such as acidity level, alcohol and sugar concentrations, and even minerality also contribute to a wine’s resistance to aging, it is evident that the reduction of red wine’s power - of which color is a substantial component - is a critical factor in overall wine quality. The hypothesis of our study aimed to assess how the content of polyphenols, mineral elements, and anthocyanins influences the color profile of the wines under investigation. Additionally, we sought to determine how the method of wine production (home production versus production of wines in large wineries) affects the polyphenol content concerning the maceration process during wine production.
Materials and Methods
Sites characteristics Moravia Wine Region
The Moravia Wine Region extends from the southern tip of Moravia to the west of Brno. It is one of the most extensive winegrowing regions in the Czechia, as almost 96% of the vineyard area is located here. This wine region has excellent conditions for wine production. Red wines grown in this area never lack an earthy essence with a fruity character. However, today’s modern technology can produce wines with a very delicate and harmonious flavor [40].
Bzenec and Uherske Hradiste Wine Regions
The Bzenec Wine Region is the third smallest wine region in Slovácko, covering an area of 410 ha. It is situated between Vracov and Tucapy and consists of eleven other winery villages. The most cultivated wine in this area is Riesling. The wines under study were produced in the Bzenec Wine Region at an altitude around 180-200 m.a.s.l. In the lower parts of this region, the soil consists of warm and moist sand, and it changes to the massive clay of chernozem with the soil-progress. In the production period of studied wines, the average annual rainfall in the wine region was around 510 mm. The average air temperature in the wine growing season did not drop below 14 °C, and in the warm period, the average air temperature was above 17 °C, indicating a standard wine quality [41,42]. The vineyards of Uherské Hradiště region are characteristic with the warming effect of the south-lying Pannonian influence which here wanes and disappears.
Experimental wine varieties characteristics
Seven samples of wines (Tables 1 & 2) from the Moravia, Bzenec and Uherske Hradiste (vine slopes of Topolna) wine regions were used for the analyses. Four samples of wine were of the St. Laurent variety: from the winery of St. Florian Bzenec, vintage 2015 (sample 1), from the winery Lubos Polacek, vintage 2017 (sample 2), Chateau winery Bzenec, vintage 2018 (sample 3) and vintage 2019 (sample 4). One sample of Blauer Portugieser was from domestic production, vintage 2018 (sample 5). Two samples were rose wines, namely Rose Riesling, vintage 2006 (sample 6), from the domestic production, and Zweigeltrebe Rose, vintage 2019 (sample 7), from winery St. Florian Bzenec.


St. Laurent
The St. Laurent variety is typically grown in winery areas located in the northern parts, i.e. in places with a cooler climate suitable for growing this variety. It is harvested at the end of September. It has an intense red color and a high tannin content, with a pleasant bitter note in the taste [43].
Blauer Portugieser
The traditional growing areas for this variety are Bohemia, Moravia, Austria, and Hungary. Harvesting takes place from the second half of September. Blauer Portugieser wine has a typical floral aroma, but this may change during the ageing process to resemble the aroma of fresh hay. Compared to the St. Laurent variety, it has a less intense shade of color [44].
Rosé Riesling
Rosé Riesling is originally a German variety, it is mainly grown in northern wine regions. It is harvested at the second decade of October. Wine is high in quality owing to aromatic acids, giving the wine typical harmony attributes [43].
Zweigelt Rebe Rose
The Zweigelt Rebe variety, originally from Austria, belongs to the red wine varieties, but is very often used in the production of rosé wines, namely Zweigelt Rebe Rosé. It is harvested at the beginning of October. The wine is characterized by a very delicate, fruity taste [44].
Materials
Tannin solution (Sigma-Aldrich, USA), Folin - Ciocalteau reagent (Sigma-Aldrich, USA), cobalt sulphate heptahydrate (Sigma-Aldrich, USA), gallic acid (Sigma-Aldrich, USA), sodium carbonate (IPL - Ing. Petr Lukeš, Czechia), potassium desulphated (IPL - Ing. Petr Lukeš, Czechia), hydrochloric acid (IPL - Ing. Petr Lukeš, Czechia), buffer of pH 1.0: composed of 0.2 mol/L potassium chloride + 0.2 mol/L hydrogen chloride (Sigma-Aldrich, USA), nitric acid (Sigma-Aldrich, USA), hydrogen peroxide (Sigma-Aldrich, USA).
Wines Analyses
Samples were analyzed for their polyphenolic content, anthocyanin content, color intensity and hue, as well as for the coloring matters in red wine samples. The color assessment of wines was carried out using CIELAB method. For the determination of trace elements in the samples, the ICP - MS (inductively coupled plasma - mass spectrometry) was applied.
Folin-Ciocalteau reagent method
Folin-Ciocalteau reagent was used to form the color products by the reaction with phenolic compounds in analyzed samples [6,45]. Initially, 1 mL of diluted wine, 20 mL of distilled water and 1 mL of Folin-Ciocalteau reagent were added to 50mL volumetric flask. Subsequently, the entire contents were mixed thoroughly and after 3 min, 5 mL of 20 wt.% Na2CO3 solution was added, after which the flask was filled to the mark with distilled water and left in the dark for 30 min. The samples were measured in a 10mm cuvette at 700 nm wavelength using a CECIL CE 1021 UV/ VIS spectrophotometer. Color intensity was measured against the blank with zero tannin content. A calibration series of standard gallic acid solution was prepared. The measurements were evaluated using a linear dependence between the concentration of gallic acid and the volume of the wine sample (y = 0.0019x + 0.0871; determination coefficient R2 = 0.9981). The polyphenol content was expressed as mg of tannin per liter of wine. The dilution factor was considered in the results [46,47].
UV/VIS Spectrophotometry
Prior the analysis, samples of red wines were diluted with distilled water at a ratio of 1:30 (sample 1-4) and 1:15 (sample 5). For rosé wines (sample 6, sample 7) a dilution of 1:5 was used. The UV spectrum was detected using the wavelength range of 185- 400 nm, and the visible spectrum in the range of 400-700 nm. The measurements were carried out in a 10mm cuvette by the UV/VIS spectrophotometer UV mini 1240 (Shimadzu, Japan).
Determination of anthocyanin content, color intensity and hue of red wines
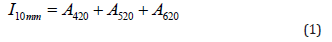
Anthocyanins form colorless compounds with bisulphide ions and subsequently change the absorbance, which is proportional to anthocyanin concentration. Firstly, 20 μL of freshly prepared 20 wt.% potassium disulphite solution was added to 1.3 mL of wine sample, and after 1 min the absorbance at 520 nm was measured against distilled water. Then 1 mL of the wine sample was mixed with 1 mol/L hydrochloric acid solution in a 50mL volumetric flask. After 60 min, the absorbance was measured at a wavelength of 520 nm. The color intensity was expressed as the sum of the absorbance values of the red wine measured in a 10mm cuvette at wavelengths of 420 nm (A420), 520 nm (A520) and 620 nm (A620) by UV/VIS spectrophotometer CECIL CE 1021 (Cecil Instruments, UK) [46,47].
Color intensity was calculated as follows:
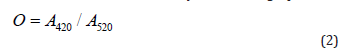
Color shade was determined by the following equation:
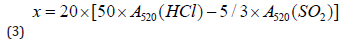
Anthocyanins were expressed in mg/L as follows:
Determination of coloring matters in red wines
The color content of red wines was determined by UV/VIS spectrophotometer CECIL CE 1021 (Cecil Instruments, UK). The standard used for the measurements was cobalt sulphate heptahydrate (CoSO4.7H2O). The value of the absorption maximum of the standard was very close to the value of the absorption maximum of the anthocyanin dyes in the red wine, assuming that the pH of the solution was equal to one. A calibration series was prepared in 25mL volumetric flasks with concentrations of 10-50 mg CoSO4.7H2O in 1 mL of distilled water, and then the absorbance of each sample was measured on a CECIL CE 1021 spectrophotometer at a wavelength of 520 nm in a 10mm cuvette against distilled water. In a 50mL volumetric flask, 1 mL of wine sample was mixed with 35 mL of buffer solution at pH 1. Subsequently, a control measurement of the pH value, which must be equal to one, was made. The volumetric flask was then filled to the mark with the buffer solution and the prepared solution was left in the dark for 60 min, after which its absorbance was measured under the same conditions as for the blank. The evaluation was made on the basis of the linear dependence of absorbance on the concentration of the dye standard CoSO4.7H2O. The concentration of the dyes was expressed in g/L [46,47].
CIELAB colors assessment
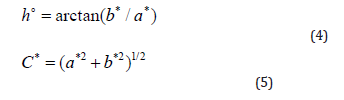
The color of red and rosé wines was determined according to CIELAB using the Ultra Scan PRO spectrophotometer (Hunter Lab, USA). Measurements were performed under a D65 light source and a viewing angle of 10° against distilled water as a standard. Wine samples were measured in glass cuvette of optical path length 10 mm (sample volume 20 mL). The optical path length was chosen on the optimal absorbance value range of the red and rosé wines, following the Beer-Lambert law [48]. The color parameters were calculated as L*, which represents the lightness ranging from 0 - black color, to 100 - white color. Furthermore, the positive values of a* indicate reddish colors, negative values greenish. Parameter b* in positive values specify yellowish colors, in negative values blue colors. Parameter h° represents hue angle, and parameter C* chromaticity saturation [49], calculated as follows:
ICP - MS analysis
Inductively Coupled Plasma (ICP) was used to ionize mineral elements in the wine samples, evaluated according to their m/z (mass/charge) ratio using the mass analyzer (MS) [50]. In the first step, it was necessary to treat the samples by microwave digestion, during which the organic substances, undesirable for the measurement, were decomposed. A volume of 0.5 mL of wine sample was mixed with 1 mL redistilled water in a mineralization cartridge. Subsequently, 7 mL of HNO3 and 1 mL of H2O2 were added to the solution. The samples thus prepared were subjected to mineralization in a microwave system according to set parameters in which the individual steps were precisely defined (ramp-up rate, duration, microwave energy, cooling). The mineralized solution was then quantitatively transferred into the plastic tubes and topped up with redistilled water to a volume of 25 mL, after than the sample was analyzed by Thermo iCAP RQ ICP-MS (Thermo Fisher Scientific Inc., USA).
Statistical analysis
Statistical analysis Data with a normal distribution were evaluated using analysis of variance (ANOVA test) with a one-way experimental design. Differences in the mean values among statistical groups were tested at a significance level of α ≤ 0.05. The statistical software Sigma Stat version 2.03 (Sy stat Software, Inc., San Jose, CA, USA) was used for data testing. The wines were measured in three replicates; each replicate was tested three times.
Results and Discussion
Folin - Ciocalteau method

Abbreviations: TPC: total phenolic content; GAE – gallic acid; aResults are expressed as the mean value ± standard deviation (n = 3). Significant differences (ANOVA, p < 0.05) were determined between the samples.
As shown in Table 3, the total polyphenol content (TPC) of red wines ranged from 668 to 5086 mg/L. This is comparable with the values of TPC reported by other authors [51], assuming that the climate, soil and processing conditions influenced the quantity of polyphenols in wine samples [52,53]. In addition to this, the polyphenol content was probably affected by the processing of wine grapes, in particular maceration and pressing. The highest polyphenol content was determined in sample 5 of the Blauer Portugieser variety. This was a home-produced wine which was left on the skins for a considerable period of time (macerated); this processing showed to have a significant effect on the number of polyphenols in the sample. In the case of sample 1 (St. Laurent variety), the traditional (domestic) production of the wine was also preserved and probably contributed to a higher polyphenol content of 2180 mg/L. The lowest polyphenol content was analyzed in sample 6, which may have been influenced by relatively unfavorable climatic conditions in the cultivation year 2006.
UV-VIS spectrophotometry

Abbreviations: aλ/A: detection wavelength/absorbance. bthe hyphen means that no peak was detected in the relevant wavelength range.

UV-VIS spectra of wine samples were determined in wavelength region of 200-700 nm, as presented in Table 4. In the UV part of the spectrum at 273-276 nm, peaks corresponding to the presence of polyphenolic substances were detected (Figure 1). This observation was consistent with the results presented by Aleixandre-Tudo et al. who determined an absorption band at 280 nm, being attributed to the UV absorption of hydroxybenzoates, stilbenes, flavan-3-ols and anthocyanins [54]. The presence of anthocyanins (blue-red polyphenolic dyes) has also been reported based on the peak detected in the range 510-540 nm in all samples (Figure 2A-G), except sample 6 (Figure 2F). It can therefore be concluded that the Rosé Riesling (sample 6) variety had relatively low anthocyanin dyes content, compared to other wines under study. In the case of rosé wines (sample 6 and 7) (Figure 2F,G), an absorption maximum was found around 320- 330 nm. As reported by Scano (2021), the absorption maximum at 320 nm corresponds to the presence of hydroxycinnamic acid, which can be found in rosé varieties. Thus, the tested wines can be considered as relatively abundant of the hydroxycinnamic (phenolic) acid [55]. The absorption maximum around 370-380 nm detected for samples 1, 3 and 4 can be related to the presence of flavonols, which Sanna et al. determined in wine samples at 350 nm. The shift to the wavelength of 370-380 nm detected in our study is likely due to the hydrolysis of glycosylated flavonols to their free form that occurs over time [56,57]. Absorption peaks detected in a broad VIS region of 420-650 nm can be attributed to the presence of anthocyanins and polyphenolic tannins, which stabilize and enhance the color intensity of red wines [55].

Determination of anthocyanin content, color intensity and hue of red wines
As can be seen in Table 5, values of color intensity I and color shade O did not differ significantly between the red wines. The highest value of color intensity was determined for sample 3 of the St. Laurent variety, where the color intensity reached (1.189 ± 0.012). This sample had a very intense mahogany color. In contrast to this, the lowest color intensity was found for sample 7 of the Zweigelt Rebe Rosé variety. The color intensity of rosé wines was relatively consistent with the results presented by other authors [58], who investigated rosé wine samples. The highest color intensity value of (1.858 ± 0.014) was measured for sample 6 (Rosé Riesling), which also had a visually pure amber color. As shown in Table 5, the anthocyanin content ranged from 73 to 146 mg/L. The most anthocyanins, (146 ± 0.02) mg/L, were determined in the sample 4 of the St. Laurent variety, vintage 2019. For older wine samples (2015-2018 vintages), the amount of anthocyanin varied: sample 1 (87 mg/L), sample 2 (77 mg/L), and sample 5 (73 mg/L). The low values may be affected by the age of the wine, where the free anthocyanin content of the wine generally decreases over several years; anthocyanin molecules are unstable and react with tannins to form stable compounds, which affect the color of older wines [59]. The anthocyanin content may also be influenced by the production of the wine (maceration, pressing, addition of Sulphur dioxide) and by the climate and soil conditions during the cultivation of the vines [60]. In the case of sample 6 (Rosé Riesling variety), it was not possible to detect the anthocyanins, probably due to the absence of relevant coloring, affected by the age of the wine and/or unfavorable climatic conditions in the production year 2006.

Abbreviations: TAC: anthocyanin content; I: color intensity; O: hue, aResults are expressed as the mean value ± standard deviation (n = 3). Significant differences (ANOVA, p < 0.05) were determined between the samples. bthe hyphen means that no value was possible to determine.
Coloring matters in red wines
As shown in Table 6, the values of coloring matters in red and rosé wines ranged from 0.1 to 6.0 g/L. The lowest content of red dyes was measured in the Rosé Riesling (sample 6) at 0.1 g/L, which was also evident from the visual assessment, where the wine was rather orange in color. The reason for the low red color value was also due to the absence of anthocyanins as red coloring agents in the wine. The pink wine of the Zweigelt Rebe Rosé variety, which had an intense pink color, contained more red dyes than the Rosé Riesling. The reddest dyes were analyzed in red wine sample 3, with a concentration of 6.0 g/L. The red wine with the highest content of anthocyanin dyes had a very intense red color, which correlated with the high values of the anthocyanin content in mg/L.

Abbreviations: aResults are expressed as the mean value ± standard deviation (n = 3). Significant differences (ANOVA, p < 0.05) were determined between the samples.
CIELAB color assessment
The color parameters (L*, a*, b*) of red and rosé wine samples were measured and the values characterizing the color of red and rosé wines were obtained. The color parameters of the analyzed wines were projected into the CIE L*a*b* color space (Figure 3A). The results depicted in the color space show that all red wine samples were colored red or blue. The pink wines had a red and slightly yellow color component. As can be seen in Table 7, pink wines (samples 6 and 7) had a higher brightness than red wines (samples 1-5). Sample 3 had the lowest brightness value, so it can be highlighted that this sample was the darkest of all the wines under study (L* = 68.76). The highest value of the a* coordinate was measured for sample 7 (a* = 4.52), i.e., for rosé wine. Thus, this sample contained the reddest color components of all the pink and red wine samples. Compared to the pink wine sample 6, sample 7 had visibly higher pink coloration. All values of the a* coordinate was measured to be positive, so it can be argued that there was no green color component present in any of the red and pink wine samples. From the measured values of the b* coordinate, there was a clear difference between the red and rosé wines which had more yellow color components. The most yellow color was measured in sample 6 (b* = 5.63). This finding was confirmed by visual assessment, where the pink wine sample was deep amber in color. In contrast to this, the bluest tones (b* = -0.37) were found in the red wine sample 1. Because the hue angle h° and chromaticity C* were calculated from the values of the coordinates a* and b*, the analysis of the color data revealed a positive correlation between b* and its chromaticity C* (R2 = 0.99). Figure 3B depicts that compared to the b* coordinate, the relationship between the chromaticity C* and the a* coordinate was more discrete. This implies that the chromaticity of wines was mainly controlled by the b* coordinate. A similar correlation was assessed between the chromaticity b* coordinate and the hue angle h° (R2 = 0.97), where the correlation was also highly positive. Figure 3C shows that, compared to the b* coordinate, the relationship between the hue angle h° and the a* coordinate was more discrete; thus, the hue of the wines was mainly controlled by the b* coordinate [61].

Abbreviations: L*:lightness , a*, b*: chromaticity coordinates, chroma: C*; hue angle: h°; a Results are expressed as the mean value ± standard deviation (n = 3). Significant differences (ANOVA, p < 0.05) were determined between the samples.

ICP - MS analysis
As can be seen in Figure 4, the iron (Fe) and manganese (Mn) concentrations were comparable, contrasting to higher values of magnesium (Mg) and potassium (K) content. As shown in Table 8, iron concentrations ranged from 0.34 to 1.26 mg/L. It was in accordance with typical iron concentration in the wines reported between 0.1 to 20 mg/L, which can be influenced by many cultivation and processing factors [62]. As found by Starr and Francis, wine grapes contain more or less soil dust on their surface, some of which inevitably gets into the juice during pressing, and thus increases the iron content [63]. The highest iron concentration was determined in sample 6 (1.26 mg/L), as can also be seen in Figure 3. Similar values of iron concentrations were also found by metal-content investigation of red wine by [64]. Due to the fact that higher iron levels affect the oxidation of wine, and iron forms complexes with phosphates and tannins causing wine to become unstable, cloudy or discolored [65], relatively lower iron concentrations of the samples under study can be considered as optimal, indicating no risk of precipitate formation or deterioration of the wine’s stability. The manganese concentrations in studied samples ranged from 0.70 to 1.22 mg/L. These values are similar to the results reported by Stroh et al., ranging from 0.61 to 1.70 mg/L [66]. Comparable values were also presented by other authors [67,37]. The highest value was determined in sample 1 (red wine) at concentration (1.22 ± 0.01) mg/L, and the lowest in sample 5 at (0.70 ± 0.03) mg/L (rosé wine). Cabrera-Vique et al. reported that manganese concentrations decrease in order from red wines to white wines.

Abbreviations: aResults are expressed as the mean value ± standard deviation (n = 3). bFe: iron; cMn: manganese; dMg: magnesium; eK: potassium. Significant differences (ANOVA, p < 0.05) were determined between the sample.
In the present study, a higher concentration was found in rosé wine (sample 7) than in red wine samples. The reason for this may be due to a higher amount of manganese in the soil where the Zweigelt Rebe grape variety was grown, associated with the fact that Mn concentration did not increase with the age of the wine, as found by [67].Magnesium concentration in analyzed samples ranged from 38.62 to 77.71 mg/L. This was consistent with a broad magnesium quantity reported for the wines (10-200 mg/L), being more prevalent in red wine varieties [9,65,68], which was also the case of our study. Moreover, the magnesium content can be assumed as relatively constant in a particular wine due to the solubility of magnesium salts [69]. The lowest amount of magnesium was found in sample 5. It can be deduced that the wine was grown in a drier sandy soil characterized by a less magnesium content [68]. In contrast to this, the highest Mg concentration was determined in sample 1, which may indicate a higher rainfall in the cultivation year 2015. The concentration of potassium in analyzed samples ranged from 106.01 to 184.82 mg/L. Czibulya et al. investigated the dependence of potassium ions on the color of red wines, and found that wines with higher concentrations of potassium ions showed significantly higher color stability [35]. This relation correlates with the values in our study, where the highest anthocyanin and color content of red wines was found in the samples with the highest potassium concentration of 184.82 mg/L and 173.05 mg/L (samples 3 and 4), respectively.
Conclusion
In this study, colorimetric, spectrophotometric and spectrometric methods were applied to analyze the color profiles of specific red and rosé wines. The number of compounds affecting the color and mineral elements such as Fe, Mg, Mn and K were determined. Samples of red and rosé wines from the Moravia wine region, from larger wineries and domestic production as well, were selected for the measurements. It was found that the highest number of polyphenolic compounds was found in wines from domestic production (samples 1 and 5). This is because the polyphenols’ content increased with the maceration time of the grapes, which lasted longer under domestic conditions. The CIELAB color assessment showed that the darkest wine was the red wine of the St. Laurent variety, production year 2018 (sample 3). The values of CIELAB color analysis correlated with the results of the spectrophotometric methods used to determine the content of anthocyanins and the coloring agents of red wines; sample 3 and sample 4 of the St. Laurent variety showed the highest values. These samples also had the highest concentration of potassium ions, affecting color stability of the wines.
Data Availability
The data underlying this study are available on request from the corresponding author.
Acknowledgment/Author disclosures
The authors declare no conflicts of interest in this research. The authors would like to gratefully acknowledge funding from Tomas Bata University in Zlin (project numbers IGA/FT/2024/005 and IGA/FT/2025/007).
Conflict of Interest
The authors report there are no competing interests to declare.
References
- Li H, Wang X, Li Y, Li P, Wang H (2009) Polyphenolic compounds and antioxidant properties of selected China wines. Food Chem 112(2): 454-460.
- Chamkha M, Cathala B, Cheynier V, Douillard R (2003) Phenolic Composition of Champagnes from Chardonnay and Pinot Noir Vintages. J Agric Food Chem 51(10): 3179-3184.
- Quideau S, Deffieux D, Céline D, Laurent P (2011) Plant Polyphenols: Chemical Properties, Biological Activities, and Synthesis. Angew Chem International Edition 50(3): 586-621.
- Garaguso I, Nardini M (2015) Polyphenols content, phenolics profile and antioxidant activity of organic red wines produced without sulfur dioxide/sulfites addition in comparison to conventional red wines. Food Chem 179(1): 336-342.
- Folin O, Ciocalteu V (1927) On tyrosine and tryptophane determinations in proteins. J Biol Chem 73(2): 627-650.
- Li H, Wang X, Li Y, Li P, Wang H (2009) Polyphenolic compounds and antioxidant properties of selected China wines. Food Chem 112(2): 454-460.
- Singleton V, Orthofer R, Lamuela-Raventós R (1999) Analysis of total phenols and other oxidation substrates and antioxidants by means of folin-ciocalteu reagent. In: Oxidants and Antioxidants Part A. Methods in Enzymology, Vol. 299, Academic Press, San Diego, California, USA pp. 152-178.
- European Commission (2010) List and description of methods of analysis referred to in the first paragraph of Article 120g of Council Regulation (EC) No 1234/2007 OJEU.
- Shinohara T, Kubo Dera S, Yanagida F (2000) Distribution of phenolic yeasts and production of phenolic off-flavors in wine fermentation. J Biosci Bioeng 90(1): 90-97.
- Jackson R (2008) Wine Science: Principles and Applications. 3rd, Elsevier Academic Press, Amsterdam, Boston, Heidelberg pp. 222-234.
- Velíšek J (1999) Food Chemistry. 3rd ed., OSSIS, Tá ISBN 978808665917.
- Ribâereau-Gayon P, Glories Y, Mau jean A, Dubourdieu D (2006) Handbook of Enology. John Wiley, Chichester pp. 347-355.
- Aleixandre-Tudo JL, Du Toit W (2018) The role of UV-visible spectroscopy for phenolic compounds quantification in winemaking. In: Solís-Oviedo RL, Pech-Canul ÁDLC (Editors.), Frontiers and new trends in the science of fermented food and beverages. Intech Open, Rijeka, Croatia pp. 1-18.
- Langcake P (1981) Disease resistance of Vitis spp. and the production of the stress metabolites resveratrol, ε-viniferin, α-viniferin and pterostilbene. Physiol Plant Pathol 18(2): 213-226.
- Jeandet P, Bessis R, Maume B, Meunier P, Peyron D, et al. (1995) Effect of Enological Practices on the Resveratrol Isomer Content of Wine. J Agric Food Chem 43(2): 316-319.
- Landrault N, Poucheret P, Ravel P, Gasc F, Cros G, et al. (2001) Antioxidant Capacities and Phenolics Levels of French Wines from Different Varieties and Vintages. J Agric Food Chem 49(7): 3341-3348.
- Netzel M, Strass G, Bitsch I, Könitz R, Christmann M, et al. (2003) Effect of grape processing on selected antioxidant phenolics in red wine. J Food Eng 56(2): 223-228.
- Mulero J, Zafrilla P, Cayuela J, Martínez-Cachá A, Pardo F (2011) Antioxidant Activity and Phenolic Compounds in Organic Red Wine Using Different Winemaking Techniques. J Food Sci 76(3): C436-C440.
- Atanacković M, Petrović A, Jović S, Buka Rica L, Bursać M, et al. (2012) Influence of winemaking techniques on the resveratrol content, total phenolic content and antioxidant potential of red wines. Food Chem 131(2): 513-518.
- Mazza G, Francis F (1995) Anthocyanins in grapes and grape products. Crit Rev Food Sci Nutri 35(4): 341-371.
- Castañeda-Ovando A, Pacheco-Hernández M, Páez-Hernández M, Rodríguez J, Galán-Vidal C (2009) Chemical studies of anthocyanins: A review. Food Chem 113(3): 859-871.
- Balik J (2010) Anthocyanin pigments in grapes and wines. Mendel University in Brno, Brno, Czech Republic pp. 1-100.
- Clifford M (2000) Anthocyanins - Nature, occurrence and dietary burden. J Sci Food Agric 80(7): 1063-1072.
- Kowalczyk E, Krzesiński P, Kura M, Szmigiel B, Błaszczyk J (2003) Anthocyanins in medicine. Pol J Pharmacol 55(5): 699-702.
- Welch C, Wu Q, Simon J (2008) Recent advances in anthocyanin analysis and characterization. Curr Anal Chem 4(2): 75-101.
- Minárik E, Navara A (1986) Chemistry and microbiology of wine. Príroda, Bratislava, Slovakia pp. 123-130.
- Walker A, Lee E, Bogs J, McDavid D, Thomas M, et al. (2007) White grapes arose through the mutation of two similar and adjacent regulatory genes. Plant J 49(5): 772-785.
- Hornsey I (2007) Chemistry and biology of winemaking. Royal Society of Chemistry, Cambridge pp. 78-90.
- Trouillas P, Sancho-García J, De Freitas V, Gierschner J, Otyepka M, et al. (2016) Stabilizing and Modulating Color by Copigmentation: Insights from Theory and Experiment. Chem Rev 116(9): 4937-4982.
- Brouillard R, Mazza G, Saad Z, Alberecht-Gary A, Cheminat A (1989) The co-pigmentation reaction of anthocyanins: a microprobe for the structural study of aqueous solutions. J Am Chem Soc 111(7): 2604-2610.
- Boulton R (2001) The Copigmentation of Anthocyanins and Its Role in the Color of Red Wine: A Critical Review. Am J Enol Vitic 52(2): 67-87.
- Asen S, Stewart R, Norris K (1972) Co-pigmentation of anthocyanins in plant tissues and its effect on color. Phytochemistry 11(3): 1139-1144.
- Goto T, Kondo T. (1991) Structure and molecular stacking of anthocyanins-Flower color variation. Angew Chem Int Ed Engl 30(1): 17-33.
- Gonzalez E, Fougerousse A, Brouillard R (2001) Two diacylated malvidin glycosides from Petunia hybrida flowers. Phytochemistry 58(8): 1257-1262.
- Sliwka H-R, Partali V, Lockwood S (2010) Hydrophilic carotenoids: carotenoid aggregates. In: The structural properties, characteristics, and interactions of carotenoids: Physical, chemical, and biological functions and properties. CRC Press, Boca Raton, Florida, USA pp. 31-58.
- Czibulya Z, Horváth I, Kollár L, Kunsági-Máté S (2012) Unexpected effect of potassium ions on the copigmentation in red wines. Food Res Int 45(1): 272-276.
- Pereira C (1988) The importance of metallic elements in wine. A literature survey. Z Lebens Unters Forsch 186(5): 295-300.
- Nikfardjam M, Gausz I, Farkas V (2012) Determination of manganese in musts and wines from three different wine regions of Hungary (Vintages 1992 to 2001). Mitteilungen Klosterneuburg 62(4): 143-153.
- Vidal S, Francis L, Noble A, Kwiatkowski M, Cheynier V, et al. (2004) Analysis of wine phenolic compounds. Analytica Chimica Acta 513(1): 57-65.
- Frankel EN, Kanner J, German JB, Parks E, Kinsella JE (1993) Inhibition of oxidation of human low-density lipoprotein by phenolic compounds in red wine. Lancet 341(8843): 454-457.
- The Morava (Moravia) Wine Region (2023) Wines from Moravia, wines from Bohemia: Your guide to the world of Moravian and Bohemian wines. Vína z Moravy, vína z Č
- Antoš O (2006) Evaluation of the course of meteorological phenomena in the decade of 1993-2002 in relation to vine growing in the Southern Moravia (the Czech Republic). Geographica: Acta Universitatis Palackianae Olomucensis 39: 7-17.
- Bzenec wine region (2023) Town of Bzenec. Bzenec wine region. Town of Bzenec.
- Lapčíková B, Lapčík L, Hupková J (2017) Physico-chemical characterization of Slovak wines. Potravinarstvo Slov J Food Sci 11(1): 216-222.
- Blauer Portugieser: Basic characteristics of wine. Wines from Moravia and wines from Bohemia (2004). Vína z Moravy a vína z Č
- Aleixandre-Tudo J, Buica A, Nieuwoudt H, Aleixandre J, du Toit W (2017) Spectrophotometric Analysis of Phenolic Compounds in Grapes and Wines. J Agric Food Chem 65(20): 4009-4026.
- Balik J (2004) Winemaking: Instructions for laboratory exercises. Mendel University in Brno, Brno, Czech Republic pp. 1-100.
- International Organization of Vine and Wine (2022) Compendium of International Methods of Analysis of Wines and Musts. International Organization of Vine and Wine.
- Fan S, Liu C, Li Y, Zhang Y (2023) Visual Representation of Red Wine Color: Methodology, Comparison and Applications. Foods 12(5): 924.
- Zheng R, Ren T, Niu C, Zheng F, Wang J, et al. (2022) Anthocyanins composition and antioxidant activity of purple rice and color degradation under sunlight exposure of purple rice wine. J Food Meas Charact 16(6): 1889-1900.
- Mestek O (2010) Inductively coupled plasma mass spectrometry: Working text for the JOSEF Underground Training Centre.
- Steidl R (2010) Cellar management. National Wine Centre, Valtice pp. 24-33.
- Pavloušek P (2010) Manufacturing of Wine by Small Winemakers. Grada Publishing, Prague pp. 53-56.
- Pavloušek P, Burešová P (2015) Everything You Should Know About Wine: And Have No One to Ask. Grada Publishing, Prague pp. 101-106.
- Aleixandre-Tudo JL, Nieuwoudt H, Aleixandre JL, du Toit W (2018) Chemometric compositional analysis of phenolic compounds in fermenting samples and wines using different infrared spectroscopy techniques. Talanta 176(1): 526-536.
- Scano P (2021) Characterization of the medium infrared spectra of polyphenols of red and white wines by integrating FT IR and UV-Vis spectral data. LWT 147: 111604.
- Castillo-Muñoz N, Gómez-Alonso S, García-Romero E, Hermosín-Gutiérrez I (2007) Flavonol Profiles of Vitis vinifera Red Grapes and Their Single-Cultivar Wines. J Agric Food Chem 55(3): 992-1002.
- Sanna R, Piras C, Marincola F, Lecca V, Maurichi S et al. (2014) Multivariate statistical analysis of the UV-Vis profiles of wine polyphenolic extracts during vinification. J Agric Sci 6(12): 152.
- Stávek J, Papouskova B, Balik J, Bednar P (2012) Effect of Storage Conditions on Various Parameters of Colour and the Anthocyanin Profile of Rosé Int J Food Prop 15(6): 1133-1147.
- Sacchi K, Bisson L, Adams D (2005) A review of the effect of winemaking techniques on phenolic extraction in red wines. Am J Enol Vitic 56(3): 197-206.
- Gindri R, Pauletto R, Franco F, Fortes J, Treptow T, et al. (2022) Grape UV-C irradiation in the postharvest period as a tool to improve sensorial quality and anthocyanin profile in ‘Cabernet Sauvignon’ wine. J Food Sci Technol 59(5): 1801-1811.
- Jiang Y, Guo Y (2021) Genesis and influencing factors of the colour of chrysoprase. Sci Rep 11(1): 9939.
- Dumitriu GD, Teodosiu C, Morosanu I, Plavan O, Gabur I, et al. (2021) Heavy metals assessment in the major stages of winemaking: Chemometric analysis and impacts on human health and environment. J Food Compos Anal 100: 103935.
- Starr M, Francis F (1973) Effect of metallic ions on color and pigment content of cranberry juice cocktail. J Food Sci 38(6): 1043-1046.
- Soto Vázquez E, Rio Segade S, Fernández Gomez E (2013) Incidence of the winemaking technique on metal content and phenolic composition of red wines. Int J Food Prop 16(3): 622-633.
- Grindlay G, Mora J, Gras L, de Loos-Vollebregt M (2011) Atomic spectrometry methods for wine analysis: A critical evaluation and discussion of recent applications. Anal Chim Acta 691(1-2): 18-32.
- Stroh A, Brucker P (1994) Multielement analysis of the wine samples using ICP-MS. Atomic Spectroscopy 15: 100-106.
- Cabrera-Vique C, Teissedre P, Cabanis M, Cabanis J (2000) Manganese Determination in Grapes and Wines from Different Regions of France. Am J Enol Vitic 51(2): 103-107.
- Kraus V (1999) Vine and Wine in Bohemia and Moravia. Radix, Prague pp. 231-236.
- Bora F, Donici A, Postolache E, Ciubuca A, Enache V, et al. (2017) Metal Concentrations of Red Wines in Southeast Romania. Bull Univ Agric Sci Vet Med Cluj-Napoca 74(2): 129-136.


