


Abstract
The study employs an integrative approach combining Additive Main Effects and Multiplicative Interaction (AMMI), Genotype and Genotype × Environment Interaction (GGE) biplot, and heatmap clustering to evaluate the stability and adaptability of 173 F7 wheat genotypes alongside four check cultivars across four diverse environments in Iran (Karaj, Zarghan, Kermanshah, and Mashhad). Results revealed significant environmental effects on grain yield, with Zarghan exhibiting the highest mean yield (8.302 kg/m²) and Kermanshah showing the broadest yield range (0.931-9.309 kg/m²), indicative of substantial environmental stress. Multivariate analyses identified Bamdad, Line 141, and Line 45 as the most promising genotypes, demonstrating high yield and stability across environments. The AMMI biplot highlighted Zarghan and Kermanshah as key discriminative environments, while the GGE biplot delineated these locations into distinct mega-environments, underscoring the need for region-specific breeding strategies. Hierarchical clustering further classified genotypes into high-yielding and stable (e.g., Bamdad), moderate-yielding with environment-specific adaptation (e.g., Line 64), and low-yielding and unstable (e.g., Line 128) groups. The study underscores the efficacy of integrating multivariate models for robust genotype evaluation, aligning with modern breeding paradigms that prioritize multi-environment stability analysis. These findings provide actionable insights for cultivar recommendation and breeding program optimization, particularly in regions facing climatic unpredictability. The methodologies and results presented herein advance the precision of genotype selection, offering a scalable framework for enhancing wheat productivity under altered environmental conditions.
Keywords:Multi-Environment Stability; Stability Models; CIMMYT Wheat Breeding; Heatmap-Clustering.
Abbreviations:AMMI: Additive Main Effects and Multiplicative Interaction, GGE: Genotype and Genotype × Environment Interaction, METs: Multi-Environment Trials, AREEO: Agricultural Research, Education, and Extension Organization, DAP: Diammonium Phosphate, FC: Field Capacity, AEC: Average-Environment Coordination
Introduction
Wheat (Triticum aestivum L.) stands as one of the most vital cereal crops globally, serving as a staple food for over 35% of the world’s population and contributing approximately 20% of the total dietary calories and protein (FAO, 2023). As of 2023, global wheat cultivation spans an estimated 220 million hectares, with Asia accounting for nearly 45% of this production area (USDA, 2023). In Iran, wheat is a critical crop, covering more than 6 million hectares of agricultural land and playing a fundamental role in ensuring national food security [1]. Given that a significant portion of Iran’s wheat-growing regions are situated in areas with harsh or alternative conditions, cultivars are essential to sustain productivity under increasingly unpredictable climatic conditions [2]. Despite its agricultural importance, bread wheat exhibits a considerable yield gap, with average yields of 1.0 and 3.0 tons per hectare under rain-fed and irrigated systems, respectively, during the 2022/23 growing season, far below the attainable yield potential of up to 5 tons per hectare (AGROSTAT, 2023). This disparity can be attributed to multiple factors, including the lack of genetically superior, stress-resilient varieties capable of withstanding biotic pressures (e.g., rust diseases, pests) and abiotic challenges (e.g., drought, salinity, heat) [3-7]. Consequently, breeding high-yielding, climate-resilient wheat genotypes remains a top priority to bridge this yield gap and ensure stable production across diverse agroecological zones [1]. A critical step in modern wheat breeding programs is the rigorous evaluation of genotypes through Multi-Environment Trials (METs), which assess performance under varying climatic and soil conditions (Braun et al., 2021) [8,9]. METs facilitate the identification of superior genotypes with broad adaptability and stability, traits essential for sustainable wheat production (Crossa et al., 2020).
Researchers employ stability indices to refine further genotype selection, categorized into univariate (parametric and non-parametric) and multivariate methods. Parametric indices, such as the coefficient of variation (CV) and regression coefficients [3,10], alongside non-parametric rank-based approaches, provide valuable insights into genotype performance. Meanwhile, advanced multivariate techniques, including Additive Main Effects and Multiplicative Interaction (AMMI) and Genotype and Genotype × Environment Interaction (GGE) biplot analysis, have proven highly effective in dissecting genotype-environment interactions [1,8]. Recent studies underscore the advantages of integrating multiple stability indices for robust genotype assessment. For example, [1] demonstrated that GGE biplot analysis is particularly effective in identifying stable triticale genotypes. However, research systematically combining univariate approaches for the stability of the plants remains scarce [11]. Emerging evidence suggests that an integrated stability analysis framework significantly enhances the precision of selecting stress-adapted genotypes, offering breeders a powerful tool to develop climate-resilient cultivars [12]. This study seeks to revolutionize wheat breeding strategies by employing a novel, integrative approach combining multivariate stability indices to evaluate wheat genotypes under diverse environmental conditions. Unlike conventional methods relying on single-index assessments, our methodology leverages a composite scoring system to identify genotypes exhibiting both high yield potential and exceptional stability across different environments. This study also serves as a pioneering reference for plant breeders, offering innovative methodologies to improve selection efficiency in breeding programs.
Materials and Methods
Experiment, genetic materials, and measurement
The study evaluated 173 F7 wheat lines alongside four
check cultivars (Amin, Danesh, Bamdad, and Sepehr) of bread
wheat (Triticum aestivum L.), newly released by the Agricultural
Research, Education, and Extension Organization (AREEO), Iran.
The experiments were conducted across four geographically
distinct regions-Karaj, Zarghan, Kermanshah, and Mashhadduring
the 2021-2022 growing season. The experimental layout
followed an Augmented Design, with check cultivars replicated
four times and interspersed among test genotypes. The genetic
materials comprised (Supplementary Table 1):
a. Advanced breeding lines (F6-derived F7) developed
at AREEO through crosses between elite Iranian cultivars and
international varieties.
b. CIMMYT-sourced genotypes from the SAWIT and SAWSN
populations, previously selected for their stability under rainfed
conditions.
Related to agronomic practices, irrigation was applied at 75- 80% of field capacity (FC) at all sites. Regarding the fertilization, 75 kg/ha urea + 50 kg/ha diammonium phosphate (DAP) at sowing as a basal application and 100 kg/ha urea + 50 kg/ha DAP at stem elongation as Top-dressing. For measuring the final grain yield, entire plots were harvested, and grain yield (kg/6 m²) was recorded and converted to yield per m² for statistical analysis.
Statistical Analysis
Combined ANOVA: Check cultivars were analyzed using
a combined linear model, with residuals generating mean
squares for error estimation. Augmented design adjustments
enabled genotype comparisons via the replicated checks’ error
term. The multivariate stability methods were calculated using
a novel R-language script developed by the authors (validated
against manual calculations and prior datasets). The script,
publicly available on [GitHub](https://github.com/ArminSaed/
PBTolindex). The multivariate indices used in this study are
available in the packages that the authors write are as follows:
a. Additive Main Effects and Multiplicative Interaction
(AMMI) Model:
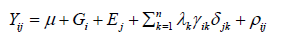
Yij is the observed yield of genotype i in environment j.
μ is the grand mean of all genotypes in all environments.
Gi is the genotype i effect.
Ej is the environment j effect.
λk is the singular value for principal component k.
γik is the genotype i score for principal component k.
δjk is the environment j score for principal component k.
ρij is the residual term.
b. Genotype and Genotype × Environment Interaction (GGE) Biplot:
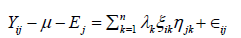
Yij is the Performance of genotype i in environment j.
μ is the grand mean.
Ej is the environment j effect.
λk is the singular value for the principal component k.
ξ is the eigenvector of genotype i for principal component k.
ηjk is the eigenvector of environment j for principal
component k.
∈ij is the residual associated with genotype i in environment
j.
Results
The evaluation of 173 wheat genotypes, alongside four check cultivars (Amin, Danesh, Bamdad, and Sepehr), across four diverse environments (Karaj, Kermanshah, Mashhad, and Zarghan) revealed significant variation in grain yield performance. The highest mean grain yield was recorded in Zarghan (8.302 kg/ m²), followed by Kermanshah (5.906 kg/m²), Mashhad (5.533 kg/m²), and Karaj (4.322 kg/m²). The broadest yield range was observed in Kermanshah (0.931-9.309 kg/m²), indicating substantial environmental stress, whereas Zarghan exhibited the least variability (4.029-10.98 kg/m²). The standard deviation was highest in Kermanshah (1.516), reflecting greater environmental heterogeneity compared to other locations. The boxplot and histogram analysis (Figure 1) further confirmed these trends, with Zarghan and Kermanshah showing higher median yields but greater dispersion, while Karaj and Mashhad displayed more symmetric distributions. From the supplemental yield data (Supplementary Table 2), several high-performing genotypes were identified. In Karaj, Line 141 (5.94 kg/m²) and Line 135 (5.78 kg/m²) outperformed the check cultivar Bamdad (5.60 kg/ m²). Kermanshah exhibited extreme yield variation, with Line 45 (9.25 kg/m²) and Line 157 (9.31 kg/m²) showing exceptional performance under stress conditions. Mashhad’s highest yield was recorded for Line 64 (11.04 kg/m²), followed by Line 66 (10.75 kg/m²), while Zarghan’s top performers included Line 7 (10.29 kg/m²) and Line 59 (10.35 kg/m²). The check cultivar Bamdad demonstrated consistently high yield across multiple locations, suggesting broad adaptability.

AMMI Model Analysis of Genotype × Environment Interaction
The Additive Main Effects and Multiplicative Interaction (AMMI) model was employed to dissect the genotype × environment (G×E) interaction, a critical aspect of stability analysis in multi-environment trials (Gauch et al., 2008). The combined ANOVA (Table 2) revealed that environmental effects were highly significant (p < 0.001), accounting for the largest portion of yield variation, whereas genotype and G×E interaction effects were non-significant. This suggests that while environmental differences were the primary drivers of yield variability, certain genotypes exhibited stable performance across diverse conditions. The AMMI biplot (Figure 2) displayed the first two principal components (PC1 and PC2), which captured a substantial portion of the G×E interaction variance. Genotypes positioned near the origin, such as Amin and Danesh, exhibited minimal interaction with environments, indicating stability. In contrast, genotypes like Line 45 and Line 7 were located toward specific environments (Kermanshah and Zarghan, respectively), demonstrating adaptive specificity. The biplot also revealed that Zarghan and Kermanshah were the most discriminating environments, exerting strong influence on G×E interactions, whereas Karaj and Mashhad had less pronounced effects.


GGE Biplot Analysis for Genotype Evaluation and Mega- Environment Identification
The polygon view of the biplot (Figure 3) divided genotypes into sectors, with the highest-yielding genotype in each sector representing the “winning” genotype for the associated environments. Bamdad and Line 141 were located at the vertices of the polygon, indicating their superior performance in multiple environments. Zarghan and Kermanshah fell into distinct sectors, confirming their contrasting growing conditions. The averageenvironment coordination (AEC) view revealed that Bamdad and Line 141 were closest to the “ideal genotype” position (Figure 3), combining high yield and stability. In contrast, genotypes like Line 128 and Line 83 were far from the ideal, exhibiting poor adaptability. The GGE biplot also facilitated the identification of mega-environment groups of locations where genotypes perform similarly. Zarghan and Kermanshah formed separate mega-environments, suggesting that different genotypes should be selected for each. Karaj and Mashhad clustered together, indicating that genotypes performing well in one location would likely perform well in the other. This finding aligns with recent research (Yan, 2021), which highlights the utility of GGE biplots in optimizing breeding strategies for target environments.

Heatmap and Hierarchical Clustering of Genotypes and Environments
To further elucidate the relationships between genotypes and environments, a heatmap with hierarchical clustering was constructed (Figure 4). The high-yield and stable genotypes group included Bamdad, Line 141, and Line 45, which exhibited consistently high yields across all environments. Their stability makes them prime candidates for commercial release. Moderateyielding with Environment-Specific Adaptation group covered the genotypes, such as line 101 and Line 64 performed well in certain locations (e.g., Mashhad and Zarghan) but showed variability in others. These may be suitable for region-specific cultivation. Low- Yielding and Unstable genotypes included lines such as 128 and 83 had poor performance across most environments, indicating limited breeding value.

Discussion
The evaluation of 173 wheat genotypes across four diverse environments provided critical insights into genotype × environment interactions (GEI) and stability performance, which are fundamental considerations in modern wheat breeding programs [13]. The substantial yield variation observed across locations, particularly in Kermanshah (0.93-9.31 kg/m²), aligns with previous studies demonstrating that arid and semi-arid regions impose strong selective pressures on crop performance [14]. The superior mean yield in Zarghan (8.30 kg/m²) suggests this environment may represent optimal growing conditions, while Kermanshah’s high variability reflects the challenges of regions with alternative weather conditions, consistent with findings by Semahegn et al. [15] in similar wheat-growing areas. The identification of high-yielding genotypes such as Bamdad, Line 141, and Line 45 across multiple locations supports the growing emphasis on selecting broadly adapted cultivars in wheat breeding. These results corroborate earlier research indicating that elite genotypes often exhibit both high yield potential and stability under diverse conditions [16]. The stability of check cultivar Bamdad is particularly noteworthy, as it mirrors observations in other studies where commercial cultivars maintain performance across variable environments due to extensive prior selection [1].
The AMMI analysis effectively partitioned GEI, revealing that environmental effects dominated yield variation, a common observation in multi-environment trials [8]. The non-significant genotype and GEI effects suggest that while environmental differences were primary, certain genotypes still demonstrated consistent performance, similar to findings by de Bem Oliveira et al. [17] in wheat stability studies. The biplot visualization highlighted genotypes like Amin and Danesh near the origin, indicating stability, a result consistent with the work of Ali [18], who noted that central positioning in AMMI biplots often correlates with broad adaptability. The strong discrimination of Zarghan and Kermanshah in the AMMI biplot aligns with research by Rahmati et al. [19], who found that high-yielding and stressprone environments often exert the most significant GEI effects. The adaptive specificity of genotypes such as Line 45 (high yield in Kermanshah) suggests potential for targeted breeding in stress environments, a strategy supported by Barati et al. [20] in drought-resilient wheat selection. The stability of Bamdad across environments reinforces the utility of AMMI in identifying genotypes with reliable performance, as previously demonstrated BY Saed-Moucheshi et al. [1]. Recent studies [21, 22] have emphasized that AMMI biplots effectively identify genotypes with either broad or specific adaptability. In this study, Bamdad and Line 141 were positioned near the center of the biplot, indicating consistent performance across all environments, making them ideal candidates for cultivar release.
Conversely, genotypes with large PC1 or PC2 scores, such as
Line 128, exhibited high instability, performing poorly in certain
environments. The Genotype plus Genotype × Environment
(GGE) biplot analysis, a widely used tool in plant breeding [23],
was applied to further assess genotype stability and megaenvironment
classification. The GGE biplot (Figure 3) consisted of
two key components:
1. Which-Won-Where Pattern: The polygon view of the
biplot divided genotypes into sectors, with the highest-yielding
genotype in each sector representing the “winning” genotype
for the associated environments. Bamdad and Line 141 were
located at the vertices of the polygon, indicating their superior
performance in multiple environments. Zarghan and Kermanshah
fell into distinct sectors, confirming their contrasting growing
conditions.
2. Mean vs. Stability Analysis: The average-environment
coordination (AEC) view revealed that Bamdad and Line 141 were
closest to the “ideal genotype” position, combining high yield and
stability. In contrast, genotypes like Line 128 and Line 83 were far
from ideal, exhibiting poor adaptability.
The GGE biplot analysis provided further clarity on genotype performance and environmental grouping, a methodology widely validated in plant breeding [24]. The “Which-Won-Where” pattern confirmed Bamdad and Line 141 as top performers, consistent with the findings of Jeberson et al. [25], who emphasized that vertex genotypes in GGE biplots often represent ideal candidates for cultivar release. The separation of Zarghan and Kermanshah into distinct mega-environments supports the concept of regional adaptation in wheat breeding, as discussed by Al- Ashkar et al. [26] in CIMMYT’s international testing networks. The AEC view of the GGE biplot reinforced Bamdad’s status as an “ideal genotype,” a conclusion paralleling Mahdavian et al. [27] observations that genotypes near the ideal position exhibit both high yield and stability. The poor performance of Line 128 in stress environments underscores the challenges of breeding for marginal areas, a phenomenon documented by Mohammadi et al. [28] in drought-affected wheat systems. The clustering of Karaj and Mashhad suggests that these environments may share key growing conditions, allowing for consolidated testing, a strategy advocated by Amiri et al. [29] to optimize breeding efficiency. The environmental clustering reinforced previous findings, with Zarghan and Kermanshah forming distinct groups due to their contrasting conditions, while Karaj and Mashhad exhibited similarity. This clustering approach, supported by recent studies [25], provides a robust method for visualizing complex G×E interactions and guiding genotype selection.
To further elucidate the relationships between genotypes
and environments, a heatmap with hierarchical clustering was
constructed. The analysis revealed three major genotype clusters:
1. High-Yielding and Stable Genotypes: This group
included Bamdad, Line 141, and Line 45, which exhibited
consistently high yields across all environments. Their stability
makes them prime candidates for commercial release.
2. Moderate-Yielding with Environment-Specific
Adaptation: Genotypes such as Line 101 and Line 64 performed
well in certain locations (e.g., Mashhad and Zarghan) but showed
variability in others. These may be suitable for region-specific
cultivation.
3. Low-Yielding and Unstable Genotypes: Lines such as
128 and 83 had poor performance across most environments,
indicating limited breeding value.
The hierarchical clustering of genotypes and environments provided a complementary perspective to the AMMI and GGE analyses, a multi-method approach endorsed by (2023). The high-yielding, stable cluster (Bamdad, Line 141) mirrors findings by Amiri et al. [29], who identified similar elite genotype groups in durum wheat trials. The environment-specific adaptation of genotypes like Line 101 aligns with research by Rahmati et al. [19], which highlighted the importance of balancing broad and specific adaptation in breeding programs. The clear separation of low-yielding genotypes (e.g., Line 83) further validates the heatmap’s utility in culling unstable lines early in selection, a practice emphasized by Saed-Moucheshi et al. [1].
Conclusion
The integrated stability analysis underscores the necessity of multi-environment testing in wheat breeding, as GEI remains a major challenge in cultivar development. The success of Bamdad and Line 141 suggests that combining yield potential with stability should remain a priority. However, the adaptive superiority of Line 45 in Kermanshah highlights the value of developing niche cultivars for stress environments, a strategy gaining traction in climate-smart breeding. This study demonstrates the critical role of multi-environment trials (METs) and multivariate stability models in identifying high-yielding, stable wheat genotypes tailored to diverse agroecological conditions. The integration of AMMI, GGE, and heatmap clustering provided a comprehensive assessment of genotype-environment interactions, revealing Bamdad, Line 141, and Line 45 as elite genotypes with broad adaptability and resilience. Zarghan and Kermanshah emerged as pivotal testing environments, facilitating the selection of stress-tolerant and high-yielding cultivars, respectively. The findings advocate for a balanced breeding strategy that combines broad adaptation with niche-specific targeting, particularly for marginal environments. Future research should explore the genetic and physiological underpinnings of stability in topperforming genotypes, leveraging genomic tools to accelerate breeding progress. This work not only bridges the gap between theoretical stability analysis and practical breeding but also sets a precedent for data-driven, climate-resilient crop improvement. By adopting these integrative approaches, breeders can enhance selection efficiency, ensuring sustainable wheat production in the face of escalating climatic challenges. Future studies could explore the physiological and genetic basis of stability in topperforming genotypes, leveraging genomic tools. Additionally, expanding testing to more extreme environments could further refine selection. The methodologies applied here -AMMI, GGE, and clustering -provide a robust framework for such efforts, aligning with global trends in data-driven breeding.


References
- Saed-mouche Shi A, Babaei S, Ansarshourijeh F (2024) Innovative multi-trial breeding and genotype screening in triticale (x Triticosecale Witt Mack) for enhanced stability under drought stress. Scientific Reports 14: 28273.
- Saed-mouche Shi A, Pessarakli M, Heidari B (2013a) Comparing relationships among yield and its related traits in mycorrhizal and nonmycorrhizal inoculated wheat cultivars under different water regimes using multivariate statistics. International J of Agronomy.
- Aliakbari M, Saed-Mouche Shi A, Hasheminasab H, Pirasteh-Anosheh H, Asad M T, et al. (2013) Suitable stress indices for screening resistant wheat genotypes under water deficit conditions. International J of Agronomy Plant Production 4: 2665-2672.
- Riasat M, Kiani S, Saed-Mouchehsi A, Pessarakli M (2019) Oxidant related biochemical traits are significant indices in triticale grain yield under drought stress condition. J of Plant Nutrition 42: 111-126.
- Saed-Moucheshi A (2018) Evaluation of morphological, physiological, and moleculare characteristics of triticale genotypes under drought stress condition, Shiraz University, Shiraz.
- Saed-mouche Shi A, Pessarakli M, Heidari B (2013b) Comparing Relationships among Yield and Its Related Traits in Mycorrhizal and Nonmycorrhizal Inoculated Wheat Cultivars under Different Water Regimes Using Multivariate Statistics.
- Tabarzad A, Ayoubi B, Riasat M, Saed-mouche Shi A, Pessarakli M (2017) Perusing biochemical antioxidant enzymes as selection criteria under drought stress in wheat varieties. J of Plant Nutrition 40: 2413-2420.
- Saed-mouche Shi A, Mozafari AA, Pessarakli M, Rezaei Mirghaed E, Sohrabi F, et al. (2023) Improved strategy of screening tolerant genotypes in drought stress based on a new program in R-language: a practical triticale breeding program. J of Plant Nutrition 46: 495-512.
- Saed-mouche Shi A, Sohrabi F, Fasih far E, Banias Adi F, Riasat M, et al. (2021) Superoxide dismutase (SOD) as a selection criterion for triticale grain yield under drought stress: a comprehensive study on genomics and expression profiling, bioinformatics, heritability, and phenotypic variability. BMC plant biology 21: 148.
- Saed-mouche Shi A, Pessarakli M, Mikhak A, Ostovar P, Ahamadi-Niaz A (2017) Investigative approaches associated with plausible chemical and biochemical markers for screening wheat genotypes under salinity stress. J of Plant Nutrition 40: 2768-2784.
- de Jong AW, Boden S, Zan Dijk A, Kortsinoglou AM, Gerrits van den Ende B, et al. (2024) Fungal pathogens exposed-genomic and phenotypic insights into Candida auris and its relatives of the Candida haemulonii species complex.
- Mohammadi R, Sadeghzadeh B, Ahmadi H, Bahrami N, Amri A (2015) Field evaluation of durum wheat landraces for prevailing abiotic and biotic stresses in highland rainfed regions of Iran. The Crop J 3(5): 423-433.
- Bapela T, Shimelis H, Tsilo TJ, Mathew I (2022) Genetic improvement of wheat for drought tolerance: Progress, challenges and opportunities. Plants 11(10): 1331.
- Mondal S, Singh R, Mason E, Huerta-Espino J, Autrique E, Joshi A (2016) Grain yield, adaptation and progress in breeding for early-maturing and heat-tolerant wheat lines in South Asia. Field Crops Research 192: 78-85.
- Semahegn Y, Shimelis H, Laing M, Mathew I (2021) Genetic variability and association of yield and yield components among bread wheat genotypes under drought-stressed conditions. Australian J of Crop Science 15: 863-870.
- Riasat M, Saed-Mouchehsi A, Jafari AA (2020) Effect of Drought Stress Levels on Seedling Morpho-physiological Traits of Alfalfa (Medicago sativa) Populations grown in Glasshouse. J of Rangeland Science 10: 86-97.
- de Bem Oliveira I, Amadeu RR, Ferrão LFV, Muñoz PR (2020) Optimizing whole-genomic prediction for autotetraploid blueberry breeding. Heredity 125: 437-448.
- Ali GM (2000) "Genetics and physiological basis of salinity tolerance in pearl millet (Pennisetum americanum L.)," The University of Liverpool (United Kingdom).
- Rahmati S, Azizi-Nezhad R, Pour-Aboughadareh A, Etminan A, Shooshtari L (2024) Analysis of genotype-by-environment interaction effect in barley genotypes using AMMI and GGE biplot methods. Heliyon 10(18): e38131.
- Barati A, Pour-Aboughadareh A, Arazmjoo E, Tabatabaei SA, Bocianowski J, et al. (2025) Identification of High Yielding and Stable Barley Genotypes for Drought Conditions in the Moderate Climate of Iran Using AMMI Model and GGE Biplot Analysis. J of Crop Health 77: 1-13.
- Khan MMH, Rafii MY, Ramlee SI, Jusoh M, Al Mamun M (2021) AMMI and GGE biplot analysis for yield performance and stability assessment of selected Bambara groundnut (Vigna subterranea L. Verdc.) genotypes under the multi-environmental trials (METs). Scientific reports 11: 22791.
- Wang R, Wang H, Huang S, Zhao Y, Chen E, et al. (2023) Assessment of yield performances for grain sorghum varieties by AMMI and GGE biplot analyses. Frontiers in Plant Science 14: 1261323.
- Bilate Daemo B, Belew Yohannes D, Mulu Alem Beyene T, Gebreselassie Abtew W (2023) AMMI and GGE Biplot analyses for mega environment identification and selection of some high‐yielding cassava genotypes for multiple environments. International J of Agronomy 2023: 6759698.
- Lin Y, Dang X, Hu X, Li Y, Liu S (2025) Stability and Adaptability of Sugar Beet Examined Based on AMMI and BLUP-GGE Biplot Analyses. Sugar Tech pp. 1-11.
- Jeberson M, Kant L, Kishore N, Rana V, Walia D, et al. (2017) AMMI and GGE biplot analysis of yield stability and adaptability of elite genotypes of bread wheat (Triticum aestivum L.) for Northern Hill Zone of India. International J of Bio-resource Stress Management 8: 635-641.
- Al-Ashkar I, Sallam M, Al-Suhaib ani N, Ibrahim A, Alsadon A, et al. (2022) Multiple stresses of wheat in the detection of traits and genotypes of high-performance and stability for a complex interplay of environment and genotypes. Agronomy 12: 2252.
- Mahdavian S, Zarei L, Cheghamirza K, Bahraminejad SJ (2024) Investigating the agro-morphological traits variation of wild Einkorn wheat ancestors collected from the western rangelands of Iran. Iranian J of Rangelands, Forests, Plant Breeding and Genetic Research 31: 305-321.
- Mohammadi R, Roustai M, Haghparast R, Roohi E, Solimani K, et al. (2010) Genotype× environment interactions for grain yield in rainfed winter wheat multi‐environment trials in iran. Agronomy J 102: 1500-1510.
- Amiri R, Sas ani S, Jalali-Hon Armand S, Rezaei A, Seifolahpour B, et al. (2018) Genetic diversity of bread wheat genotypes in Iran for some nutritional value and baking quality traits. Physiology and Molecular Biology of Plants 24: 147-157.


