Applying Unmanned Aircraft System (UAS) to Detect Grapevine Red Blotch Virus in an Oregon Vineyard
Michael G Wing*, Matt Barker and Jon Burnett
*Forest Engineering and Resource Management Department, Oregon State University, Corvallis, USA
Submission: December 10, 2021;Published: January 05, 2022
*Corresponding author: Forest Engineering and Resource Management Department, Oregon State University, Corvallis, USA
How to cite this article: Michael G W, Matt B, Jon B. Applying Unmanned Aircraft System (UAS) to Detect Grapevine Red Blotch Virus in an Oregon Vineyard. JOJ Hortic Arboric. 2022; 3(3): 555612. D. DOI 10.19080/JOJHA.2022.03.555612.
Abstract
Grapevine red blotch virus (GRBV) and five leafroll-associated viruses (GLRaV) threaten vineyards throughout Oregon and California (U.S.) and beyond. We used an unmanned aircraft system (UAS) coupled with visible and near-infrared sensors to determine whether the Transformed Chlorophyll Absorption in Reflectance Index/Optimized Soil Adjusted Vegetation Index (TCARI/OSAVI) was correlated with GRBV presence in an Oregon vineyard. We found evidence that suggests the estimation of GRBV infection presence and severity (i.e., ratio) at the row-level may be possible if other biotic, abiotic, and environmental factors that influence chlorophyll content do not confound the change assessment (e.g., drought, defoliation, insects’ outbreak, etc.).
Keywords: UAS; Red Blotch; Vineyard; Near-Infrared; Pre-Visual Detection
Abbreviations: GRBV: Grapevine Red Blotch Virus; UAS: Unmanned Aircraft System; TCARI: Transformed Chlorophyll Absorption in Reflectance Index; OSAVI: Optimized Soil Adjusted Vegetation Index; GLRaV: Five Leafroll-Associated Viruses; PCR: Polymerase Chain Reaction
Introduction
Grapevine red blotch virus (GRBV) and five leafroll-associated viruses (GLRaV) threaten vineyards throughout Oregon and California (U.S.). A study conducted in Northern California estimated the economic cost associated with GLRaV on Cabernet Sauvignon vines to range from about $29,902 to $226,405 per ha. Ricketts et al. [1]. Management strategies currently consist of removal of infected plants and replanting with stock tested to be virus-free, spraying insecticide to control vectors, or doing nothing with resulting lighter yield and lower quality grapes Almeida et al. [2]. Insects are believed to be vectors for both viruses. Mealybugs Pseudococcidae and soft scales Coccidae are the vectors associated with GLRaV and the three cornered alfalafa hopper Spissistilus festinus is a likely vector for GRBV Golino et al. [3], Bahder et al. [4]. Detection of GRBV and GLRaV relies upon visual inspection to assess presence followed by polymerase chain reaction (PCR) testing as confirmation. This detection method is costly and time-consuming. Pre-visual detection would afford vineyard managers the opportunity to remove infected plants before the virus is transmitted to other stock in the vineyard. A detection algorithm would afford vintners the opportunity to assess infection likelihood across the entire vineyard and reduce dependence on costly PCR testing.
An imaging sensor sensitive to the near infrared (NIR) is likely to be a key component of any remote sensing method intent upon pre-visual detection of plant stress or viral infection that where symptoms appear in leaves. NIR is refers to a band of electromagnetic radiation with wavelengths between 700 to 1400 nm that is invisible to the human eye and saddled between a chlorophyll absorption band ending just below 700 nm and a water absorption band beginning at 1400 nm. In the NIR band healthy plants tend to reflect more of incoming NIR than unhealthy plants due to characteristics of chlorophyll in plant palisade cells that reflect NIR energy back into the atmosphere Slaton et al. [5]. This spectral feature of plant physiology is especially effective when paired with reflectance information from the red absorption band which is the basis for development of the normalized differenced vegetation index (NDVI) that is ubiquitous in forest remote sensing Tucker [6], and additionally the red edge, which is the miniscule region of NIR between peak red absorption and peak NIR reflectance has been shown relate to plant chlorophyll content Gitelson et al. [7].
NIR has been shown to be an effective discriminator of symptomatic and asymptomatic leaves in other broad-leaved plants Naidu et al. [8]; Sankaran et al. [9] and unmanned aircraft systems (UAS) equipped with NIR-capable sensors have been used to study vineyard vigor and health Turner et al. [10], Baluja et al. [11], Mathews and Jensen [12]. However, a method describing grapevine virus detection with UAS multispectral imagery is thus far absent from peer-reviewed research literature. A conceptually related study conducted by Mac Donald et al. [13] used a Classification and Regression Tree (CART) algorithm to detect leafroll virus in Cabernet Sauvignon vineyards with a 94% success rate. Detection with 0.25 to 0.50 m resolution imagery from a hyperspectral camera onboard a Cessna T182, while effective, is likely less cost effective for surveys of individual vineyards than a UAS equipped with a small multi-spectral camera. Furthermore, Mac Donald et al. [13] suggested that a UAS-mounted camera may improve detection accuracy due to the potential to collect higher resolution imagery. Near-infrared imagery have been used to capture symptomatic and asymptomatic leaves in other broadleaved plants Naidu et al. [8]; Sankaran et al. [9].
Remote sensing over grapevines offers an added challenge over continuous-canopy remote sensing in forests and orchards and that is the confounding influence of soil background on surface reflectance from 550 – 700 nm. Kim et al. [14] demonstrated the influence of nonphotosynthetic background materials like soil to this region of the electromagnetic spectrum. Haboudane et al. [15] modified the chlorophyll absorption index, MCARI Daughtry et al. [16] to develop: TCARI = 3[(R700-R670)-0.2(R700-R550) (R700/ R670)]. TCARI addresses background influence associated with MCARI. Haboudane et al. [15] then produced a ratio combining TCARI with the optimized soil-adjusted vegetation index OSAVI Rondeaux et al. [17] OSAVI = (1 + 0.16) (R800– R670) / (R800 + R670 +0.16). OSAVI is incorporated in the ratio to further reduce variation in spectral indices associated with soil backgrounds, and it is recommended for multitemporal studies that pertain to agricultural applications in the mid-latitudes. Our study expands upon Mac Donald et al. [13] with a more cost-accessible collection method and equipment that is capable of capturing visible and near-infrared imagery. Our objectives are to determine whether the Transformed Chlorophyll Absorption in Reflectance Index/ Optimized Soil Adjusted Vegetation Index (TCARI/OSAVI) was correlated with GRBV presence in an Oregon vineyard. If successful, our approach provides a means of pre-visual detection and phenotyping based on high resolution imagery. We also provide a template for expanding our methodology.
Materials and Methods
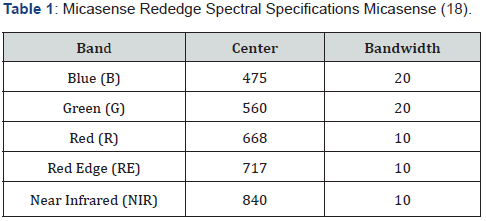
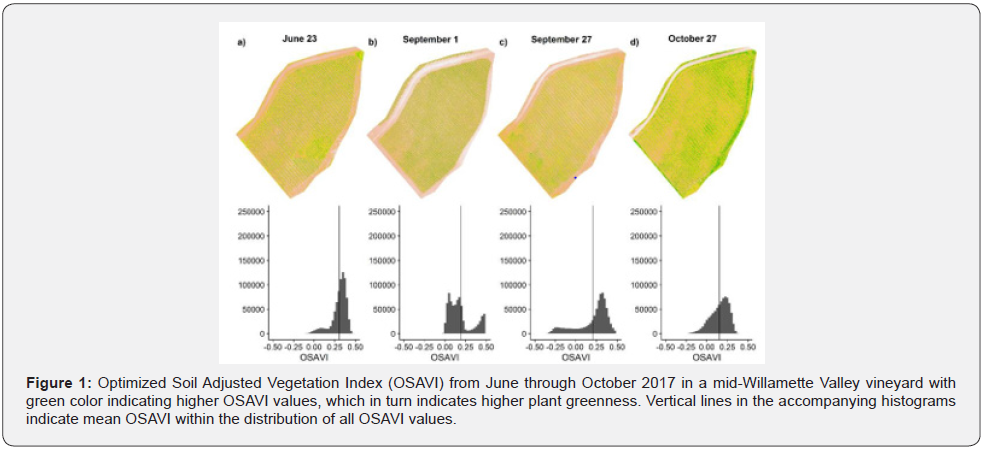
During the 2017 growing season, we investigated the detectability of GRBV in UAS imagery by deriving TCARI/OSAVI from multispectral imagery and comparing trends to PCR results in eight validation rows. We conducted UAS remote sensing flights over a mid- Willamette Valley vineyard exhibiting signs of GRBV on an approximately monthly basis throughout the 2017 growing season (June through October). We flew a relatively modest priced DJI Phantom 4 Pro quadcopter ($1500) equipped with a MicaSense [18] RedEdge multispectral camera ($5500). The RedEdge camera collects visible and near-infrared light that is reflected from a surface (e.g., vegetation). The sensor is capable of recording surface reflectance in five bands (Table 1). We examined the overall greenness in our test vineyard throughout the growing season. Plants in eight rows were subjected to PCR testing in late September 2017 to provide field validation of GRBV presence. The optimized soil adjusted vegetation index (OSAVI) was estimated for all surveys to ascertain how well the UAS multispectral data was capturing expected trends in overall greenness over time.

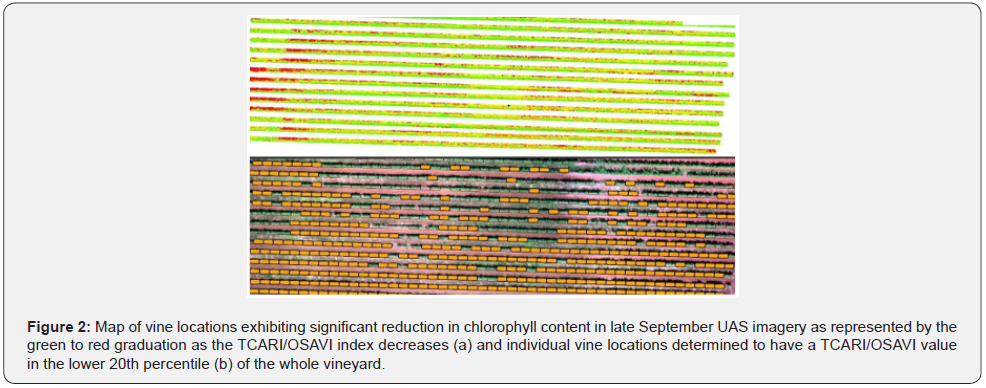
We assumed that OSAVI was an acceptable surrogate for greenness because it has been shown to be associated with both chlorophyll content and leaf area but is less heavily influenced by the mixing of non-vegetated pixels (e.g., soil) than the normalized difference vegetation index (NDVI) Steven [19]. Although relative greenness has been used for phenotyping and disease detection in agriculture, Patrick et al. [20] found that spectral indices that isolate the chlorophyll signature had the best correlations to foliar disease signs in tomato spot wilt. We evaluated chlorophyll status using the Transformed Chlorophyll Absorption in Reflectance Index/Optimized Soil Adjusted Vegetation Index (TCARI/OSAVI). TCARI/OSAVI was selected for evaluating the chlorophyll status of the vineyard in the late September survey because it has been shown to be strongly associated with chlorophyll concentration in leaves, is not as heavily confounded by leaf area as is NDVI Haboudane et al. [15] and has been used to detect stress in agricultural crops Berni et al. [21]. The late September survey was the focus of this analysis because it was the most temporally proximal to the PCR field testing.
We delineated vineyard rows from June imagery using spectral segmentation and manually sieving to ensure only vine pixels were extracted. We masked subsequent imagery using segmented rows as masking polygons. Vine polygons were segmented assuming an average inter-vine spacing of 1.8 meters and were implemented to aggregate pixels at vine level. Ratios of GRBV (# Plants Infected / # Plants Total) were estimated by row and compared to the ratio of vines exhibiting reduced chlorophyll content relative to the rest of the vineyard (# Plants Reduced Chlorophyll / # Plants Total). The threshold for assessing reduced chlorophyll content was conservatively established at the lower 20th percentile of the TCARI/OSAVI distribution for the test vineyard. Vine-level direct comparisons between the field survey and the UAS survey were not directly possible due to uncertainty of individual vine locations within the UAS imagery, resulting in a segmentation error of one to three vines per row. Our comparative results, however, should be representative of within row conditions.
Results
OSAVI temporal trends show a site-wide trend of reducing OSAVI as the growing season progresses, with continued decline in OSAVI in October (Figure 1). This trend agrees with deciduous plant phenology in temperate environments where chlorophyll content peaks following full leaf-flush, declines as the ratio between evaporative demand and soil water content increases, then declines less gradually as leaves senesce in response to reduced photoperiod. Ratios of GRBV per row were consistently higher than ratios of plants exhibiting spectral indications of low chlorophyll content (Table 2). The consistent bias between the PCR and UAS data is evidence that low chlorophyll content is associated with GRBV presence which is explained by the premature GRBVdriven chlorosis. This results in less chlorophyll in infected leaves when compared to healthy leaves. The variation between actual ratio magnitudes (Table 2) is likely the result of a combination of the following four factors: (1) the uncertainty of individual vine locations within UAS imagery, (2) phenotypic differences within row driving varying spectral responses to GRBV infection, (3) the subtlety of GRBV in white fruited grapevines such as these Bettiga [22], and (4) the possibility that TCARI/OSAVI alone is not sufficient for reliable GRBV detection. An examination of the trend in ratios across rows suggests a non-random correlation between field assessed (PCR tested) ratios of GRBV presence and UAS imagery assessment of chlorophyll content (TCARI/OSAVI) in the late September survey (Table 2; R2 = 0.59). The linear relationship is evidence that GRBV is associated with reduced chlorophyll content. The linear nature of the relationship and the consistent bias between UAS imagery and field-based ratio estimates of GRBV facilitates a relatively simple linear model (Figure 3) to predict GRBV ratio by row with UAS imagery (Table 2).


Discussion
Our results indicated a non-random relationship between UAS estimates of late September leaf chlorophyll content and GRBV presence (R2 = 0.59), although additional data is necessary at more vineyards to improve the method before broader inferences are possible. These results provide evidence to suggest that estimation of GRBV infection presence and severity (i.e., ratio) at the row-level may be possible if other biotic, abiotic, and environmental factors that influence chlorophyll content do not confound the change assessment (e.g., drought, defoliation, insects outbreak, etc.). However, additional investigation is necessary to understand the broad applicability of the simple linear correction beyond the data presented here [23]. A major limitation of our analysis was the uncertainty of individual PCR-tested vines within the UAS imagery. We plan to use high-precision GPS in the future to identify plant locations so that we can make plant-level comparisons within row. In addition, expanding field-validation methods to capture samples from the UAS-visible top third of the canopy would greatly improve correlations within and among rows. These two adjustments will also facilitate the development of a robust algorithm that detects grapevine virus signatures in UAS multispectral imagery, with the goal of developing a generalized stressor classification algorithm that is applicable to vineyards in western Oregon, and perhaps elsewhere [24].
Conclusion
We found evidence that suggests the estimation of GRBV infection presence and severity (i.e., ratio) at the row-level may be possible if other biotic, abiotic, and environmental factors that influence chlorophyll content do not confound the change assessment (e.g., drought, defoliation, insects’ outbreak, etc.). Our future work will seek to establish an open database of imagery containing discolored foliage with PCR- confirmed symptoms of GRBV and GLRaV as well as vines affected by other stress causal agents. This imagery will train the resulting grapevine virus detection algorithm and others in the future. As the database of imagery grows, the detection algorithm, so should the detection accuracy. GRBV and GLRaV are managed similarly, and thus distinction between viruses is unnecessary. A successful algorithm would be capable of classifying imagery by distinguishing viral symptoms from other leaf discoloring stressors. Ultimately, this will lead to an affordable decision support tool for vineyard managers to understand what is affecting their grapevines.
References
- Ricketts KD, Gomez MI, Atallah SS, Fuchs MF, Martinson TE, et al. (2015) Reducing the economic impact of grapevine leafroll disease in California: Identifying optimal disease management strategies. Am J Enol Vitic 66(2): 138-147.
- Almeida R, Daane K, Bell V, Blaisdell G, Cooper M, et al. (2013) Ecology and management of grapevine leafroll disease. Front Microbiol 4: 94.
- Golino DA, Sim ST, Gill R, Rowhani A (2002) California mealybugs can spread grapevine leafroll disease. California Agriculture 56(6): 196-201.
- Bahder BW, Zalom FG, Jayanth M, Sudarshana MR (2016) Phylogeny of geminivirus coat protein sequences and digital PCR aid in identifying Spissistilus festinus as a vector of grapevine red blotch-associated virus. Phytopathology 106(10): 1223-1230.
- Slaton MR, Raymond Hunt E, Smith WK (2001) Estimating near‐infrared leaf reflectance from leaf structural characteristics. Am J Bot 88(2): 278-284.
- Tucker CJ (1979) Red and photographic infrared linear combinations for monitoring vegetation. Remote sensing of Environment 8(2): 127-150.
- Gitelson AA, Merzlyak MN, Lichtenthaler HK (1996) Detection of red edge position and chlorophyll content by reflectance measurements near 700 nm. Journal of plant physiology 148(3-4): 501-508.
- Naidu RA, Perry EM, Pierce FJ, Mekuria T (200) The potential of spectral reflectance technique for the detection Grapevine leafroll-associated virus-3 in two red-berried wine grape cultivars. Computers and Electronics in Agriculture 66 (1): 38-45
- Sankaran S, Maja JM, Buchanon S, Ehsani R (2013) Huanglongbing (citrus greening) detection using visible, near infrared and thermal imaging techniques. Sensors (Basel) 13(2): 2117-2130.
- Turner D, Lucieer A, Watson C (2011) Development of an Unmanned Aerial Vehicle (UAV) for hyper resolution vineyard mapping based on visible, multispectral, and thermal imagery. In Proceedings of 34th International Symposium on Remote Sensing of Environment p. 4.
- Baluja J, Diago MP, Balda P, Zorer R, Meggio F, et al. (2012) Assessment of vineyard water status variability by thermal and multispectral imagery using an unmanned aerial vehicle (UAV). Irrigation Science 30(6): 511-522.
- Mathews AJ, Jensen JL (2013) Visualizing and Quantifying Vineyard Canopy LAI Using an Unmanned Aerial Vehicle (UAV) Collected High Density Structure from Motion Point Cloud. Remote Sensing 5(5): 2164-2183.
- Mac Donald SL, Staid M, Staid M, Cooper ML (2016) Remote hyperspectral imaging of grapevine leafroll-associated virus 3 in cabernet sauvignon vineyards. Comput Electron Agr 130: 109-117.
- Kim MS, Daughtry CST, Chapelle EW, McMurtrey JE, Walthall CL (1994) The Use of High Spectral Resolution Bands for Estimating Absorbed Photosynthetically Active Radiation (A par). Proceedings of the 6th Symposium on Physical Measurements and Signatures in Remote Sensing, January 17–21, 1994 Val D'Isere, France pp. 299-306.
- Haboudane Driss, John R Miller, Nicolas Tremblay, Pablo J Zarco-Tejada, Louise Dextraze (2002) Integrated Narrow-Band Vegetation Indices for Prediction of Crop Chlorophyll Content for Application to Precision Agriculture. Remote Sensing of Environment 81(2): 416-426.
- Daughtry CST, Walthall CL, Kim MS, Brown de Colstoun E, Mc Murtrey JE (2000) Estimating Corn Leaf Chlorophyll Concentration from Leaf and Canopy Reflectance. Remote Sensing of Environment 74(2): 229-239.
- Rondeaux G, Steven M, Baret F (1996) Optimization of soil-adjusted vegetation indices. Remote Sensing of Environment 55(2): 95-107.
- Micasense Inc (2015) Micasense Red Edge TM 3 Multispectral Camera User Manual.
- Steven, Michael D (1998) The Sensitivity of the OSAVI Vegetation Index to Observational Parameters. Remote Sensing of Environment 63 (1): 49-60.
- Patrick AS, Pelham A, Culbreath CC, Holbrook IJ, De Godoy, et al. (2017) High Throughput Phenotyping of Tomato Spot Wilt Disease in Peanuts Using Unmanned Aerial Systems and Multispectral Imaging. IEEE Instrumentation Measurement Magazine 20(3): 4-12.
- Berni JA, Zarco-Tejada PJ, Suárez Barranco, Fereres Castiel E (2009) Thermal and narrow-band multispectral remote sensing for vegetation monitoring from an unmanned aerial vehicle. Institute of Electrical and Electronics Engineers 47(3): 722-738.
- Bettiga, Larry (2015) Assessing Grapevine Leafroll and Red Blotch Disease Impacts in Local Vineyards. ANR Blogs.
- Ferentinos K (2018) Deep learning models for plant disease detection and diagnosis. Computer and Electronics in Agriculture 145: 311-318.
- Smith, Randall B (2012) Introduction to Hyperspectral Imaging. TNTMIPS.


