Zoning and Trend Analysis of PET for Moisture Management in Fruit Crops under Changing Climate in NW India using GIS
Mohan Singh1*, Ram Niwas2 and Ak Godara3
1Department of Environmental Science, Dr. YS Parmar University of Horticulture & Forestry, India
2Department of Agricultural Meteorology, India
3Department of Fruit Science CCS Haryana Agricultural University, India
Submission: December 18, 2018;Published: May 30, 2019
*Corresponding author: Mohan Singh, Department of Environmental Science, Dr. YS Parmar University of Horticulture & Forestry, Solan (HP), India
How to cite this article: Mohan Singh, Ram Niwas, Ak Godara. Zoning and Trend Analysis of PET for Moisture Management in Fruit Crops under 0067 Changing Climate in NW India using GIS. JOJ Hortic Arboric. 2019; 2(3): 555590. DOI: 10.19080/JOJHA.2018.01.555590. DOI: 10.19080/JOJHA.2018.01.555590
Abstract
A study was conducted to quantify trends, variability and spatial distribution of potential evapotranspiration (PET) and its influence on agricultural production in north-west India for this purpose more than 30 years data on evaporation of twenty two different agrometeorological stations of Jammu & Kashmir, Himachal Pradesh, Uttarakhand, Punjab, Haryana, Chandigarh, Delhi, Uttar Pradesh and Rajasthan were used. The evaporation data and the coordinates were converted (into decimal system) for each meteorological station, for spatial analysis. Potential evapotranspiration trends for different meteorological stations in hills, plains of north-west India were evaluated using trend analysis. The map of north-west India was digitalized and different Potential evapotranspiration zones were delineated using GIS. The slope values (mm/year) were positive for all the stations except two Rancheria (-0485) and Narnauk (-0.513). During effective growing season the normal potential evapotranspiration was 679.1 ± 25.0mm for hills 1395±105.4mm for plains and 1192.4 ± 83.3mm for north-west India with the significance level (p) of slope was 0.160 for hills, 0.330 for north-west India and highest 0.389 for the plains. The normal potential evapotranspiration during the effective growing season was 550.2mm for hills 1329.2mm for plains and 116.8mm for north-west India with coefficient of variation of 4.1,7.9 s& 7.4 per cent and slope value (mm/year) of 0.42, 1.79 and 1.94, respectively. During dormant season the normal PET for hills was 128.9mm, for plains was 55.7 mm and for north-west India was 75.7mm with coefficient of variation of 9.9, 13 & 11.5%, respectively. The slope was positive 0.73mm per year in hills followed 0.14mm/year in NW India but it was negative for plains and decreasing with a rate of 8mm per 100 years. The study area was divided into five zones (<600, 600-700, 700-1100, 1100-1400 and >1400mm) based on annual potential evapotranspiration.
Keywords: Potential evapotranspiration Trend analysis Fruits crops NWIndia Zoning GIS
Introduction
Water is one of the most essential and limited natural resource which plays a vital role in maintaining biodiversity, our health, social welfare and our economic development [1]. During the last 50 years, the actual level of per capita water supply decreased significantly in many countries due to population increase, insufficient water use and global warming. The state of Punjab is already suffering from depleting water resources, climatic variability impacts and increased occurrence of extreme weather events [2]. Declining water resources and water quality problems have resulted in dramatic increasing need for water conserving methodologies on a field, watershed and regional scale and this makes efficient use of freshwater resources an obligation of each user. Earth’s temperature has increased by 0.74°C during the last century (1906-2005) due to increase in greenhouse gases through anthropogenic emissions with temperature may rise from 1.8-4.0°C by the turn of 21st century resulting in an anticipated instability in food, feed and fiber production [3]. Demand for irrigation water is more sensitive to agricultural production as climatic variability increased dryness thereby creating more demand of water to fulfill crop growing period [4]. Thus, the impacts of climate change on agriculture and water resources has emerged as important issue for scientists as well as policy makers [5-7]. Increase in the rate of evapotranspiration along with temperature causes depletion in soil moisture retention capacity and increase salinity in semi-arid situations [8]. Large actual evapotranspiration (AET) rates in agricultural regions impact water quantity and quality [9,10]. In planning and management of available water resources foragricultural sector, the defining strategies become a national and global priority
Evapotranspiration (ET) can be defined as the transfer of water in the form of water vapor from any moist surface into the air unless the air is saturated. From the hydrological perspective, AET is the primary mechanism by which water is removed from the hydrologic cycle [11,12]. Most of the hydrological models employ the concept of potential evapotranspiration (PET) as the driving function for the calculation of AET [11,13,14]. PET is defined as the amount of water that would be removed from a vegetated landscape with no restrictions other than the atmospheric demand [15] and is often measured with evaporation pans. Evapotranspiration is one of the most important components of hydrological cycle having a significant impact on crop water requirements. It has a great significance in the application of need-based irrigation to the crops. Under present scenarios of changing climatic conditions and depleting water resources, its importance increase manifolds. In future, evapotranspiration and crop water productivity will be altered due to climate change [16,17]. Considering the important role that evapotranspiration plays in the water cycle, the appropriate selection of the PET method to estimate AET is of great importance [18]. Estimation of crop water requirements (Etc.) is one of the main components used in irrigation planning, design and operation (Rawson et al., 2013). Jensen et al. [15] provided detailed reviews of the methods commonly used to determine evapotranspiration and estimated crop water requirements.
Efficient use of water resources in ago-ecosystems of the World has become increasingly important because of rapid depletion of water resources, industrial development and population increase, drought conditions, and degradation of ground and surface water quality in many regions. To adapt crop systems to changing climate, it is important to know how climate change affects water resources, crop and water productivity [19], but before conducting such studies long-term analysis of trends and variability in pan evaporation is indispensable. The present study is undertaken to estimate PET and to assess its trends and delineate different PET zones in north-west India.Pradesh), Rancheria (Uttarakhand), Ludhiana, Bathinda Patiala (Punjab) Chandigarh, Ambala, Karnal, Rohtak, Sirsa, Hisar, Bawl, Narnauk (Haryana) Delhi, Sriganganagar, Jaipur (Rajasthan) Saharanpur and in Uttar Pradesh located in north-west India were selected for the study. The experimental site was the north-west India (Figure 1) which approximately is located between 26040′- 37010′ N latitude and between 720 50′ & 810 00′ E longitudes. The altitude of area varies between 200 to 8600meters above mean sea level. Total area of the site is approximately 5 lakh square km out of these 1000 thousand hectares is covered under the fruit crops. It has geographic features like the cold desert, the coldest place on the earth (Akbar et al. 2013), the Higher Himalaya, the Middle Himalaya, the Lower Himalaya, the Shivalik hills, semi desert sandy plain & the Aravalli range and the hot Thar Desert.
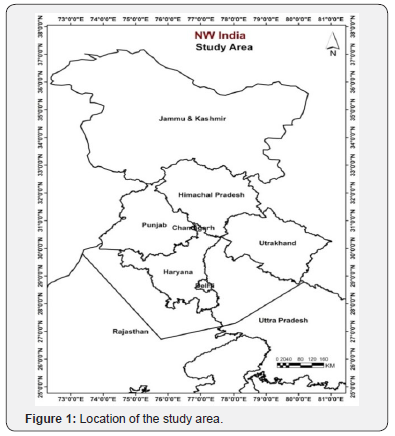
Materials and Methods
Study sites
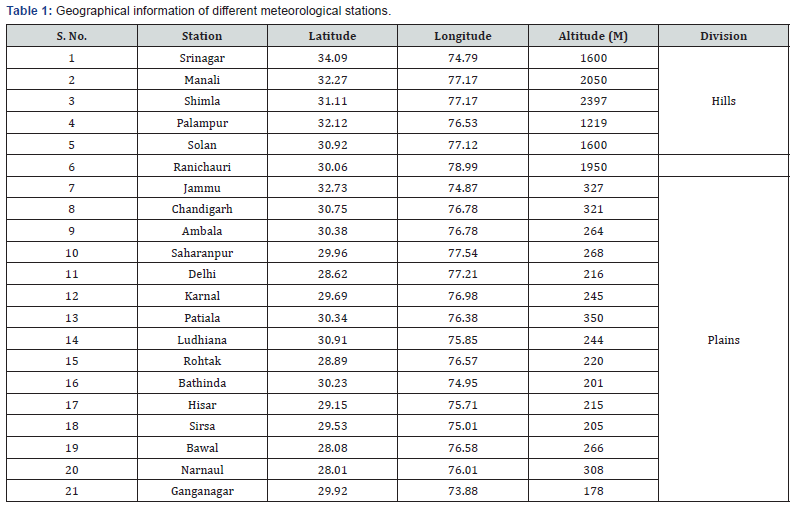
Twenty two meteorological stations, Srinagar, Jammu (Jammu & Kashmir), Manali, Shimla, Palampur, Sloan (HimachalThe geographical information (latitude, longitude and altitude) of all the stations is given in Table 1. Based on the altitude, the study area was divided >1000 meters as hills (Srinagar, Manali, Shimla, Palampur, Sloan and Rancheria) and < 1000m as Plains (Jammu, Chandigarh, Ambala, Saharanpur, Delhi, Karnal, Patiala, Ludhiana, Rohtak, Bathinda, Hisar, Sirsa, Bawl, Narnauk, Ganganagar and Jaipur).
Seasonal PET
Effective growing season (EGS)
The normal PET was less than 1000mm for Srinagar, Manali, Shimla, Palampur, Sloan and Rancheria and between 1000 & 1300mm for Jammu, Chandigarh, Ambala, Saharanpur, Karnal, Patiala and Ludhiana and between 1300 & 1800 for Delhi, Rohtak, Bathinda, Hisar, Sirsa, Bawl, Narnauk, Jaipur and Ganganagar being the highest for Ganganagar (1703.1mm) and lowest for Shimla (501mm). The coefficient of variation was highest for Jaipur (11.1%) and lowest (2.9%) for Shimla (Table 3). It was less than 6% for ten stations (Srinagar, Manali, Shimla, Palampur, Sloan, Rancheria, Ambala, Saharanpur, Karnal and Patiala) and varied from 6-12% for twelve stations (Jammu, Chandigarh, Delhi, Ludhiana, Rohtak, Bathinda, Hisar, Sirsa, Bawl, Narnauk, Ganganagar and Jaipur). The slope was negative at four stations (Srinagar, Palampur, Rancheria and Narnauk) but positive at rest of the eighteen stations ranging from 0.119mm per year (Karnal) to 8.24 mm per year (Ganganagar). The standard error (mm) was highest (6.0) at Saharanpur and lowest (0.07) for Karnal. The confidence level of significance (p) of R² was more than 0.70 for Palampur, Delhi, Hisar, Narnauk and less than 0.70 for rest of the stations. The normal evapotranspiration during the effective growing season was 550.2mm for hills 1329.2mm for plains and 116.8mm for north-west India with coefficient of variation of 4.1, 7.9 & 7.4%, respectively (Table 3). The slope value (mm/ year) was positive for hills (0.42), plains (1.79) and north-west India (1.94). Similarly, Chakravarty et al. [29] also reported an increasing trend in ET during rabbi season at Jabalpur. The standard error was higher for plains (2.11) as compared to hills and north-west India. The confidence level of significance (p) of R² was 0.379 for plains, 0.334 for north-west India and 0.214 for hills.
Calculation of PET
Computation of PET for a given climate is essentially required to arrive at a meaningful and scientific conclusion before taking any agricultural decision. Thornthwaite [21] who first replaced the early surrogates of moisture demands (pan evaporation and air temperature) and coined a climatologically meaningful new term called as potential evapotranspiration [22]. There are many ways of determining potential evapotranspiration [23,24]. Several direct and indirect methods exist to estimate potential evapotranspiration, which includes the use of lysimeter, soil water balance and use of empirical formulae. High cost and unavailability restrain the use of lysimeter while soil moisture balance method is laborious and time consuming and also needs sophisticated instruments. Thus, evaluation of evapotranspiration by empirical method has great appeal because PET is estimated from standard meteorological data as input. The Thornthwaite method [20] is the best among different empirical approaches as used by many workers for estimation of PET over several location of India [25,26]. This is a shortcut of replacing a comprehensive atmospheric model aswell as some interactions by presenting observed temperature and precipitation [27] also easy to calculate as it requires only monthly mean temperature data which was available at all the meteorological stations used in this study:

For a month consisting 30 days and 12 hours a day, the above equation can be written as:

Where,
E = Unadjusted PET, cm/month
T = Mean air temp, °C
I = Annual heat index. It is the summation of 12 values of monthly heat indices i.

a = an empirical exponent computed by an expression given as,

For daily computation the equation is modified as:
PET = (kxEx10)/30 (mm/day)
Where, K = Adjustment factor
Calculation of statistical measures
Statistical measures like normal (long period average) standard deviation, coefficient of variation, slope, standard error, t-values, significance (probability) and regression coefficient were computed using ‘OP Stat” software from daily Potential evapotranspiration of more than 30 years at each station. Monthly annual and seasonal statistical measures were computed for each station, hills, plains and north-west India, respectively.
Calculation of percent share
Percentile shares of a particular station in the normal PET (called PSPET) of all the stations were worked out by dividing the normal PET of a given station by the summation of all the formal’s and multiplied by hundred as: PSPET = (Normal PET of a particular station x100)/Σ Norma’s PET of 22 stations.
Results and Discussion
Annual PET
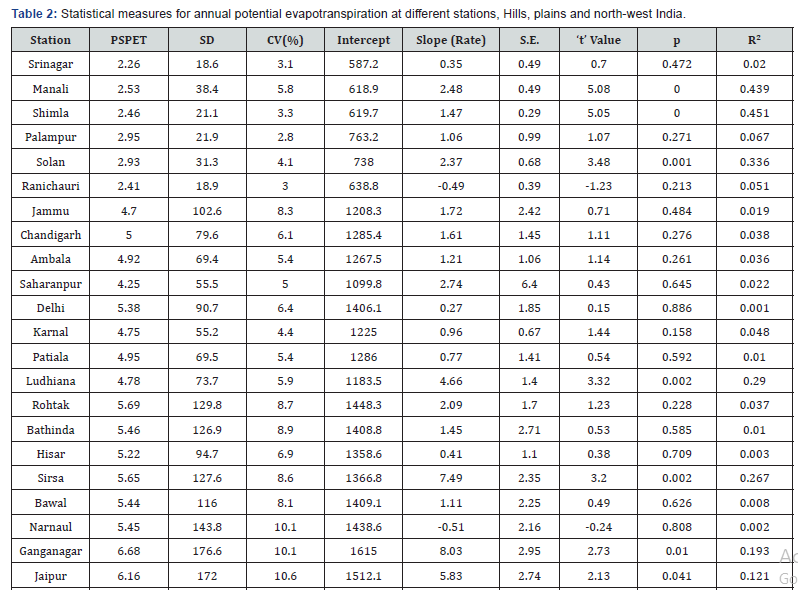
The annual normal potential evapotranspiration ranged from 500-800mm for Srinagar, Manali, Shimla, Palampur, Sloan and Rancheria and from 1000-1800 mm for remaining sixteen stations. The coefficient of variation was between 5 & 11% for Manali, Jammu, Chandigarh, Ambala, Saharanpur, Delhi, Patiala, Ludhiana, Rohtak, Bathinda, Hisar, Sirsa, Bawl, Narnauk, Ganganagar, Jaipur and 2-5 for six stations (Table 2). The slope values (mm/year) were positive for all the stations except two stations Rancheria (-0485) and Narnauk (-0.513). It was between 2&8mm/year for Manali, Sloan, Saharanpur, Ludhiana, Rohtak, Sirsa, Ganganagar and Jaipur and was less than 2mm/ year for the remaining stations. The standard error was highest for Saharanpur (6.4mm) and lowest for Shimla (0.29mm). The normal evaporation computed was 679.1 ± 25.0mm for hills 1395 ± 105.4mm for plains and 1192.4 ± 83.3mm for north-west India with the coefficient of variation of 3.7, 7.4 &6.4%, respectively. The slope was positive having values of 0.79, 1.97 and 1.65mm/ year for hills, plains and north-west India with standard error of 0.56,2.15 & 1.73mm, respectively. The significance level (p) of slope was 0.160 for hills, 0.330 for north-west India and highest 0.389 for the plains. Similarly, Chattopadhyay & Hume [28] concluded that future warming seems likely to lead in general to increased potential evapotranspiration over India, although this increase will be unequal between regions and seasons
Seasonal PET
Effective growing season (EGS)
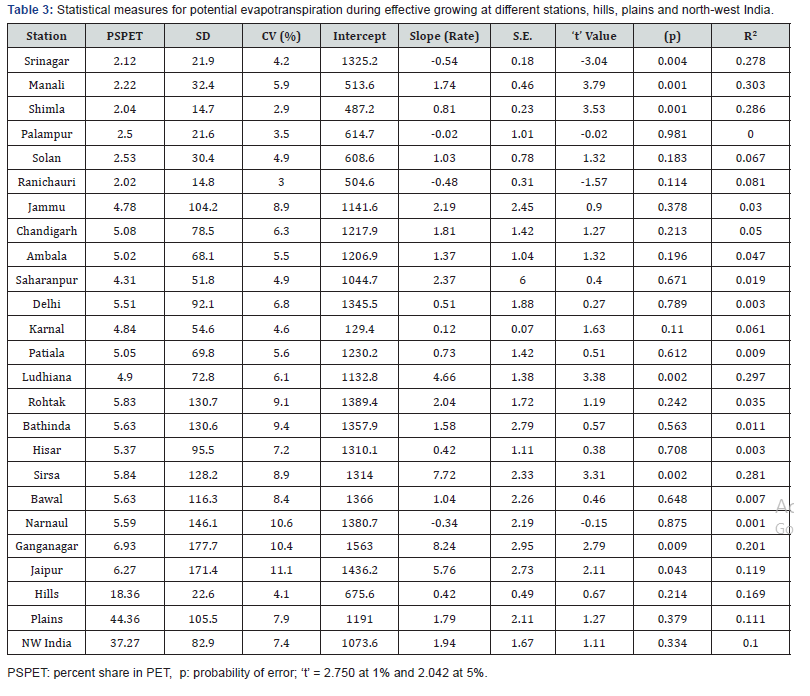
The normal PET was less than 1000mm for Srinagar, Manali, Shimla, Palampur, Sloan and Rancheria and between 1000 & 1300mm for Jammu, Chandigarh, Ambala, Saharanpur, Karnal, Patiala and Ludhiana and between 1300 & 1800 for Delhi, Rohtak, Bathinda, Hisar, Sirsa, Bawl, Narnauk, Jaipur and Ganganagar being the highest for Ganganagar (1703.1mm) and lowest for Shimla (501mm). The coefficient of variation was highest for Jaipur (11.1%) and lowest (2.9%) for Shimla (Table 3). It was less than 6% for ten stations (Srinagar, Manali, Shimla, Palampur, Sloan, Rancheria, Ambala, Saharanpur, Karnal and Patiala) and varied from 6-12% for twelve stations (Jammu, Chandigarh, Delhi, Ludhiana, Rohtak, Bathinda, Hisar, Sirsa, Bawl, Narnauk, Ganganagar and Jaipur). The slope was negative at four stations (Srinagar, Palampur, Rancheria and Narnauk) but positive at rest of the eighteen stations ranging from 0.119mm per year (Karnal) to 8.24 mm per year (Ganganagar). The standard error (mm) was highest (6.0) at Saharanpur and lowest (0.07) for Karnal. The confidence level of significance (p) of R² was more than 0.70 for Palampur, Delhi, Hisar, Narnauk and less than 0.70 for rest of the stations. The normal evapotranspiration during the effective growing season was 550.2mm for hills 1329.2mm for plains and 116.8mm for north-west India with coefficient of variation of 4.1, 7.9 & 7.4%, respectively (Table 3). The slope value (mm/ year) was positive for hills (0.42), plains (1.79) and north-west India (1.94). Similarly, Chakravarty et al. [29] also reported an increasing trend in ET during rabbi season at Jabalpur. The standard error was higher for plains (2.11) as compared to hills and north-west India. The confidence level of significance (p) of R² was 0.379 for plains, 0.334 for north-west India and 0.214 for hills.
Dormant season (DS)
The normal potential evapotranspiration varied from 118- 135mm for Manali, Shimla, Palampur, Sloan and Rancheria, from 50-80mm for Srinagar, Jammu, Chandigarh, Ambala, Saharanpur, Delhi, Karnal, Patiala, Ludhiana, Rohtak, Narnauk and Jaipur and from 40-50mm for Bathinda, Hisar, Sirsa, Bawl, and Ganganagar during dormant season. The coefficient of variation was highest for Palampur (56.7%) and varied from 10-20% for Srinagar, Manali, Shimla, Sloan, Jammu, Chandigarh, Ambala, Delhi, Karnal, Ludhiana, Rohtak, Bathinda, Hisar, Sirsa, Bawl, Narnauk, Ganganagar, Jaipur and was less than 10% for Shimla, Rancheria, Saharanpur and Patiala (Table 4). The slope value was negative for Rancheria, Jammu, Chandigarh, Ambala, Delhi, Karnal, Bathinda, Hisar, Sirsa, Narnauk and Ganganagar and positive for Srinagar, Manali, Shimla, Palampur, Sloan, Saharanpur, Patiala, Ludhiana, Rohtak and Bawl.
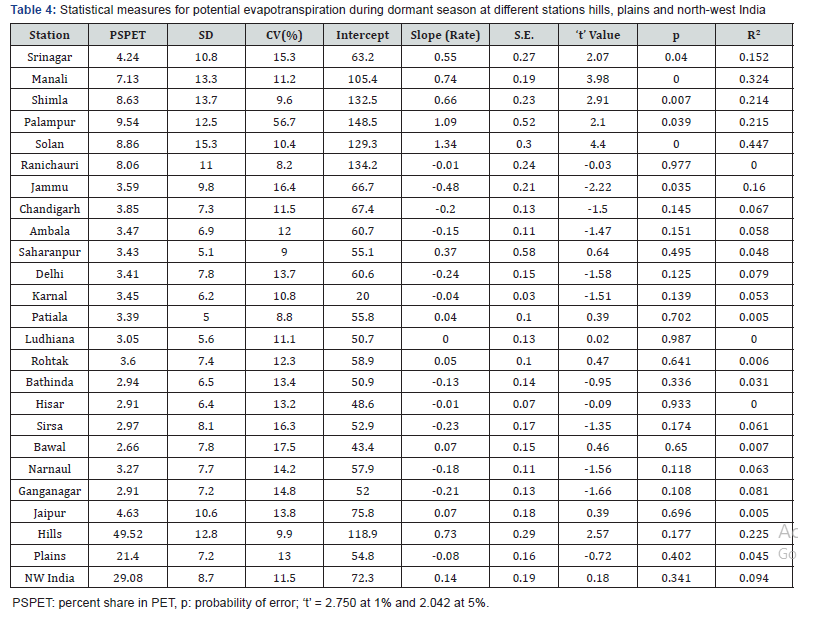
PET was increasing at a rate of 108.5mm/100 years at Palampur followed by Sloan 133.7mm per 100 years and decreasing with a rate of 47.6mm per 100 years at Jammu followed by Delhi 24mm per 100 years. The standard error was less than 0.5mm for all the stations except Saharanpur (0.58mm) and Palampur (0.52mm). The significance level of confidence for R² (p) was more than 0.60 for Rancheria, Patiala, Ludhiana, Rohtak, Hisar, Bawl, and Jaipur and less than 0.20 for Srinagar, Shimla, Palampur, Jammu, Chandigarh, Ambala, Delhi, Karnal, Sirsa, Narnauk, Ganganagar, Manali and Sloan.
The normal PET for hills was 128.9mm, for plains was 55.7mm and for north-west India was 75.7mm with coefficient of variation of 9.9, 13-11.5 per cent, respectively. The slope was positive 0.73mm per year in hills followed 0.14mm/year in NW India but it was negative for plains and decreasing with a rate of 8mm per 100 years. Kindra (2015) reported a decreasing trend in monthly pan evaporation over a period of 44 years during most of the months except March and April at Ludhiana. The confidence level of significance for R² (p) was 0.402 for plains, 0.341 for north-west India and 0.177 for hills.
Spatial distribution of PET
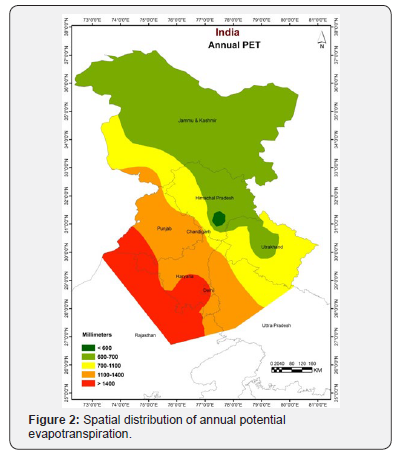
Spatial variation in annual PET of the area under study is depicted in Figure 2, which indicates that potentialevapotranspiration decreased towards north but the lowest was in the central part where the highest rainfall was observed. The study area was divided into five zones (<600, 600-700, 700- 1100, 1100-1400 and >1400mm) based on annual potential evapotranspiration. It was more than 1400mm in south-west hot desert and less that 700mm in north-west cold desert. The normal annual potential evapotranspiration in north-west India was 1192.4mm. It varied spatially from about 1751.5mm in the south-west area to 591.9 mm toward north-east of the study area.
Discussion
The annual normal evapotranspiration was comparatively lower 500-800mm for Srinagar, Manali, Shimla, Palampur, Sloan and Rancheria as compared to for Jammu, Chandigarh, Ambala, Saharanpur, Delhi, Karnal, Patiala, Ludhiana, Rohtak, Bathinda, Hisar, Sirsa, Bawl, Narnauk, Ganganagar and Jaipur which ranged between 1000-1800mm. This might be due to lower temperatures prevailed in hills as compared to plains. PET showed increasing trend for all the stations except Rancheria (-48.5mm/100years) and Narnauk (-51.3mm/100years). The increasing rate was from 209 to 803mm/100years for Manali, Sloan, Saharanpur, Ludhiana, Rohtak, Sirsa, Ganganagar and Jaipur, from 106-185mm/100years for Shimla, Palampur, Jammu, Chandigarh, Ambala, Bathinda, Bawl and less than 100mm/100years for Srinagar, Delhi, Karnal, Patiala and Hisar. The increase in PET was probably due to regional warming. Mehta & Pandey [30] observed regional variation in evapotranspiration over Gujarat.
The normal PET on regional basis was 679.1mm for hills, 1395mm for plains, and 1192.4mm for north-west India with the coefficient of variation of 3.7, 7.4&6.4 percent, respectively. The PET showed an increasing rate of 0.79 mm/years, 1.97mm/years and 1.65 mm/years for hills, plains and north-west India with standard error of 0.56, 2.15 and 1.73 respectively. The potential evapotranspiration was higher in plains due to higher normal temperature prevailed in plains 23.6°C and 15.1°C in hills. Madhu et al. [31] reported an increasing rate of 2.9mm/decade over India in evapotranspiration over the past 107 years (1901 to 2007). The increasing trend of PET over north-west India was also reported by Goyal [32] in which the PET showed a 0.5mm/ year increment for the last 100 years. During effective growing season the potential evapotranspiration was 550.2mm for hill 1329.2mm for plains and 116.8mm for north-west India with coefficient of variation of 4.1, 7.9 and 7.4% respectively. The rate of change was observed positive for hills (4.2/decade), plains (17.9/decade) and north-west India (19.4/decade). Similar trend was observed in PET during dormant season except in plains where it where decreasing trend.
There are many ways of determining potential evapotranspiration [23] but the Thornthwaite [20] method is the best [25,26,33,34]. Spatial variation of annual potential evapotranspiration in north-west India indicates that it decreased towards north but was minimum in the central part where the highest rainfall was observed. Based on variation in annual potential evapotranspiration, the study area was divided into five zones (<600, 600-700, 700-1100, 1100-1400 and >1400mm). The LPA of annual potential evapotranspiration in NW India was 1192.4mm and varied from 1751.5mm in the southwest to 591.9mm in north-east of the study area. The higher PET values in SW area of study was because of higher temperatures prevailed in this region, which directly contributed in PET as compared to north-east area. Madhu et al. [31] and Goyal [32] reported an increasing rate of 2.9 mm/decade 5.0mm/decade in evapotranspiration over India and NW India, respectively.
Conclusions
a) PET showed increasing trend for all the stations except Rancheria (-48.5mm/100years) and Narnauk (-51.3mm/100years). The increasing rate was from 209-803mm/100years for Manali, Sloan, Saharanpur, Ludhiana, Rohtak, Sirsa, Ganganagar and Jaipur and 200mm /100 years at rest of the stations.
b) The normal PET on regional basis was 679.1, 1395, and 1192.4mm with the coefficient of variation of 3.7, 7.4 and 6.4% and showed an increasing rate of 0.79mm/years, 1.97mm per years and 1.65mm per years for hills, plains and north-west India, respectively.
c) During effective growing season the normal value of PET was 550.2, 1329.2 & 116.8mm with coefficient of variation of 4.1, 7.9 & 7.4% and showed an increasing rateof 4.2, 17.9 & 19.4mm per decade for hills, plains and northwest India, respectively
d) The normal PET was 128.9, 55.7 & 75.7mm for hills, plains and north-west India and it was increasing at the rate of 73 & 14mm/100 years for hills and north-west India, but it was decreasing at the rate of 8 mm/100 years in plains during dormant season
References
- Donald BA (1968) Water Our second most important natural resource 9 BCL revised. 19(3): 535-552.
- Kingra PK (2015) Trends and variability in pan evaporation at Ludhiana. Journal Agrometeorology 17(2): 271-272.
- Aggarwal PK (2008) Global climate change and Indian agriculture: impacts, adaptation and mitigation. Indian J Agric Sci 78(10): 911-919.
- Intergovernmental Panel on Climate change (IPCC) (2007) Climate Change 2007: The Physical Science Basis, Contribution of Working Group I to the fourth Assessment Report of Intergovernmental Panel on Climate change. Cambridge University Press, Cambridge, UK, pp. 996.
- Gregory PJ, Ingram JSI (2000) Global change and food and forest production: future scientific challenges. Agri Ecosys Environ 82: 3-14.
- Sanchez PA (2000) Linking climate change research with food security and poverty reduction in the tropics. Agri Ecosys Environ 82(1-3): 371-383.
- Fuhrer J (2003) Agroecosystem responses to combinations of elevated CO2, ozone, and global climate change. Agri Ecosys Environ 97(1-3): 1-20.
- Sankaranarayanan K, Praharaj CS, Nalayini P, Bandyopadhyay KK, Gopalakrishnan N, (2010) Change and its Impact on cotton (Gossypium sp.). Indian J Agric Sci 80(7): 561-575.-
- Giambelluca TW, Nullet D (1992) Evaporation at High Elevations in Hawaii. Journal of Hydrology 136: 219-235.
- Farahani HJ, Howell TA, Shuttleworth WJ, Bausch WC (2007) Evapotranspiration: Progress in Measurement and Modeling in Agriculture. Transaction of the ASABE 50: 1627-1638
- Wang X, Melissa AM, Yang W (2006) Influences of Potential Evapotranspiration Estimation Methods on Swat’s Hydrologic Simulation in a Northwestern Minnesota Watershed. Transactions of the ASABE 49: 1755-1772.
- Gracel B, Quickl B (1998) A Comparison of Methods for the Calculation of Potential Evapotranspiration under the Windy Semi-Arid Conditions of Southern Alberta. Canadian Research Hydrology 13: 9-19.
- Blumenstock DI Price S (1967) Climate of Hawaii In Climates of the States. Climatography of the United States, US Department of Commerce, Washington, USA, pp. 51-60.
- Jensen ME, Burman RD, Allen RG (1990) Evapotranspiration and Irrigation Water Requirements. American Society of Civil Engineers Manual and Reports on Engineering Practice No. 70, New York, p. 360.
- Thomas A (2008) Agriculture irrigation demand under present and future climate scenarios in China. Global Planetary Change 60(3-4): 306-326.
- Mo XG, Lin ZH, Liu SX (2007) Climate change impacts on the ecohydrological processes in the Wuding River basin. Acta Ecologica Sinica 27(12): 4999-5007.
- Osorio J, Jeong J, Bieger K, Arnold J (2014) Influence of Potential Evapotranspiration on the Water Balance of Sugarcane Fields in Maui, Hawaii. Journal of Water Resource and Protection 6(9): 852-868.
- Rawson MK, Amin MSM, Mojid MA, Yaji M (2013) Estimated evapotranspiration of rice based on pan evaporation as a surrogate to lysimeter measurement. Paddy Water Environment 12(1): 35-41.
- Guo R, Lin Z, Mo X, Yang C (2010) Responses of crop yield and water use efficiency to climate change in the North China Plain. Agric Water Manag, 97:1185-1194.
- Thornthwaite CW (1943) Problem in the classification of climates. Georg review 33(2): 233-255.
- Mather JR (1990) Personal communication. Department of Geography, University of Delaware, Newwark, DE.
- Allen RG, Pereira LS, Raes D, Smith M (1998) Crop Evapotranspiration: Guidelines for computing crop water requirements Irrigation and Drainage. Paper 56, Food and Agriculture Organization of the United Nations, Rome. pp. 300.
- Kingra PK, Hundal SS (2002) Estimation of PET by various methods and its relationships with mesh covered pan evaporation at Ludhiana. J Agrometeorology 4(2): 143-149
- Thornthwaite CW (1948) An approach toward a rational classification of climate. Geographical review 38(1): 55-94
- Krishan Kumar, K Rupa Kumar, Racka PR (1987) Comparison of Penman and Thornthwaite method of estimating potential evapotranspiration for Indian conditions. Theor Appl Climatol 38(3): 140-146.
- Rao KN, George CJ, Ramasastri KS (1971). Potential evapotranspiration over India. Scientific Report No 136 New Delhi IMD.
- Huang J, Dool Hv, Geogakakas P (1996) Analysis of model-calculated soil moisture over the United States of America and application to long range temperature forecast. Journal of Climate 9(6): 1-3
- Chattopadhyay N, Hulme M (1997) Evaporation and potential evapotranspiration in India under conditions of recent and future climate change. Agric Forest Meteorol 87(1): 55-73.
- Chkravarty R, Bhan M, Rao AVRK, Awasthi MK (2015) Trends and variability in evapotranspiration at Jabalpur Madhya Pradesh. Journal of Agrometeorology 17(2): 199-203.
- Mehta R, Pandey V (2015) Reference evapotranspiration (ETo) and crop water requirement (ETc) of wheat and maize in Gujarat. Journal of Agrometeorology 17(1):107-113.
- Madhu S, Kumar TVL, Barbosa H, Rao KK, Bhaskar V (2015) Trend analysis of evapotranspiration and its response to droughts over India. Theor Appl Climatol 121(1-2): 41-51.
- Goyal RK (2004) Sensitivity of evapotranspiration to global warming: a case study of arid zone of Rajasthan (India). Agric Water Manage 69(1): 1-11.
- Doorenbos J, Pruitt WO (1975) Guidelines for predicting crop water requirements, Irrigation and Drainage Paper 24, FAO of the United Nations, Rome, pp. 179.
- Thornthwaite CW, Mathar JR (1955) The water budget and its use in irrigation water. USDA yearbook of agriculture: 346-357.


