The Sensitivity of DTR to the Increased CO2 over Mid-latitude Semi-dry Regions
Muhammad Mubashar Dogar1,2*
1Earth Science and Engineering, King Abdullah University of Science and Technology, Saudi Arabia
2Global Change Impact Studies Centre, Ministry of Climate Change, Islamabad, Pakistan
Submission: November 15, 2018; Published: February 08, 2019
*Corresponding author: Muhammad Mubashar Dogar, Earth Science and Engineering, King Abdullah University of Science and Technology, Saudi Arabia
How to cite this article: Muhammad Mubashar Dogar. The Sensitivity of DTR to the Increased CO2 over Mid-latitude Semi-dry Regions. JOJ Hortic Arboric. 2019; 2(2): 555584.
Abstract
The rationale for this study lies in the fact that the mid-latitude regions are largely affected by the global and regional scale circulation changes. Moreover, earlier studies emphasize that the variation in atmospheric concentration of heat-trapping gases, cloud amount and moisture contents produce substantial regional climatic changes. Therefore, it is of significant practical importance to analyze the sensitivity of mid-latitude regions to anthropogenic forcing, especially, the CO2 radiative forcing. This study assesses the role of CO2 radiative forcing in causing asymmetric diurnal changes over the mid-latitude semi-dry region using an idealized experiment conducted by single column (1-D) Radiative-Convective Model (RCM) of the diurnal cycle. The model is capable enough in highlighting the main features responsible for the observed diurnal asymmetry in the ground temperature. A significant decrease in the Diurnal Temperature Range (DTR) is observed in this region under doubled CO2 forcing. The amount of thermal radiation trapped by CO2 forcing in the presence of water vapors plays a key role in surface temperature changes and resultant decreasing of the DTR. It is further found that CO2 induced climatic feedbacks are equally important in producing diurnal asymmetry. To better understand the complete picture of the DTR variability, one needs to explore all the possible forcing and feedbacks such as caused by aerosols, water vapors and cloud amount along with their distribution in the atmosphere.
Keywords: Radiative Convective Model Diurnal Temperature Range Diurnal asymmetry Climate forcing and feedbacks CO2 Radiative Forcing
Introduction
Studying the global and regional climate variability and associated climatic impacts induced by different climate drivers (anthropogenic and natural climate forcings) is a subject of great interest [1-5]. The climatic impacts caused by these climate drivers are examined by analyzing their interactions with solar and terrestrial radiation. In this paper, we investigate the impact of anthropogenic radiative forcing, produced by the rise in the atmospheric concentrations of CO2, on the diurnal temperature range, especially, in the mid-latitude semi-dry region. We focus on the mid-latitude semi-dry region, as the climate of this region is very sensitive to the climatic changes and impacts caused by these internal and external climate drivers [1-5].
Downwelling of thermal radiation from the atmosphere to the surface has increased as a result of increased radiative absorption and resulting warming due to the increasing amount of anthropogenic gases in the atmosphere [6]. This process enhances the amount of radiative energy at the surface that is used as a fuel for evaporation besides warming the surface of the Earth. The resultant enhanced greenhouse effect, therefore, tends to accelerate the global hydrologic cycle, as discussed in many studies based on climate model simulations (see, e.g., [7]). Increased level of anthropogenic tracers since preindustrial times had already led to significant warming during the 20th century, even though the direct observational evidence is sparse and limited to the latter part of the century [8,9]. While a varying pattern of the global mean surface air temperature is used as a useful indicator of climate change and variability, changes in the amount of daily maximum and minimum surface temperatures and their difference that is known as DTR, provide more information than the mean pattern alone [10]. The observed global mean trend towards warmer land temperatures has been evaluated by a large increase in the minimum daily temperatures (Tmin) [11-14]. Daily maximum temperatures (Tmax), however, have changed at a much smaller rate, resulting in a decreasing trend in the diurnal temperature range (DTR), the magnitude of which is comparable to the mean warming itself. As an identifiable representative of recent climate change, DTR trend is important in identifying the forcing responsible for the change, and in particular the anthropogenic component. However, the cause of the DTR trend in the mid-latitude semi-dry region is still poorly understood, as is its connection to anthropogenic forcing.
Variations in cloud amount are found to have a strong correlation with DTR variations [13,15,16]. The higher clouds albedo decreases the incoming solar radiation during the day, and thereby reduces Tmax. Indeed, observation and model-based studies link the decreasing DTR to the increasing amount of the precipitating clouds [11,15,16]. These low-level precipitating clouds contribute significantly in backscattering the sunlight; therefore, variation in their frequency of occurrence is anticipated to cause the strongest impact on the DTR. Clouds also produce more downward thermal radiation, so increasing amount of nighttime cloud would increase daily minimum temperature Tmin and thus decrease the DTR. However, the tendency of the diurnal cycle of cloud cover over global land areas particularly midlatitude region during recent years is currently unknown.
Soil moisture is also anticipated to influence the DTR, through its effect on evaporative cooling, the ground albedo, and the ground heat capacity. This effect tends to be more indispensable in the occurrence of extreme hot days [17,18]. It has been highlighted that the varying pattern of soil moisture is related to the DTR, although secondary to changes in cloud cover [16]. This raises the possibility that the observed decreases in the DTR may be due in part to physiological responses of land use pattern to climate change or to changes in vegetation, although it appears that this first factor is unable to account fully for the observed changes [12,19]. Of course, on a local and even regional basis, land surface modification by humans is also an important cause of climate change, and the model used in the present study is well suited for studying such changes, but in the present paper I looked at only one factor, i.e. human-induced forcing that is caused by changes in CO2 (as a surrogate for all greenhouse gases). Few studies are available that take into account all the processes involved for the asymmetry of the DTR particularly taking soil moisture into account in the semi-dry areas of the globe [20]. Therefore, for a better understanding of the DTR pattern and its variation in the mid-latitude semi-dry region during summer (June) season, a fully efficient one-dimensional (1-D) radiative-convective model of the diurnal cycle is used which takes into account all the main features associated with the asymmetry of diurnal cycle and their resultant effect on DTR pattern.
In this paper, the effect of CO2 changes on the diurnal asymmetry of climatic response is examined using a 1-D radiativeconvective model (RCM) over the mid-latitude semi-dry region. By specifying only, the location, time of simulation year, net radiation flux at the top of the atmosphere, soil wetness and surface albedo, the model internally generates the equilibrium climate, including the water vapor and cloud distributions. The ideal experiment presented here should be considered as illustrative and the exact magnitude of results as approximate, but the qualitative discussion is of general interest. Model is firstly run to achieve equilibrium with constant convergence of energy in the column and no large-scale vertical motions. This is done to segregate the important radiative and surface feedbacks that could influence the diurnal cycle.
The rest of the paper is presented as follows. Section 2 describes the model and the experimental setup. The diurnal climate changes induced by doubling the CO2 along with water vapor feedbacks are presented in section 3 (results and discussion). The last section briefly describes the conclusion obtained in the study.
Model Description and Experiment Setup
A single column radiative-convective equilibrium model is employed in this study, which is discussed in detail by [21]. This model explicitly calculates a complete set of physical processes, including the water vapor dissemination, clouds, transport processes in the boundary layer, and convection to completely accounts for the factors effecting diurnal temperature cycle. This model effectively accounts for spectral radiative transport processes in a cloudy or polluted atmosphere. There are not enough studies available that account all these features in one model that can be used to investigate all these important local feedbacks to fully accounts for the diurnal cycle. This model has already been applied for the study of observed stratospheric aerosol, water vapor and ozone changes following 1991 Pinatubo eruption [21]. The model grid is composed of 12 vertical levels covering stratosphere (plus the surface).
Simulations start from a prescribed initial state and they reach a statistical equilibrium that is defined upon the 10-day average. The model stops when the difference between the average of the last 10 days and the previous 10 days is below a certain threshold value that can be chosen by the user. The results presented here are diurnal averages computed over the last 10 days period. Solar forcing is corresponding to day 172 (June) of the year in the middle latitudes (46 °N) region. For this latitude, a radiative imbalance of 100W/m2 is prescribed at the top of the atmosphere ([21], see the paper for good values at other latitudes).
In this study, the pattern of DTR variability in summer season is investigated over mid-latitude semi-dry region for a 10 days averaged period (selected from June 1992) in response to doubling of the CO2 forcing. For the comparison of this CO2 increase with background control reference state, a simplistic simulation setting in 1-D RCM model is employed as shown in Table 1.

Results and Discussion
A clear understanding of the incoming and outgoing solar as well as thermal radiation at the surface is essential for attaining a comprehensive picture of DTR asymmetry. Climate scientists are well aware of Iris hypothesis about Earth’s climate, which emphasizes the importance of radiant energy, present in between our world and outer space, in driving climate change. Over the succession of a year, the total amount of sunlight entering theearth’s system equals the amount of radiant energy reflected and sent back through the top of the atmosphere [22]. The sun beams an average of 340 watts per square meter towards the Earth and, in turn, our earth reflects 100 watts per square meter towards space. The remaining part (240 watts per square meter) of the solar energy is accumulated as heat within the air, oceans, and land surface and, gradually, emitted back up through the atmosphere to space and plays an important role in changing the climate of earth’s atmosphere.
In this study, a semi-dry region is selected (surface wetness is 0.1 and surface albedo is 0.35) without considering the aerosol component. It has been studied by [23] that surface wetness plays an essential role in environmental and agricultural processes. The pattern of the daily variation of the ground temperature for the control run and doubled CO2 forcing run is shown in Figure 1. From this diurnal cycle, it is clear that more outgoing infrared radiation are trapped by this CO2 forcing, which acts as a blanket for these radiations and keeps itself active for several years within the atmosphere, as a result, plays a key role in increasing the ground temperature compared to the one without doubled CO2 forcing.
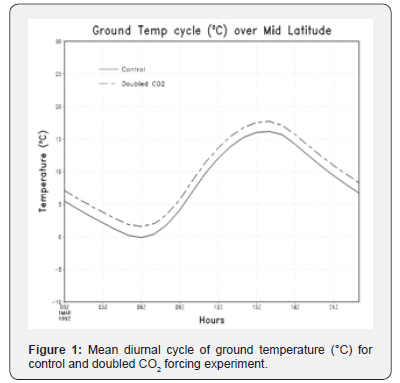
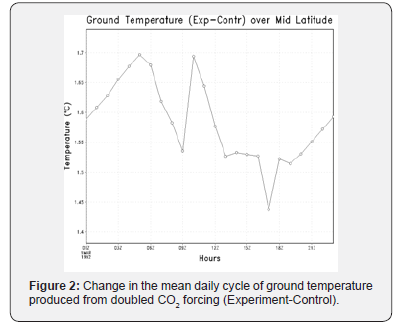
Figure 2 highlights the anomalous pattern of the daily ground temperature calculated by taking a difference between doubling of the CO2 forcing and background control reference state. From this pattern, we have a clear indication that the ground temperature anomaly is showing an increasing trend during the night and early morning and decreasing trend in the daytime (afternoon and evening) that intensifies the importance of an overall decrease in the diurnal temperature range. A similar decreasing pattern in daily temperature range is also recognized in an earlier study done over the mid-latitude region during the summer using the same model [21]. The diurnal pattern of the change in the mean daily cycle of the ground temperature and the peaks (highs and lows) shown inthis figure are consistent with the diurnal pattern of solar as well as thermal radiation trapped by CO2 and water contents in the atmosphere (Figure 3 and 4).
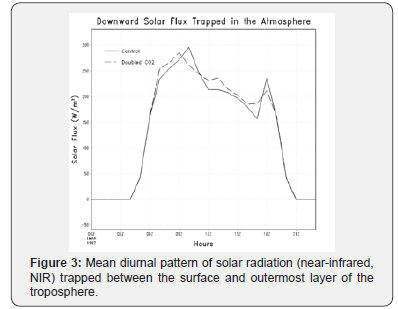
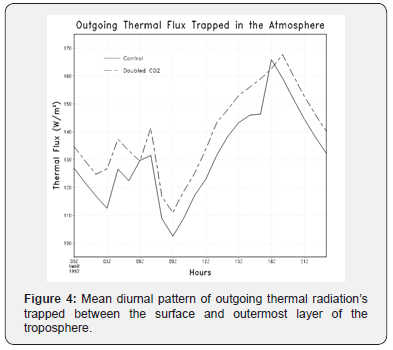
The presence of CO2 gas is not the only factor that contributes towards varying pattern of the DTR, the existence of water vapor in the atmosphere along with CO2 makes this change even more significant [21, 24]. The RCM experiments successfully showed the absorption of radiation by CO2 and water vapor together with boundary layer feedback processes that also contribute to the change of the DTR. Both the CO2 and water vapor absorb the near-infrared as well as the outgoing thermal radiation, this amount of energy is retained within the earth system, ultimately determines its average global temperature [24]. Figure 3 shows the difference of the incoming solar radiation that is above the troposphere subtracted from the solar radiation that finally reaches the ground surface. More specifically, this figure highlights the portion of solar radiation that is trapped within the atmosphere before and after doubling the CO2 forcing. Similarly, Figure 4 is showing the amount of outgoing thermal radiation that is trapped by the atmosphere (the difference of the outgoing radiation from the surface to the outermost layer of the troposphere). By looking at the high and low peaks in Figure 3, one can clearly discern the time of the diurnal cycle at which near-infrared (NIR) part of the solar radiation that is trapped by the atmosphere is reaching to its maximum and minimum values in both the experiments. More trapped solar radiation within the atmosphere as a result of doubling of the CO2 forcing could result in cooling effect (as lesser amount will reach at the surface) whereas if the trapped radiation as a result of doubling of the CO2 forcing are less, this may lead to warming effect (because more radiation reaches to surface). Analysis of Figure 2 & 3 confirms that the ground temperature is less when the trapped solar radiation is more and vice versa. Figure 4 shows diurnal pattern of outgoing thermal radiation trapped between the surface and the outermost layer of the troposphere. From this figure, it is clear that the outgoing thermal radiation are absorbed more for doubled CO2 forcing case compared to the control experiment. This trapped radiation will certainly be sent back towards earth surface and will play a significant role to warm up the ground surface.
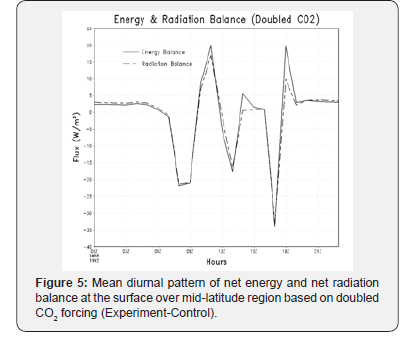
To get a clearer picture of the incoming and outgoing radiation and their impact on ground temperature, the diurnal anomalous pattern of the net energy and net radiation balance over the ground surface is displayed (Figure 5). From this figure one can get a better idea of increasing or decreasing diurnal trend in the difference of ground temperature based on doubling the CO2 compared to control state as is shown in Figure 2.
Here one thing is very much interesting to visualize that both net energy and net radiation balance are in good correlation and both are decreasing after 6 AM and increasing after 9 AM local standard time. Similarly, a minimum energy and radiation balance at about 1:00 PM and 5:00 PM is observed that somehow gives an idea about the decreasing and increasing pattern in the difference of ground temperature during almost the same time (with negligibly small lag) as shown in Figure 2.
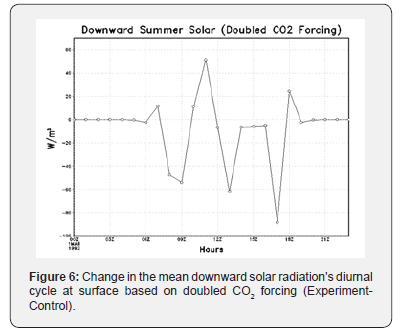
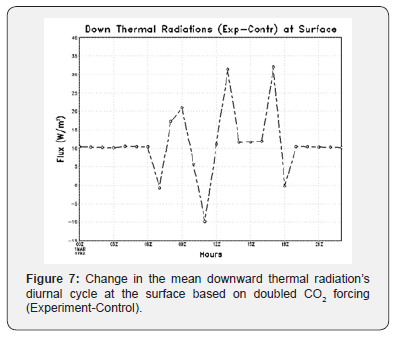
It might be interesting to further look at the diurnal distribution of incident solar as well as downward thermal radiationreaching the ground surface in order to explain how the DTR is changing with respect to these radiation flux changes. Figure 6 & 7 display the amount of downward solar as well as thermal radiation fluxes and their diurnal variations at the ground surface.
From Figure 6, while comparing it with the mean temperature anomaly shown in Figure 2, it is observed that the ground temperature anomaly is decreased when the downward solar radiation at surface are decreased. It indicates that CO2 and water vapors are absorbing some particular part of the solar spectrum (mostly NIR) that is causing a decrease in the ground temperature. Similarly, an increase in surface ground temperature is also observed when downward solar radiation mean anomaly is more. Figure 7 reveals that an increased anomaly of surface upward thermal radiation will result in surface cooling and vice versa. Both the downward solar and downward thermal radiation flux is exactly out of phase, which confirms that the model is producing reasonable response.
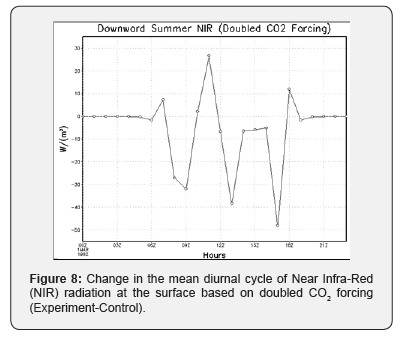
In Figure 8, the diurnal cycle of near infrared radiation at the surface is analyzed in order to understand their role in diurnal climate perturbations over the selected region in summer season. Interestingly it is observed that this near infrared radiation anomaly at the ground after doubling of the CO2 forcing is consistent with the net radiation and downward solar shown in Figure 5 & 6 respectively. The magnitude of NIR is significantly important to notice. From these anomalies it is clear that the NIR band plays major role in affecting DTR compared to other wavelength bands of the solar radiation.
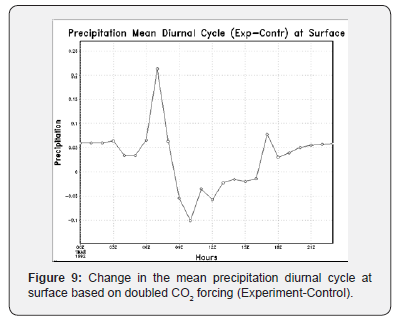
Soil moisture plays much important role for the local convection, also the amount of precipitation on the surface produce significant feedbacks in the regional climate system. Figure 9 displays ten days mean diurnal cycle of precipitation difference based on the doubling of CO2 forcing. The precipitation mean anomaly based on CO2 forcing is showing a significant increase between 6:00 AM to 9:00 AM in the morning which will increase soil wetness and consequently will decrease surface temperature whichis in very good correlation with the downward peak of the ground temperature shown in Figure 2.
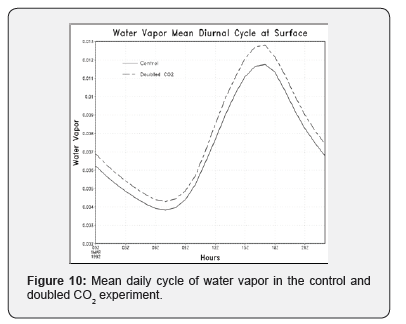
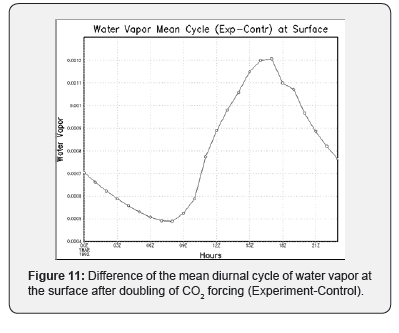
Carbon dioxide is the most frequently mentioned greenhouse gas, but water vapor absorbs infrared heat radiation much more strongly [7,24]. Carbon dioxide is significant because it closes a “window” that would otherwise allow certain infrared wavelengths to escape the earth’s water vapor blanket. Figure 10 is showing the mean daily amount of water vapor in the atmosphere both for the control and doubled CO2 experiment. The corresponding anomaly i.e. difference in the water vapor (experiment- control) is also shown below in Figure 11. From the diurnal pattern of water vapor, a response of land surface to heat trapping forcing is noticed in form of lower water contents in the earlier half of the day and a dramatic increase in the latter half.
Although this study is done over a semi-dry region, the chosen value of the soil wetness in the model (Table 1) is still playing an essential role in form of evaporation when the temperature of the ground surfaces increases as a result of increased CO2 forcing. By analyzing diurnal pattern of evaporation, one can estimate how much water is injected into the atmosphere from the soil. These evaporated water contents will certainly play a vital role in the enhancement of climate feedback process by interacting with outgoing thermal as well as incoming near-infrared solar radiation.
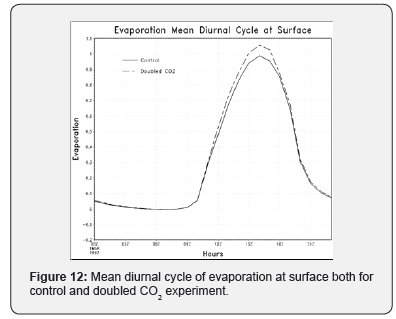
In the early 1980s, Richard Lindzen, a theoretician and professor of meteorology at the Massachusetts Institute of Technology (MIT), turned his attention to the “forcings” and “feedbacks” that water vapor and clouds exert on the climate system. He was interested to find out how the climate as a whole responds to changes in water vapor and cloud cover [25]. Hence, a study of such processes is important for better understanding of the diurnal temperature pattern. Figure 12 shows the diurnal cycle of evaporation both for the control and the doubling of the CO2 experiment. As the incoming solar radiation are more during the daytime that will result in more evaporation as shown by a larger peak having wider amplitude, which becomes highest in the afternoon at 3:00 PM and after that absorption of solar radiation starts decreasing.
In this study, an effort is made to understand the summer sensitivity of mid-latitude dry region to increased CO2 forcing keeping into consideration relevant climate feedbacks. Still, there are many other factors that play a significant role in our climate system, like aerosols and clouds including their concentration and size distribution in the atmosphere. Therefore, a complete understanding of these forcing factors and their feedback process is required to better understand regional DTR asymmetry.
Summary and Conclusion
By using a sophisticated radiative-convective model of the diurnal cycle, the effects of increased CO2 on the diurnal distribution of surface temperature, radiation fluxes, and water contents are evaluated over the mid-latitude semi-dry region. We focus on the mid-latitude semi-dry regions, as the climate of these regions is very sensitive to the radiative perturbations caused by the internal and external climate forcing. This study concludes that CO2 plays a major role in the climatic variability of the mid-latitude semi-dry regions. Single column RCM based results emphasize that CO2 forcing has the tendency to absorb near-infrared (NIR) solar as well as outgoing thermal radiation and therefore impart a significant impact on the diurnal asymmetry of the ground temperature. The effect becomes more dominant in the presence of water vapor in the atmosphere. It is observed that Infrared (IR) forcing contribute mainly to change the diurnal mean temperature, but solar forcing particularly the NIR forcing directly force a change of DTR. The diurnal variability of total energy, as well as thermal radiation balance at surface followed by doubling the CO2 forcing, tell us how much solar energy and thermal radiation are trapped in the atmosphere and which portion is dominating.
Soil moisture under greenhouse warming produces water vapor feedback, which induces a change in the DTR due to NIR absorption. The effect of the decrease in DTR might not be of significance without the presence of water vapors in the atmosphere. It must be counted that this study focusses on a semi-dry region, even then, there is sufficient surface wetness that contributes reasonably towards the release of water vapors into the atmosphere. It is further found that CO2 induced changes in precipitation amount and subsequent evaporation anomaly play a significant role in the asymmetry of DTR. The high value of albedo in the semi-dry regions also causes asymmetry in the diurnal temperature range. Moreover, CO2 induced climatic feedbacks are equally important in producing diurnal asymmetry. Therefore, for better understanding the complete picture of DTR variability, one needs to explore all the possible forcings and feedbacks such as caused by aerosols, water vapors and cloud amount in addition to their distribution in the atmosphere.
Further analysis is suggested to have a complete understanding because there are many other processes involved in the asymmetry of DTR.
Acknowledgment
The author would like to thank Prof. Georgiy Stenchikov, Chairman, Earth Science and Engineering Department, King Abdullah University of Science and Technology for providing access to his single column RCM used in this study.
References
- Dogar MM, Kucharski F, Azharuddin S (2017) Study of the global and regional climatic impacts of ENSO magnitude using SPEEDY AGCM. Journal of Earth System Science 126(2): 30.
- Dogar MM, Stenchikov G, Osipov S, Wyman B, Zhao M (2017) Sensitivity of the Regional Climate in the Middle East and North Africa to Volcanic Perturbations, Journal of Geophysical Research: Atmospheres 122(5): 7922-7948.
- Dogar MM, Kucharski F, Sato T, Mehmood S, Ali S, et al. (2018) Towards understanding the global and regional climatic impacts of Modoki magnitude, Global and Planetary Change 172: 223-241.
- Dogar MM (2018) Impact of tropical volcanic eruptions on Hadley circulation using a high-resolution AGCM, Current Science 114(6): 1284-1294.
- Dogar MM, Sato T (2018) Analysis of Climate Trends and Leading Modes of Climate Variability for MENA Region. Journal of Geophysical Research: Atmospheres 123(23): 13074-13091.
- Wild M, Liepert B (2010) The earth radiation balance as driver of the global hydrological cycle. Environ Res Lett 5(2): 1-9.
- IPCC 2007 Climate Change 2007: The Physical Science Basis. In: S Solomon, D Qin, M Manning, Z Chen (Eds.), Contribution of Working Group I to the Fourth Assessment Report of the Intergovernmental Panel on Climate Change.
- Philipona R, Dürr B, Marty C, Ohmura A, Wild M (2004) Radiative forcing-measured at Earth's surface-corroborate the increasing greenhouse effect. Geophys Res Lett 31(3): L03202.
- Wild M, Grieser J, Schär C (2008) Combined surface solar brightening and increasing greenhouse effect support recent intensification of the global land-based hydrological cycle. Geophys Res Lett 35(17): L17706.
- Braganza K, Karoly DJ, Arblaster JM (2004) Diurnal temperature range as an index of global climate change during the twentieth century. Geophysical Research Letters 31(13).
- Karl TR, Knight RW, Gallo KP, Peterson TC, Jones PD, et al. (1993) A new perspective on recent global warming: asymmetric trends of daily maximum and minimum temperature. Bulletin of the American Meteorological Society 74(6): 1007-1023.
- Easterling DR, Briony H, Philip DJ, Thomas CP, Thomas RK, et al. (1997) Maximum and minimum temperature trends for the globe. Science 277(5324): 364-367.
- New M, Hulme M, Jones P (2000) Representing twentieth-century space-time climate variability. Part II: development of 1901-96 monthly grids of terrestrial surface climate. J Clim 13: 2217-2238.
- Jin M, Dickinson RE (2002) New observational evidence for global warming from satellite. Geophys Res Lett 29(10): 1-4.
- Dai A, Fung IY, Del GenioAD (1997) Surface observed global land precipitation variations during 1900-88. Journal of Climate 10(11): 2943-2962.
- Dai A, Trenberth KE, Karl TR (1999) Effects of clouds, soil moisture, precipitation, and water vapor on diurnal temperature range. J Clim 12: 2451-2473.
- Durre I, Wallace JM, Lettenmaier DP (2000) Dependence of extreme daily maximum temperatures on antecedent soil moisture in the contiguous United States during summer. Journal of climate 13(14): 2641-2651.
- Whan K, Zscheischler J, Orth R, Shongwe M, Rahimi M, et al. (2015) Impact Of Soil Moisture On Extreme Maximum Temperatures In Europe. Weather and Climate Extremes 9: 57-67.
- Gallo KP, Owen TW, Easterling DR, Jamason PF (1999) Temperature trends of the US historical climatology network based on satellite-designated land use/land cover. J Clim 12: 1344-1348.
- Stone D, Weaver A (2003) Factors contributing to diurnal temperature range trends in twentieth and twenty-first century simulations of the CCCma coupled model. Climate Dynamics 20(5): 435-445.
- Stenchikov GL, Robock A (1995) Diurnal asymmetry of climatic response to increased CO2 and aerosols: Forcings and feedbacks. J Geophys Res 100(26): 26211-26227.
- Harrison EF, Patrick M, Bruce RB, Gary GG (1993) Radiation budget at the top of the atmosphere. Atlas of Satellite Observations Related to Global Change.
- Magarey RD, Russo JM, Seem RC (2006) Simulation of surface wetness with a water budget and energy balance approach. Agricultural and Forest Meteorology 139(3-4): 373-381.
- Herring D (2002) Does the Earth Have an Iris Analog?” NASA Earth Observatory.
- Lindzen RS, Hou AY, Farrell BF (1982) The role of the convective model choice in calculating the climate impact of doublinCO2 J Atmos Sci 3(9): 1189-12051.


