Genetic Variations of Nine Malay Sub-Ethnic Groups In Peninsular Malaysia Using 15 Autosomal Short Tandem Repeat (Str) Analysis
Aedrianee Reeza Alwi1, Panneerchelvam Sundararajulu2, Norazmi Mohd Nor2 and Zafarina Zainuddin*2,3
1Department of Chemistry Malaysia Johor, Jalan Abdul Samad, Malaysia
2Human Identification/DNA unit, School of Health Sciences, Health Campus, University Sains Malaysia, Malaysia
3Analytical Biochemistry Research Center, University Sains Malaysia, Malaysia
Submission: July 02, 2017; Published: July 26, 2017
*Corresponding author: Zafarina Zainuddin, Analytical Biochemistry Research Center, University Sains Malaysia, 11800 Minden, Penang,Malaysia, Tel: +604-6536176; Fax: +604-6534688; E-mail: zafarina@usm.my
How to cite this article: Aedrianee R A, Panneerchelvam S, Norazmi M N, Zafarina Z. Genetic Variations of Nine Malay Sub-Ethnic Groups In Peninsular Malaysia Using 15 Autosomal Short Tandem Repeat (Str) Analysis. J Forensic Sci & Criminal Inves. 2017; 4(1): 555626. DOI: 10.19080/JFSCI.2017.04.555626
Abstract
The Malay population of Peninsular Malaysia consists of various sub-ethnic groups due to years of immigration and assimilation of various ethnicity and tribes within maritime of Southeast Asia. In this study, a total of 290 blood samples were collected from 9 Malay sub-ethnic groups in Peninsular Malaysia, which includes Acheh, Champa, Rawa, Kedah, Minangkabau, Bugis, Jawa, Banjar and Kelantan. The blood samples were spotted onto FTA® Classic Card. The genetic variations for 15 autosomal short tandem repeat (STR) using the AmpFlSTR® Identifier® Polymerase Chain Reaction (PCR) Amplification Kit were analyzed using statistical softwares. The allele frequencies for these Malay sub-ethnic groups are polymorphic based on the high value of gene diversity (GD), power of discrimination (PD), power of exclusion (PE) and polymorphic information content (PIC) observed. No significant departure from Hardy-Weinberg equilibrium (HWE) was seen among the sub-ethnic groups. Genetic relationship analysis with other world populations indicates close relationship with Indonesia, Thailand and Philippines populations.
Keywords: Short tandem repeat (STR); Malay; Sub-ethnic; Identifiler; Allele frequency
Abbreviations: STR: Short Tandem Repeat; PCR: Polymerase Chain Reaction; GD: Gene Diversity; PD: Power of Discrimination, PE: Power of Exclusion; PIC: Polymorphic Information Content; HWE: Hardy-Weinberg Equilibrium
Introduction
Human identification using specific regions of deoxyribonucleic acid (DNA) within the human genome has emerged as a powerful evidentiary tool in the criminal justice system. The well-developed techniques enable individualization of human especially in forensic cases done in a fast and accurate manner. DNA contains the blueprint of life called the genetic code that stores information necessary for passing down genetic attributes to future generations [1]. A complete set of genetic information (DNA content) of a human diploid cell is called human genome. Nuclear genome provides essential genetic information encoded as DNA sequences within the 23 chromosome pairs in cell nuclei. The DNA material in chromosomes is composed of coding (~10%) and non-coding regions (~90%). The coding regions contain information for a cell to make proteins while the regions that do not code for proteins are known as ‘junk’ DNA [2]. Surprisingly, these are the regions where the markers for human identity testing are found either between genes or within genes. Various polymorphic markers were found throughout the non-coding regions of the human genome. Sir Alec Jeffreys discovered that certain regions of DNA contained DNA sequences that were repeated over and over again next to each other in tandem array while studying the gene coding for myoglobin [3]. He then described this discovery as DNA fingerprinting or DNA profiling as it is now known [1].
In the past two decades, a number of autosomal STR markers have been used in forensic DNA typing. STR is also known as microsatellite and it has shorter repeat units in the range of 2 to 7 base pairs (bp) [1]. Autosomal STR utilizes DNA from the 22 pairs of autosomal chromosomes. They are chosen from separate chromosome or widely spaced on the same chromosome to avoid any problems with linkage between the markers [4]. The number of repeats in STR markers is highly variable among individuals, which make these STRs effective for human identification purposes [5]. STR loci with a high degree of heterozygosity and a high level of polymorphism are preferred for human identification in order to obtain the ability to discriminate between individuals [6].
Malaysia ranked 67as the largest country by total land area of 329,847 km2 (127,355 sq mi) [7]. Malaysia has thirteen states and three federal territories. West Malaysia consists of eleven states and two federal territories, which are located in the peninsula, whereas East Malaysia consists of two states and one federal territory. The Malaysian population is currently being estimated as 31.7 million in the year 2016 as compared to 31.2 million in 2015 [8]. Malaysia's population comprises many ethnic groups, with the bumiputera make up 68.6% of the total population. Bumiputerais a term to describe the Malay race and indigenous peoples of Sabah and Sarawak. Malay is the largest ethnic group in Malaysia and according to the federal constitutional of Malaysia, Malay is defined as an individual who profess Islam, habitually speaks Malay and practice Malay customs and culture [7].
Among the Malays, there are various sub-ethnic groups, which are rich in diversity in term of genetics, linguistic and cultural mainly due to years of immigration and assimilation of various ethnicity and tribes within maritime of Southeast Asia. The Malay sub-ethnic groups are believed to have different ancestral origins based on their migration centuries ago [9]. Most of the Malays in Peninsular Malaysia today are descendants of various ethnic groups from Kalimantan, Java, Sulawesi and Sumatera [7]. Various migration patterns of the sub-ethnic groups in Peninsular Malaysia have been established and published [9,10]. The current locations of Malay sub-ethnic groups within Peninsular Malaysia have become wide and large.
The Minangkabau Malays in Peninsular Malaysia mostly settled in Negeri Sembilan, especially in Sungai Ujong and Rembau [7]. The Minangkabaus formed over 40 percent of the Sumatran population in Malaya. The Minangkabaus also claimed that they were the first to settle in Ulu Langat [11]. The Rawa Malays first came to Peninsular Malaysia in the late 1820's [12]. The Rawa people are mostly found around Gopeng, Perak and several parts in Selangor [7]. The Bugis from South Sulawesi formed the fifth largest Indonesian group in Peninsular Malaysia [11]. The Buginese is the main ethnic group of South Sulawesi of Indonesia [13]. Majority of the Bugis came into Peninsular Malaysia via various Bugis settlements in Kalimantan, Singapore and Johor. The Banjar Malays, originated from Banjarmasin, Kalimantan mostly populated Kerian and ParitBuntar (Perak), SabakBernam (Selangor) and BatuPahat (Johor) [7,11]. The Jawa people, mostly from the Java Island, have migrated to various districts in Johor (Pontian, BatuPahat and Muar) followed by Malacca and then extended towards Kuala Langat and Kuala Selangor [11]. They are the most numerous Malay sub-ethnic group in Peninsular Malaysia.
The Kelantan Malay is a sub-ethnic group of Malay that is natives to the state of Kelantan as well as in the northern Terengganu. Historically, Kelantan had a strong relationship with the Pattani Kingdom [10,14]. The Kelantan Malays are seen as different from other Malay sub-ethnic groups in Peninsular Malaysia since they have an ancestry that is more divergent than other Malay populations due to their historical links and geographical location at the northern part of the Peninsular [15] The Chams in Malaysia are descendants of the community found in Cambodia and Vietnam and they can be found especially in Pahang, Kelantan, Terengganu, Selangor and several other states in Peninsular Malaysia. They migrated from Indochina to Malaysia due to the attacks from the northern to southern parts of the Kingdom, which are now known as Vietnam and Cambodia [16]
The Kedah Malays mostly live in the northern states of Peninsular Malaysia. They originated from the earliest settlement in Kedah state [10], known as LembahBujang. The Achinese is one of the Malay sub-ethnic groups that came from the north most tip of the island of Sumatra. The Acheh Malays entered Malaysia through Penang and settled in northern part of Peninsular Malaysia. The Sumatrans who migrated to Selangor, Perak and Negeri Sembilan mostly came through Port Swettenham, Telok Anson and Malacca, respectively [11].
This study is primarily focusing on genetic analysis using autosomal STR for nine Malay sub-ethnic groups in Peninsular Malaysia namely Acheh, Bugis, Banjar, Jawa, Rawa, Minangkabau, Kedah, Kelantan and Champain order to distinguish the allele and genotype variations at the 15 autosomal STR loci. The HWE for the selected DNA markers and the database variation characteristics from statistical parameters which includes PD, PIC, PE and GD were evaluated to study the genetic variations among them. Comparison of genetic affinity of this population groups with other world populations and also with the previous molecular genetic studies is also part of the objectives of this study.
Materials and Methods
Biological samples collection
Blood specimen samples from 290 unrelated individuals belonging to nine (9) different Malay sub-ethnic groups namely Acheh (n=11), Champa (n=17), Rawa (n=23), Kedah (n=26), Minangkabau (n=34), Bugis (n=30), Jawa (n=28), Banjar (n=32) and Kelantan (n=89) were collected at various geographical locations within Peninsular Malaysia. The volunteers were briefed about the studies and they were selected based on an interview in order to ascertain their ancestry. The participant must not have any mixed background for at least three generations. An informed consent was obtained and approximately 5 ml of peripheral blood specimen was collected in heparin-coated tube from each volunteer. To further preserve the DNA in the blood specimens, each blood specimen was spotted onto an FTA® Classic Card [17] in two spots of approximately 150 βl of liquid blood specimen per spot for further analysis. The ethics approval for this project was obtained from the Human Research Ethics Committee, University Sains Malaysia (USMKK/PPSP®/JK P&E).
In-situ DNA extraction
In-situ DNA extraction was carried out for the FTA disc (1.2 mm) where it involves purification of red-heme from the bloodstain using 10 mM NatriumHyroxide and Tris-EDTA buffer.
PCR amplification
The AmpFlSTR® Identifiler® PCR Amplification Kit (Applied Biosystems) was used for the 15 autosomal STR typing which consist genetic locus for gender determination, (Amelogenin), and 15 genetic loci, namely D8S1179, D21S11, D7S820, CSF1PO, D3S1358, TH01, D13S317, D16S539, D2S1338, D19S433, vWA, TPOX, D18S51, D5S818 and FGA. PCR reactions were set up according to the manufacturer’s recommendation with slight modifications on the GeneAmp® PCR 9700 system thermal cycler (Applied Biosystems).
Capillary electrophoresis
The amplified products were separated by capillary electrophoresis on the 3130xl genetic analyzer (Applied Biosystems) using the 3130xl data collection software (Applied Biosystems). Fragment analysis was carried out by using Gene Mapper ® ID Software Version 3.1 as outlined by Applied Biosystems user manual 2003.
Statistical analysis
The allele frequencies, gene diversity (GD), exact test of HWE, analysis of molecular variance (AMOVA) and F-statistics; population fixation index (FST ), inbreeding coefficient (FIS) and overall fixation index (FIT ) analyses were carried out using the Arlequin version 3.5.1.2 [18] and Gen AlEx 6.5 [19] software. The calculation for PD, PE and PIC were carried out using Power Stats Software [20]. The phylogenetic tree was constructed using PHYLIP (the PHYLogenyInference Package) version 3.69 [21] and the TREEVIEW software version 1.6.6 [22] was used to visualize the constructed phylogenetic tree. The Principal component analysis (PCA) was achieved by using the MultiVariate Statistical Package (MVSP) version 3.2 [23].
Results
The 15 autosomal STR profiles from 290 individuals comprising nine (9) Malay sub-ethnic groups selected for this study was successfully obtained. The allele frequencies are presented in (Tables 1-9) and the values for PD, PE, PIC and GD were also included in these tables. The gene diversity values of the separate locus ranged between 0.47338 (TPOX) and 0.91775 (D2S1338) across the nine Malay sub-ethnic groups. The gene diversity for locus TPOX was the lowest as compared to other loci. The most polymorphic locus among the 15 autosomal STR loci for the sub-ethnic groups was D2S1338. All sub-ethnic groups indicated a PD value more than 0.900 for this particular locus. The highest PD for this locus was observed in the Kelantan Malays (0.953). High value of PD was also observed for STR loci D8S1179 and D21S11. The lowest PD values were observed at TPOX locus for Jawa (0.645), Acheh (0.678), Banjar (0.736), Minangkabau (0.747), Kelantan (0.784) and Rawa (0.786). The PD value is lower at STR loci CSF1PO in Acheh (0.678) and Bugis (0.787). The 15 autosomal STR loci showed a combined PD of 1 in 4.809 x 10¹³, 1 in 4.352 x 10¹⁴, 1 in 4.871 x 10¹⁴, 1 in 2.493 x 10¹⁶, 1 in 8.439 x 10¹⁶, 1 in 1.910 x 10¹⁵, 1 in 1.877 x 10¹⁷, 1 in 5.519 x 10¹⁵ and 1 in 9.020 x 10¹⁶ for Acheh, Champa, Rawa, Kedah, Minangkabau, Bugis, Kelantan, Jawa and Banjar, respectively.
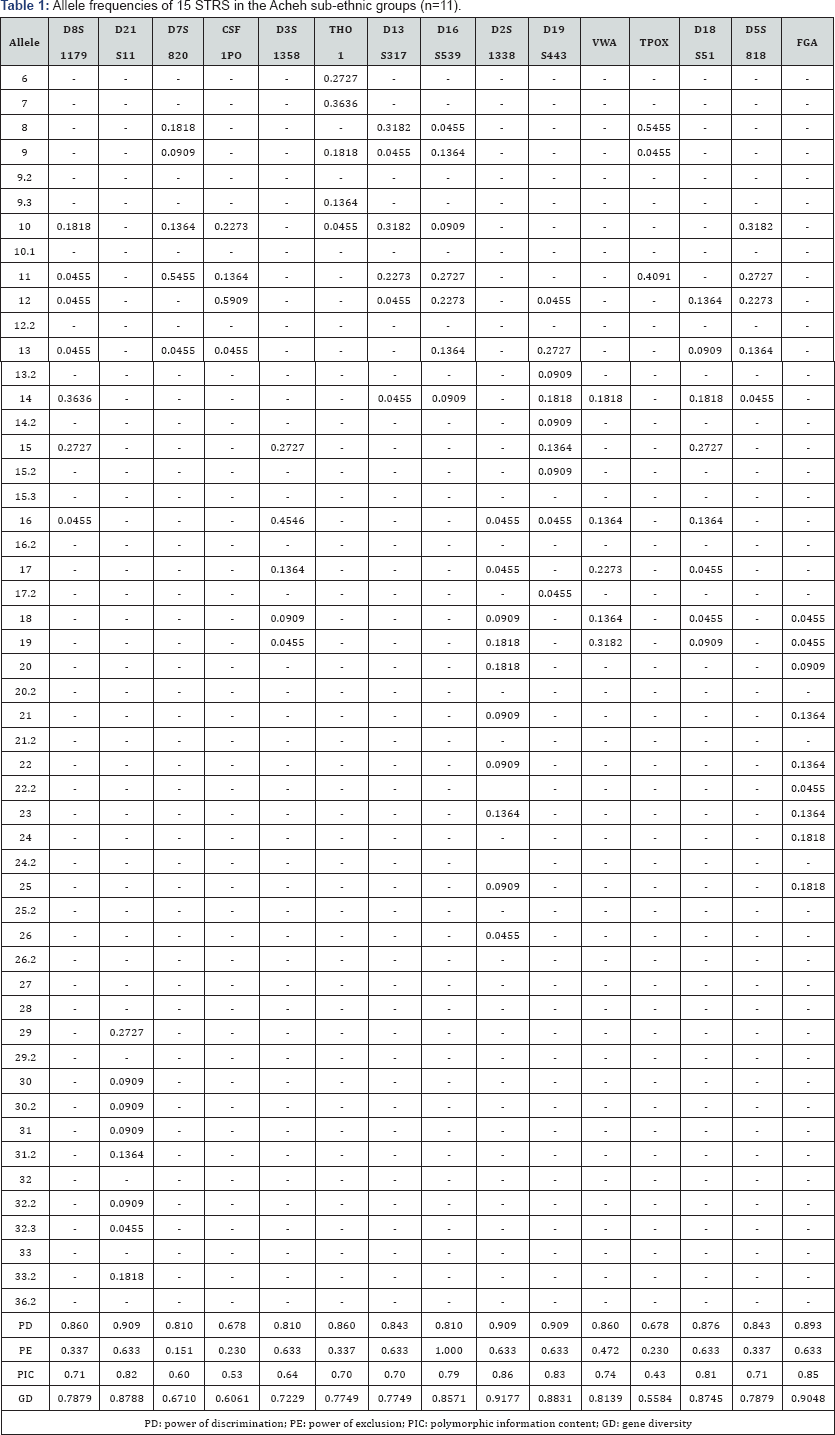
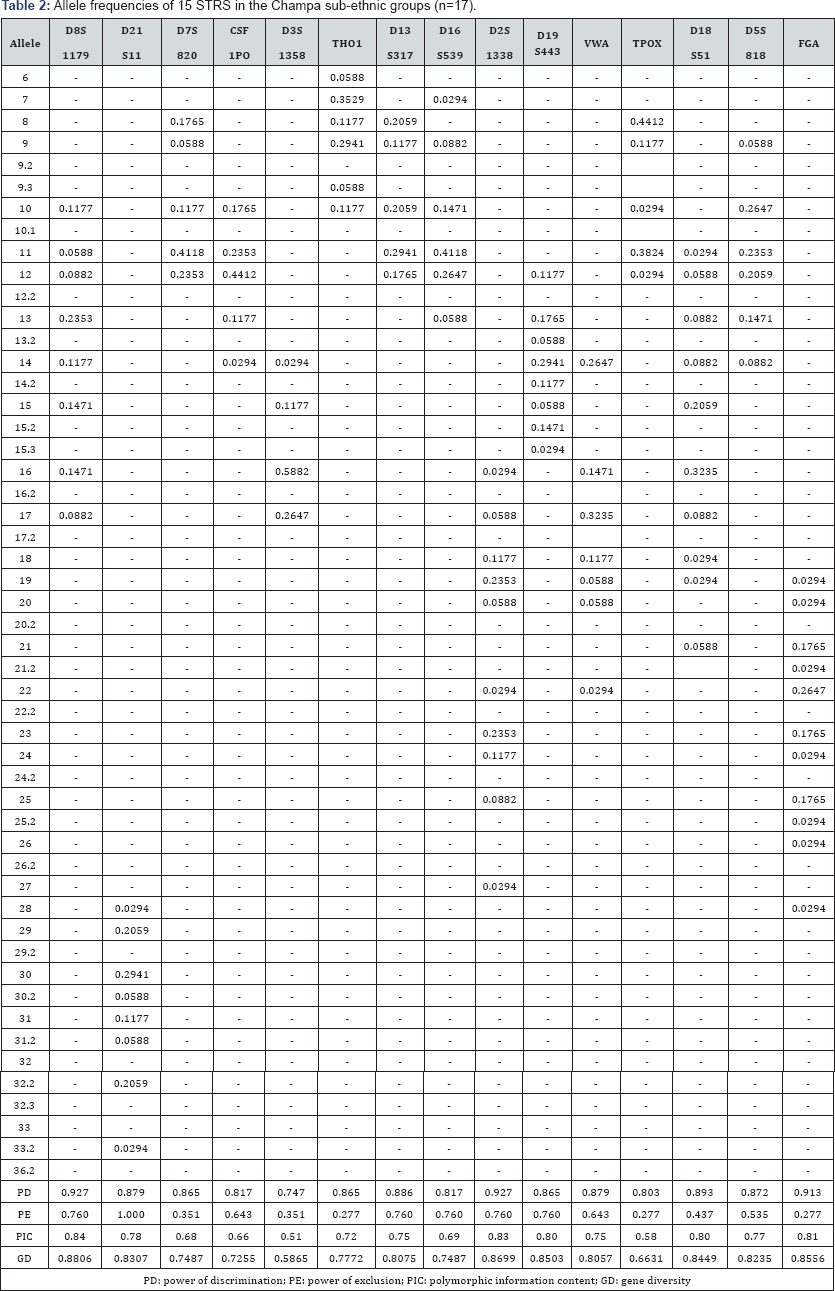
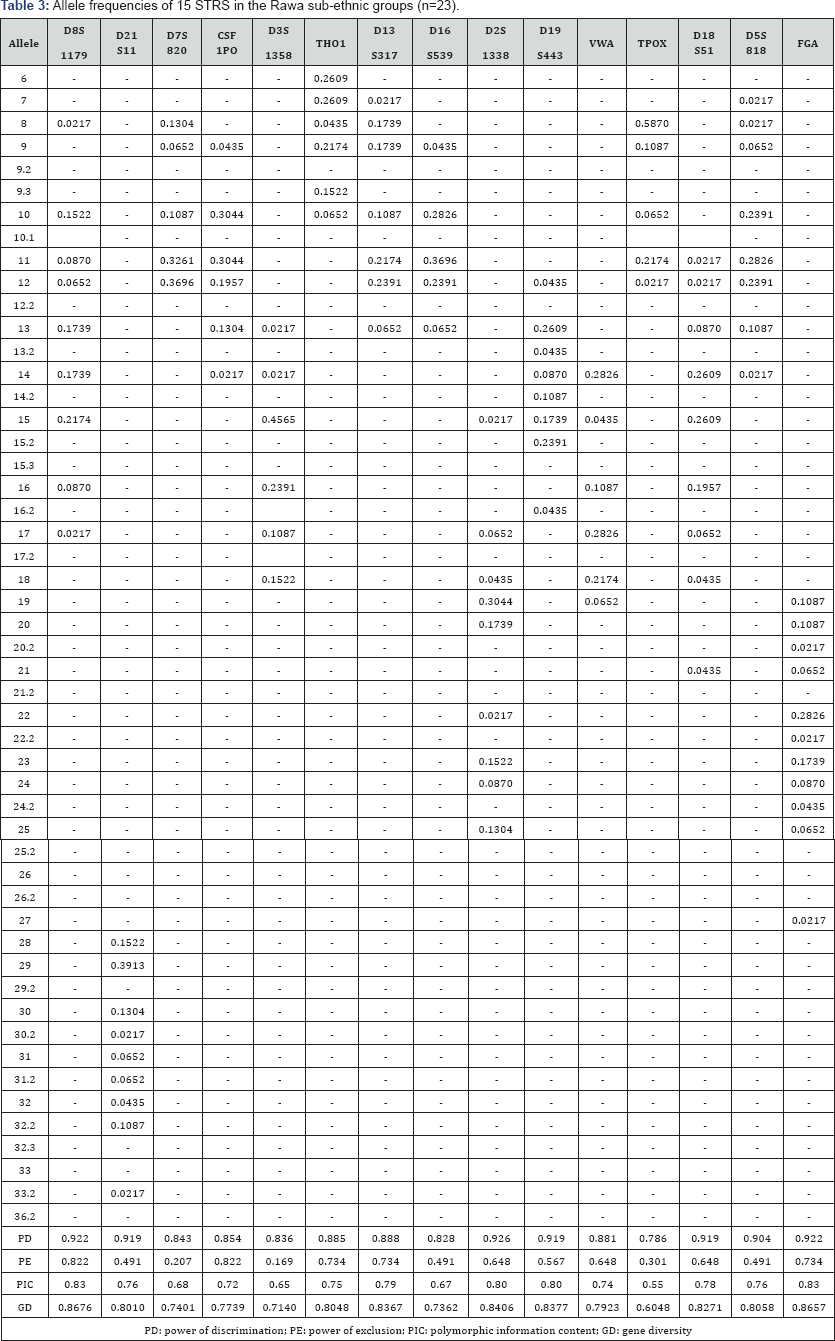
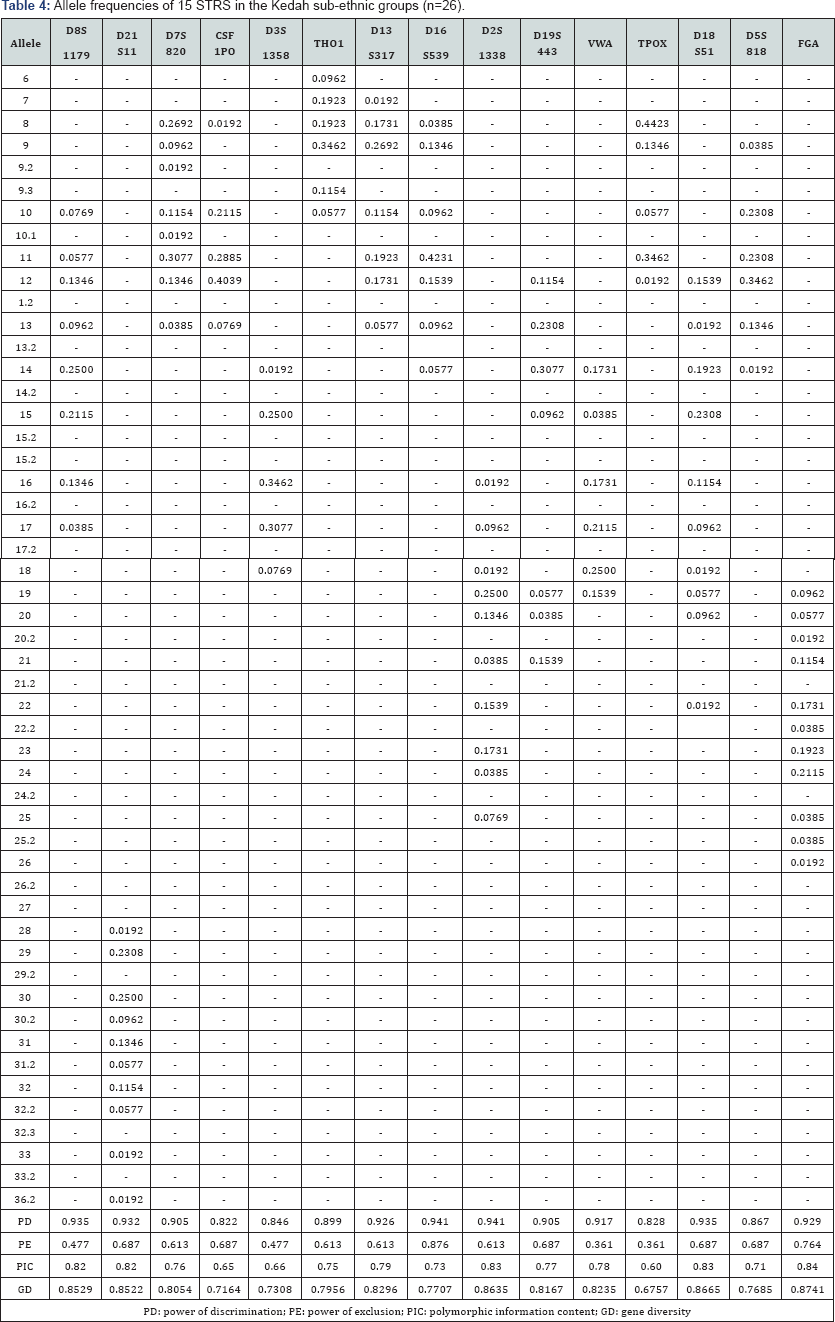
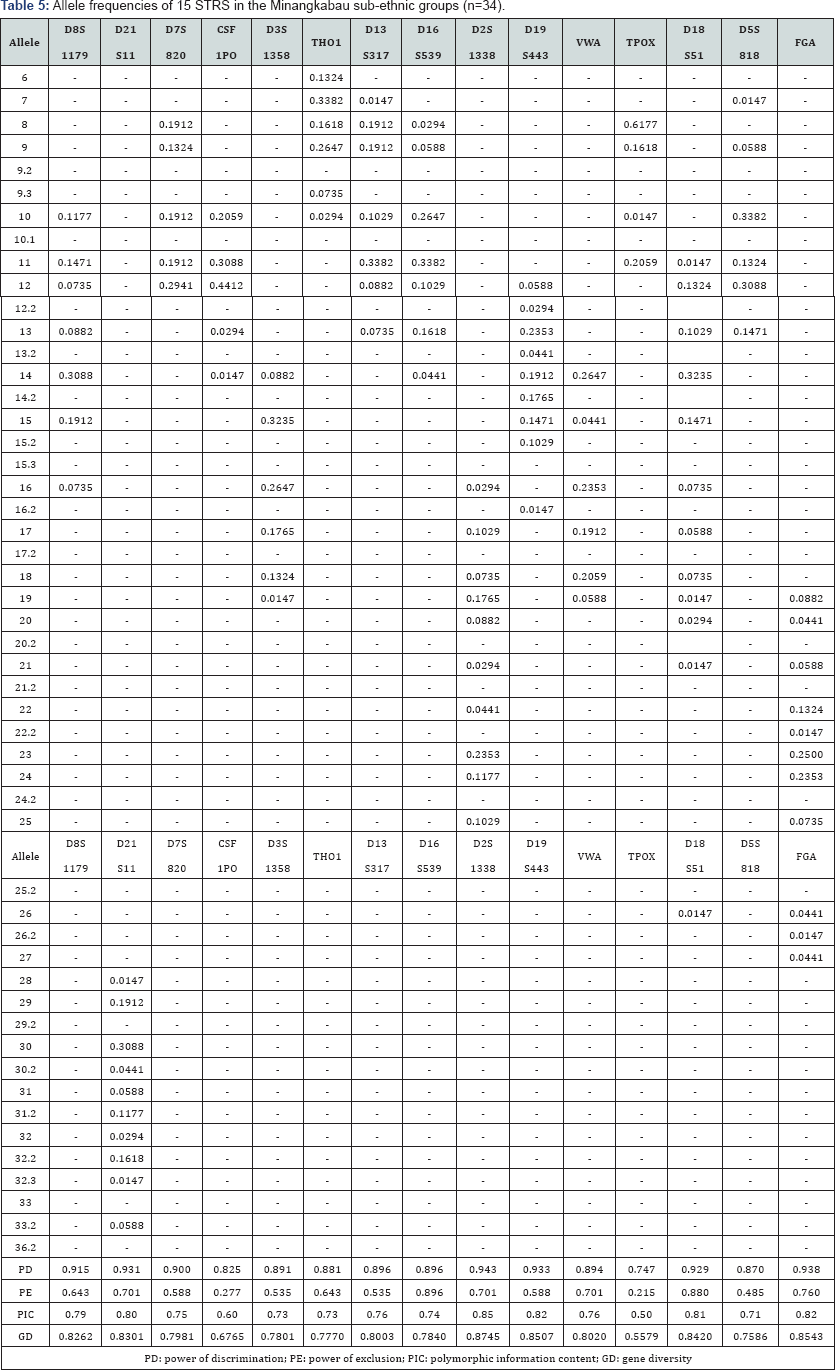
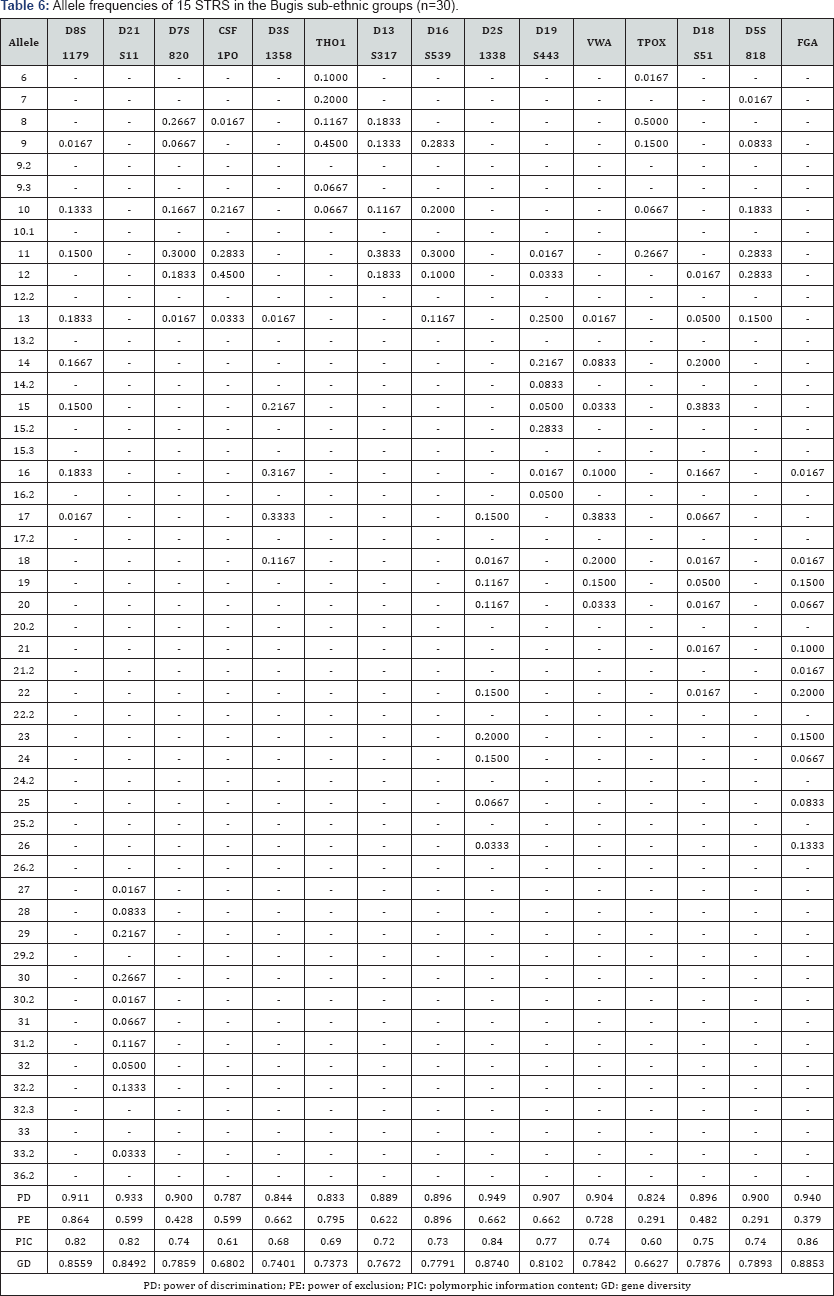
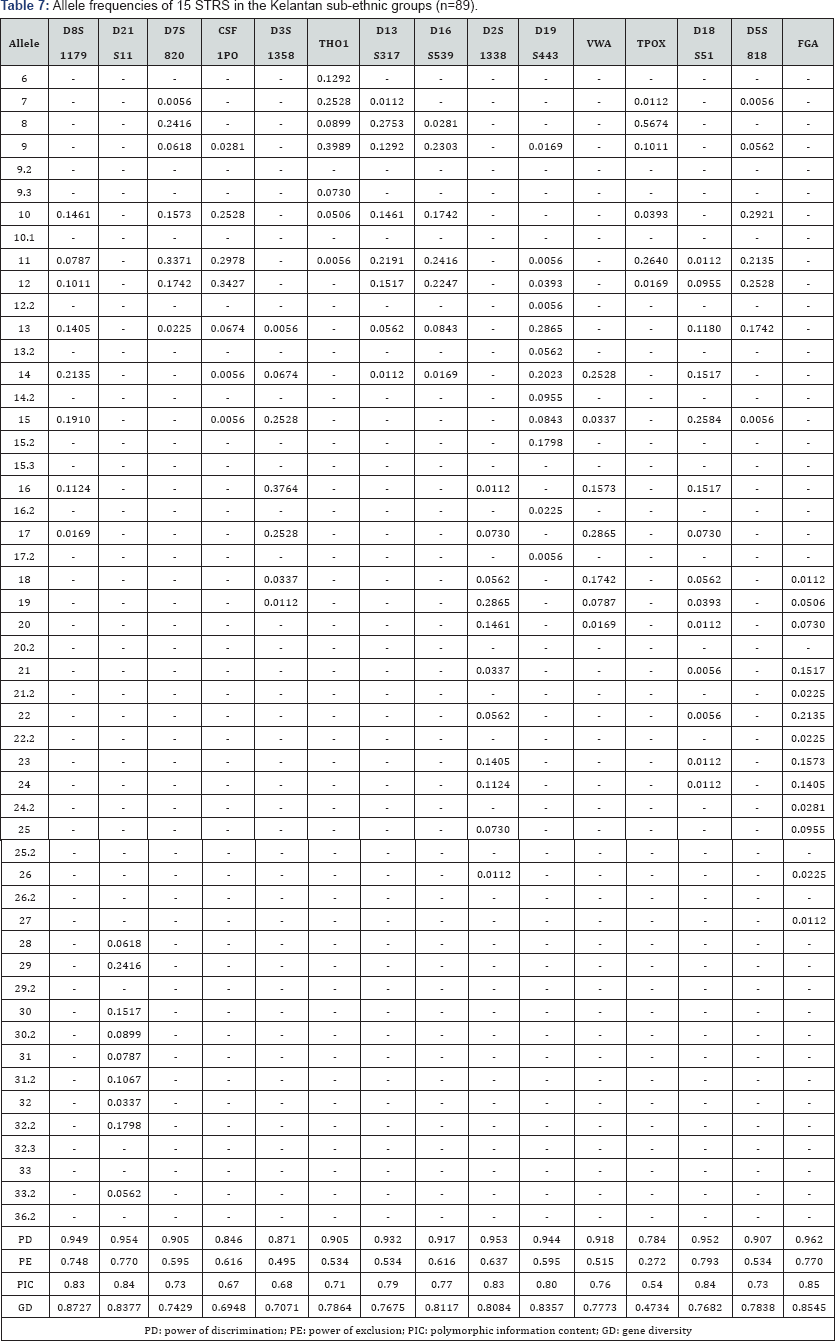
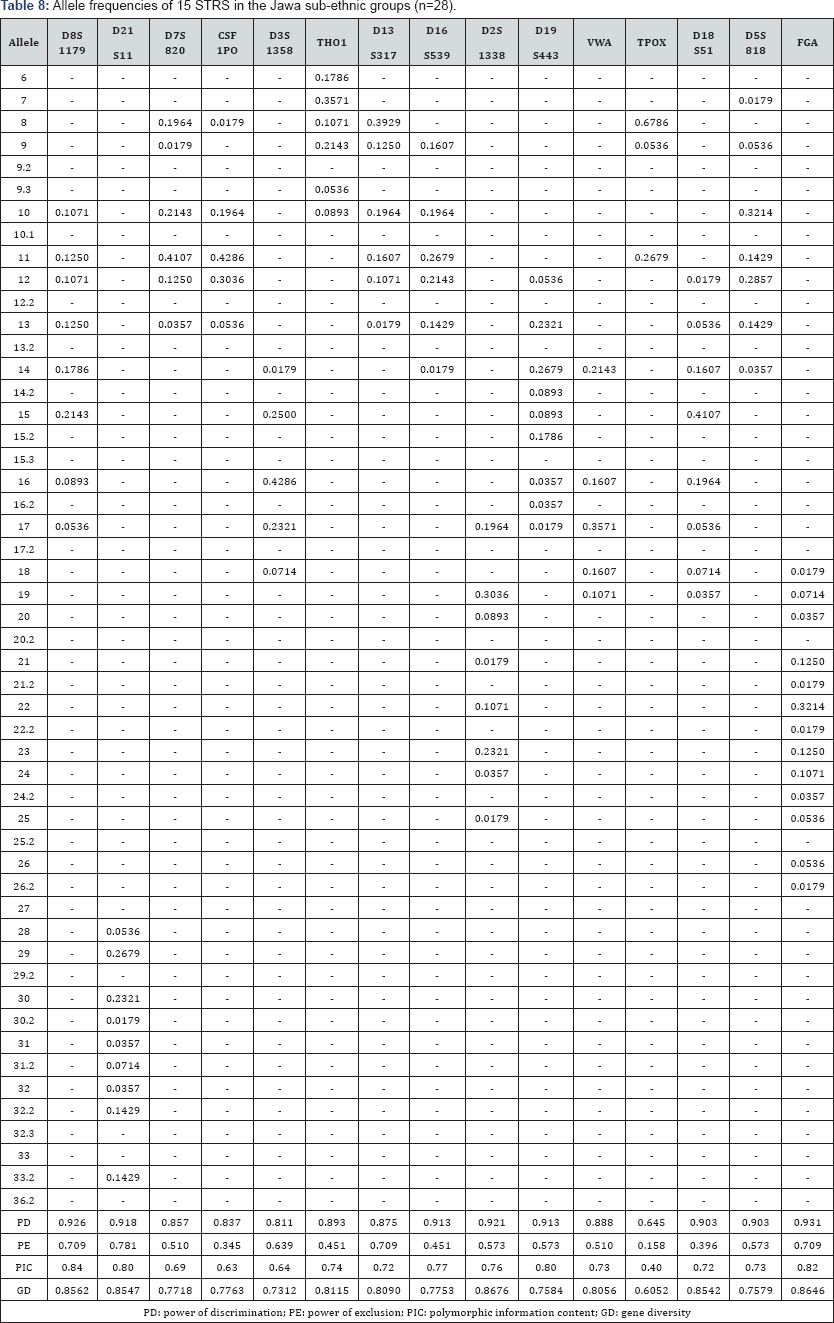
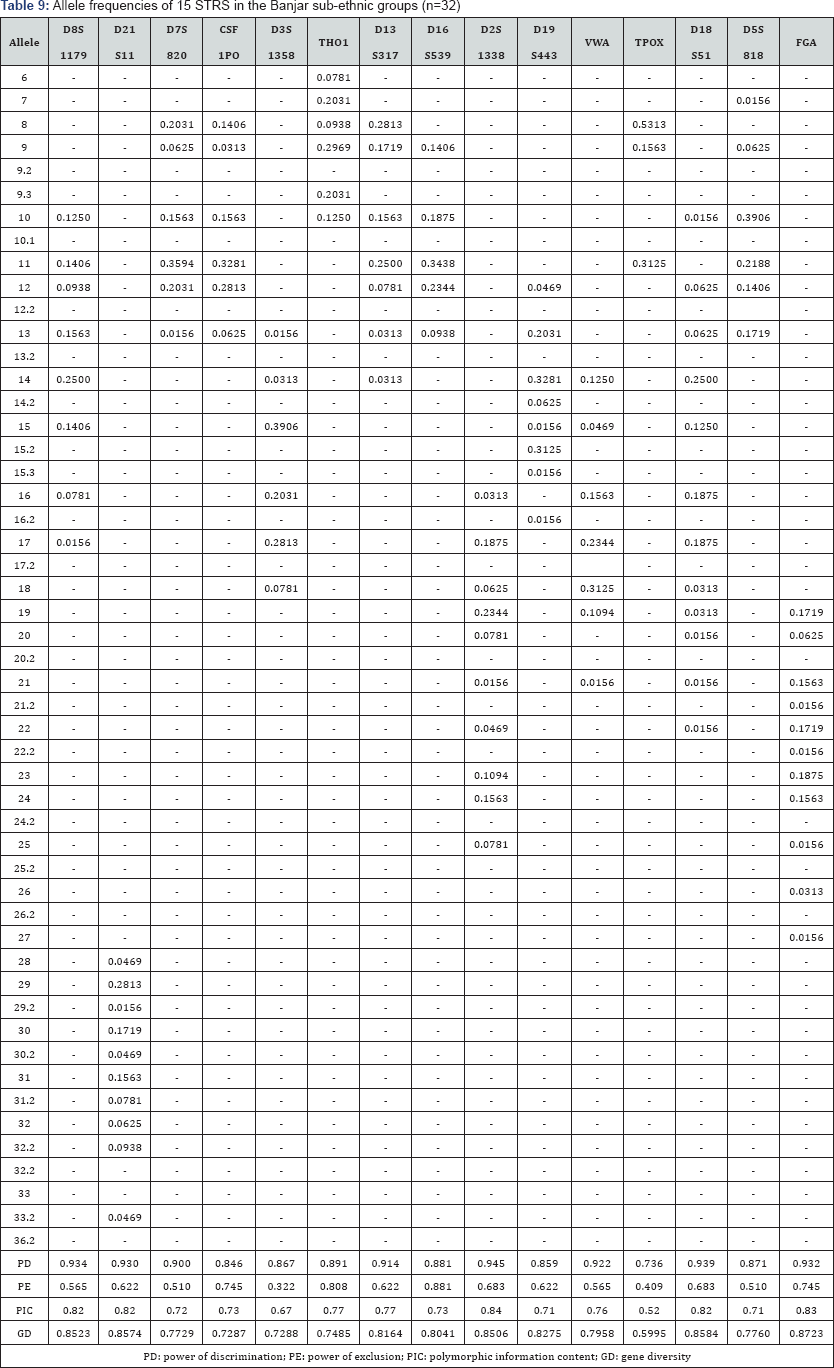
In this study, STR locus FGA demonstrate the highest PIC value of 0.86 (Bugis), followed by 0.85 (Kelantan &Acheh), 0.84 (Kedah), 0.83 (Rawa&Banjar), 0.82 (Minangkabau&Jawa) and 0.81 (Champa). In Jawa and Acheh Malays, the lowest PIC values were observed at STR locus TPOX with a value of 0.40 and 0.43, respectively.
Slightly different patterns were observed for the PE values across the nine Malay sub-ethnic groups. PE values of 1 were recorded in Acheh at locus D16S539 and in Champa at locus D21S11. For Kedah, Minangkabau, Bugis and Banjar also recorded highest PE value at locus D16S539. The lowest PE value of 0.151 was observed in Acheh at locus DS7820. Combined power of exclusion for the nine Malay sub-ethnic groups is as follow; 0.99999 (Acheh), 0.99994 (Champa), 0.99995 (Rawa), 0.99957 (Kedah), 0.99976 (Minangkabau), 0.99981 (Bugis), 0.99968 (Kelantan), 0.99996 (Jawa) and 0.99952 (Banjar), respectively.
The AMOVA analysis for the 15 autosomal STR loci is shown in Table 10. The AMOVA results indicated that 0.65% of the total genetic variation is due to differentiation among populations and 0.68% is due to differentiation among individuals within populations. The remaining 98.66% of the total genetic variation is due to differentiation within the individuals.
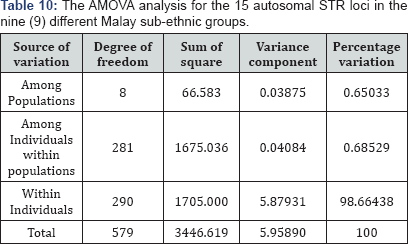
Average F-statistics values were calculated for all 15 autosomal STR loci in the nine (9) Malay sub-ethnic groups. The FST value was 0.00650 and this range of value indicated a little genetic differentiation. The inbreeding coefficient (F IS ) was 0.00690 across all 15 autosomal STR loci, which indicates low genetic deviation. The value for overall fixation index (FIT ), which measure the deviation from HWE in total population was 0.01336, thus indicating that there is only little genetic differentiation [24].
The exact test of HWE using a Markov chain was used to investigate the deviations from HWE in the nine Malay subethnic groups for the entire fifteen genetic loci. In this test, the p-value <0.05 indicates deviation from HWE. The results showed that the Malay sub-ethnic groups are in HWE at almost all loci except for D7S820 in Rawa Malays (p-value = 0.00896), CSF1PO in Kelantan Malays (p-value = 0.0031533), D3S1358 in Rawa Malays (p-value = 0.00877), D13S317 in Minangkabau Malays (p-value = 0.03214), D19S443 in Champa Malays (p-value = 0.03695) and FGA (p-value= 0.0252) in Bugis and Champa Malays (p-value= 0.01870).
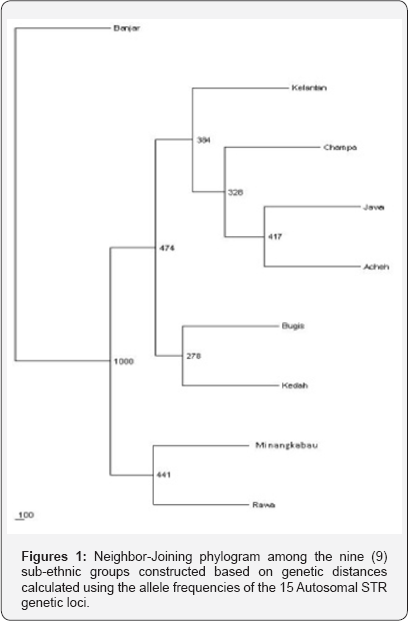
Numbers above branches are node support after the bootsrap technique in PHYLIP package program SEQBOOT with 1000 replicates.
The neighbor-joining phylogram in (Figure 1) demonstrates the relationship between the nine (9) Malay sub-ethnic groups. The Kelantan, Champa, Jawa and Acheh Malays are clustered together, indicating close genetic relationship based on the allelic frequencies data. The Bugis and Kedah Malays seemed to be close to each other despite their geographical locations. The Bugis are mostly from the southern part of the peninsula where else the Kedah is from the northern of Peninsular Malaysia. The phylogenetic tree also indicates that the Minangkabau and Rawa Malays having close genetic relationship. (Figure 2) shows a neighbor-joining cladogram constructed with the combined Malay population (CMP; combining the 9 Malay sub-ethnic groups), 9 Malay sub-ethnic groups and other world population. It was found that the Malays, as a whole, have a close genetic relationship with the Indo Java (Indonesia), Thailand and Philippines.
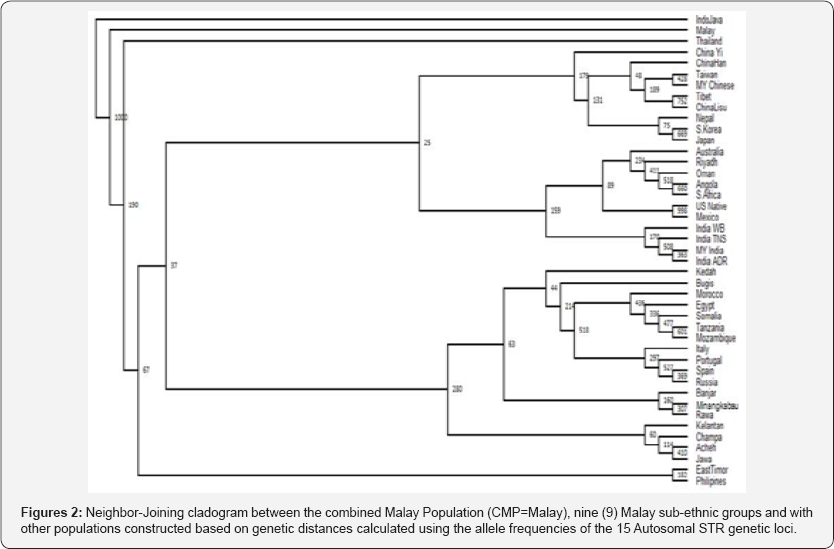
Numbers above branches are node support after the bootsrap technique in PHYLIP package program SEQBOOT with 1000 replicates.
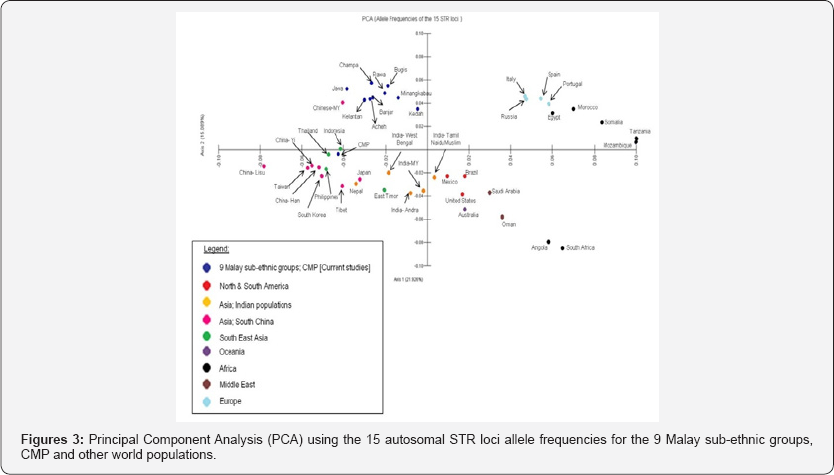
PCA was carried out using allele frequencies of the fifteen Autosomal STR genetic locus data from the nine Malay subethnic groups, CMP and other world populations. The scatter plot is in two-dimensional based on the distance between every pairs of populations and dissimilarities between them, as shown in (Figure 3). The variability was 15.089% and 21.0926% for Axis 1 and Axis 2, respectively. The nine sub-ethnic groups are plotted together and proximate to the Malaysian Chinese population. However, when the nine Malay sub-ethnic groups were combined as a population (CMP), the group is plotted adjacent to the Indonesia, Thailand, Philippines and the Chinese from the mainland of China.
Discussion
The allele frequencies of the autosomal STR for the Malay sub-ethnic groups demonstrate similar distribution pattern with previous studies on random Malays [25-27]. The lowest GD among the nine Malays sub-ethnic groups was seen in TPOX locus and this result was found similar to other populations studied [28]. As for locus D2S1338, it was a highly polymorphic locus thus giving high genetic variation within individuals and population.
Previous studies on random Malays also indicated that locus D2S1338 gave the highest PD value [27]. Generally the STR loci D2S1338, D8S1179, D21S211 and FGA are the most informative locus since it has more allelic number than others. These loci were also being reported [28,29] as the most discriminating loci in other population. The best polymorphic systems to use for identification are those with a large number of genotypes and with frequencies evenly distributed among the various types [6] TPOX showed the least power of discrimination between individuals based on the previous studies on similar population groups in Malaysia and Singapore [25,29]. These findings are in close agreement with similar populations in South East Asia, Hong Kong and India [29]. A high value of combined PD among the studied groups indicates the ability to discriminate two people at a locus and was in support with the theory that no two individuals would have the same genotype except identical twins [6]. It was found that FGA has high PIC value among the nine Malay sub-ethnic groups. The combined PE value obtained in this study was in concordance with the previous studies on Malay population [25-27].
There is no significant deviation from HWE and little genetic differentiations were observed among the nine Malay sub-ethnic groups. The deviations at particular loci may suggest problem in the population structure since the Malay population comprises various sub-ethnic groups [9] and may have some degree of genetic differentiation among the subpopulations. The bootstrap values in the phylogenetic tree for most of the nodes are below 50%. Therefore, it is not possible to discuss the genetic relationship among these sub-ethnic groups with certainty. However, high similarities between the Minangkabau and Rawa Malays have been demonstrated previously using HLA markers[7] . This could be due to their common origin from Sumatra. Based on the autosomal STR data, the Banjar Malays were partly differentiated from the other sub-ethnic groups. This finding contradicts with previous studies [7,9,30,31] on Malays, which indicated that the Kelantan Malays were genetically different from the other Malay sub-ethnic groups.
Close genetic relationship of the nine Malay sub-ethnic groups with the Indo Java (Indonesia), Thailand and Philippines in this study was found to be in agreement with previous studies [27] where the Malay population was classified into a different monophyletic cluster, which includes the Indonesian populations. The PCA generated had a similar pattern with the cladogram (Figure 2) generated earlier, thus indicating that the association made based on the genetic distance of the Malay subethnic groups to other populations are reliable. These findings were in accord with previous population genetics studies [7,29,30-32] on the genetic relationship of Malay population with other Asian populations.
Conclusion
The 15 autosomal STR markers across the nine Malay sub-ethnic group's exhibit high heterogyzosity, high power of discrimination and high polymorphism information contents. Further studies may incorporate higher number of samples for each sub-ethnic group and may also include other Malay subethnic groups for a more comprehensive study of the major population in Peninsular Malaysia.
Acknowledgement
We would like to thank all the participants involved in the present study and the Forensic Division Department of Chemistry for the assigned MOU with University Sains Malaysia. This study was funded under the Fundamental Research Grant Scheme (203 / PPSK / 6171005 (Malay samples), Ministry of Higher Education Malaysia.
References
- Butler JM (2010) Fundamentals of Forensic DNA typing. San Diego: Academic Press.
- Butler JM (2006) Genetics and genomics of core short tandem repeat loci used in human identity testing. Journal of Forensic Sciences 51(2): 253-265.
- Jeffreys AJ, Wilson V, Thein SL (1985) Hypervariable "Minisatelite” regions in human DNA. Nature 314: 67- 73.
- Butler JM, Hill CR (2012) Biology and genetics of new autosomal STR loci useful for forensic DNA analysis. Analysis 24(1):15-26.
- Butler JM (2005) Forensic DNA typing (2nd edn): Biology, technology, and genetics for STR markers. New York: Elsevier Academic Press.
- Kobilinsky L, Liotti TF, Sweat JO (2005) DNA: Forensic and legal applications. New Jersey: John Wiley & Sons.
- Edinur HA, Zafarina Z, Spi'nola H, Nurhaslindawaty AR, Panneerchel- vam S, et al. (2009) HLA polymorphism in six Malay subethnic groups in Malaysia. Human immunology 70(7): 518-526.?
- DOSM (2016) Press release 22 July 2016. Current population estimates, Malaysia, 2014-2016. Department of Statistics Malaysia.
- Hatin WI, Nur-Shafawati AR, Zahri MK, Xu S, Jin L (2011) Population genetic structure of Peninsular Malaysia sub-ethnic groups. PLoS One 6(4): e18312.
- Hatin WI, Nur-Shafawati AR, Etemad A, Jin W, Qin P, et al. (2014) A genome wide pattern of population structure and admixture in peninsular Malaysia Malays. The HUGO Journal 1(8): 1-18.
- Bahrin TS (1967) The pattern of Indonesian migration and settlement in Malaya. Asian Studies 5(2): 233-257.
- Milner AC (1978) A note on 'The Rawa'. Journal of the Malaysian Branch of the Royal Asiatic Society, 51(2(234)):143-148.
- Said N (2004) Religion and cultural identity among the Bugis. Inter Religio 45: 12-20.
- Bellwood P (2007) Prehistory of the Indo-Malaysian archipelago revised edition. Canberra: ANU E Press.
- Juhari WKW, Tamrin NAM, Daud MHRM, Isa HW, Nasir NM, et al. (2014) A whole genome analyses of genetic variants in two Kelantan Malay in-dividuals. The HUGO journal 8(1): 1.
- Awang SN (2011) OrganisasiKekeluargaan Masyarakat Cham di Malaysia. SARJANA 26(1).
- Whatman FTA cards manual (2011). Buckinghamshire, UK: GE Healthcare UK limited.
- Excoffier L, LischerHEL (2010) Arlequin suite ver 3.5: A new series of programs to perform population genetics analyses under Linux and Windows. Molecular Ecology Resources 10(3): 564-567.
- PeakallR, Smouse PE (2012) GenAlEx 6.5: genetic analysis in Excel. Population genetic software for teaching and research-an update. Bioinformatics 28(19): 2537-2539.
- Tereba A (1999) Tools for analysis of population statistics. Profiles DNA 2:3.
- Felsentein J (2005) PHYLIP (Phylogeny Inference Package) version 3.6. Distributed by the author. Department of Genome Sciences, University of Washington, Seattle.
- Page RDM (1996) TREEVIEW: An application to display phylogenetic trees on personal computers. Computers Applications in the Biosciences 12(4): 357- 358.
- Kovach ML (2007) MVSP- A Multi Variate Statistical Package for Windows, ver. 3.2. Kovach Computing Services, Pentraeth, Wales, UK pp. 1-245.
- Shane's simple guide to F-statistics (2005).
- Seah LH, Jeevan NH, Othman MI, Jaya P Ooi, YS Wong, et al. (2003) STR data for the AmpF/STRIdentifiler loci in three ethnic groups (Malay, Chinese, Indian) of the Malaysian population. Forensic Science International 138(1-3): 134-137.
- Ang HC, Sornarajah R, Lim SES, Syn CKC, Tan-Siew WF, et al. (2005) STR data for the 13 CODIS loci in Singapore Malays. Forensic Science International 148(2-3): 243-245.
- Maruyama S, Minaguchi K, Takezaki N, Nambiar P (2008) Population data on 15 STR loci using AmpF/STR Identifiler kit in a Malay population living in and around Kuala Lumpur, Malaysia. Legal Medicine 10(3): 160-162.
- Budowle B, Moretti TR, Baumstark AL, Defenbaugh DA, Keys KM (1999) Population data on the thirteen CODIS core short tandem repeat loci in African Americans, U.S. Caucasians, Hispanics, Bahamian, Jamaicans, and Trinidians. Journal of Forensic Sciences 44(6): 1277-1286.
- Yong RYY, Aw LT, Yap EPH (2004) Allele frequencies of 15 STR loci of three main ethnic populations in Singapore using an in-house marker panel. Forensic Science International 141(2-3): 175-183.
- NurWaliyuddin HZA, Edinur HA, Norazmi MN, Sundararajulu P, Chambers GK, et al. (2014) Killer immunoglobulin-like receptor diversity in Malay subethnic groups of Peninsular Malaysia. International journal of immunogenetics 41(6): 472-479.
- Rashid NHA, Pannerchelvam S, Zainuddin Z (2009) Analysis of mito-chondrial DNA (mtDNA) polymorphism in Kelantan Malays. Proceedings of the 8th Malaysia Congress on Genetics 139-143.
- Manaf SM, NurWaliyuddin HZ, Panneerchelvam S, Zafarina Z, Norazmi MN, et al. (2015) Human neutrophil antigen profiles in Banjar, Bugis, Champa, Jawa and Kelantan Malays in Peninsular Malaysia. Blood Transfusion 13(4): 610-615.


