Evaluation of Nerve Fiber Layer, Macular & Choroidal Thickness in Cases with Hypothyroidism & Hyperthyroidism
Aya Ibrahem Abdelsamea1, Ragaa Ahmed Mohamed2, Abeer Fouad El Badry3, Marwa Sayed Abdel Latif Eissa4*, Enas Abdel Haleem Mourad5
1 Resident of Ophthalmology, National Institute of Diabetes and Endocrinology, Egypt
2 Professor of Ophthalmology, Al-Azhar University, Egypt
3 Lecturer of Ophthalmology, Al-Azhar University, Egypt
4MD Internal medicine and endocrinology, Cairo University, Egypt
5 Fellow of Ophthalmology, Giza Memorial Institute of Ophthalmology & Institute of Diabetes and Endocrinology, Egypt
Submission: July 29, 2019; Published: August 23, 2019
*Corresponding author:Marwa Sayed Abdel Latif Eissa, MD internal medicine and endocrinology, Cairo University, Egypt
How to cite this article:Aya Ibrahem Abdelsamea, Ragaa Ahmed Mohamed, Abeer Fouad El Badry, Marwa Sayed Abdel Latif Eissa, Enas Abdel Haleem Mourad. Evaluation of Nerve Fiber Layer, Macular & Choroidal Thickness in Cases with Hypothyroidism & Hyperthyroidism. J Endocrinol Thyroid Res. 2019; 4(5): 555648. DOI: 10.19080/JETR.2019.04.555648
Abstract
Thyroid: Eye Disease (TED) is orbitopathy associated with thyroid dysfunction. The cause is unknown. TED is usually associated with Graves’ disease, immune-mediated hypothyroidism or in normal thyroid dysfunction; the course of orbitopathy does not correlate with thyroid function. This study was conducted to evaluate Retinal Nerve Fibre Layer (RNFL), Macular thickness (MT) and sub-foveal Choroid thickness (CT) in hypothyroid, hyperthyroid patients and normal subjects using Optical Coherence Tomography (OCT).
Patients and Methodology: This cross-sectional study included 90 patients from December 2018 to March 2019. ophthalmological examination, thyroid profile, and OCT were done
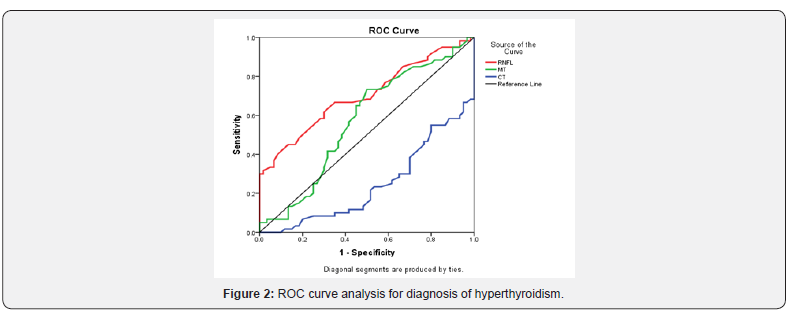
Results: A significant increase in RNFL in hyperthyroid patients (P <0.001), with no significant difference in NFL between normal and hypothyroidism groups (P=0.864). A significant increase in MT in hypothyroidism patients (P=0.036), with no significant difference in MT in hyperthyroidism group (P=0.175) and normal subject. A significant decrease in sub-foveal CT in hyperthyroid and hypothyroid patients (P<0.001, P=0.002) respectively. ROC curve analysis in hyperthyroidism patients shows The specificity, sensitivity, AUC OF RNFL are [65%,66.7%,0.702] at cutoff value 107.5 μm., MT is [55%, 60%, and 0.572] at cutoff value 254.5 μm., And CT is [30%, 30%, and 0.245] at cutoff value 275.5 μm.
Keywords: Grave’s; Hypothyroidism; OCT; Choroid; Macula
Introduction
Thyroid dysfunction can affect the eyes in many cases [1]. hypothyroidism may cause periorbital edema, chemosis and blepharoptosis. These changes may be due to the accumulation of hydrophilic mucopolysaccharides in the ground substance of dermis and other tissues leading to thickening of these layers [2]. Thyroid orbitopathy may follow, precede or occur simultaneously with the onset of hyperthyroidism. 5% to 25% of patients have ophthalmic problems before the diagnosis of hyperthyroidism; Thyroid hormone plays an important role in normal development of retina and attainment of colour vision. It can regulate intrinsic mechanisms for controlling retinal cyto-architecture and layering. Patients with hyperthyroidism commonly due to Graves’ disease are frequently presenting with eyelid retraction, exophthalmos, squint and optic neuropathy [3] and this change are attributed to auto immune disorder against orbital adipocytes and fibroblasts leading to oedema, inflammation of extra-ocular muscles, an increase in orbital connective tissue and fat, that cause obstruction and congestion of retinal veins [4].
Early discovery of ocular complications of thyroid eye disease is important for the preservation of useful visual acuity. The aim of our study is to evaluate the effect of thyroid hormones abnormalities on the choroid, nerve fibre layer and the macular thicknesses. OCT is a non-invasive method that is used for quantitive assessment of retinal morphology, and it offers valuable data about the prognosis of the patients. Spectral-domain optical coherence tomography (SD-OCT) is a recent, non-invasive modality that allow the measurement of the microstructure of the retina and choroidal vessels.
Patients and Methods
This study was conducted on patient recruited from National institute of Diabetes and endocrinology outpatient’s clinic and included 180 eyes from 90 patients. The patients were classified into three groups, 30 patients with hyperthyroidism, 30patient with hypothyroidism and 30 normal persons.
Complete history and ophthalmological examination were done to all patient included:
i. A detailed history included age, duration of thyroid disease, type of treatment and any systemic medical or surgical history.
ii. Refraction by autorefractometer
iii. Visual acuity
iv. Best corrected visual acuity was measured using an international standard vision chart projector by decimal.
v. Slit lamp bio microscopy: for determination of diseases in anterior segment of the eye and exclude cases of haze cornea or mature cataract.
vi. Intraocular pressure measurement by Goldman applanation tonometer.
vii. Fundus examination by indirect ophthalmoscope and lens+ 90D
viii. Thyroid profile
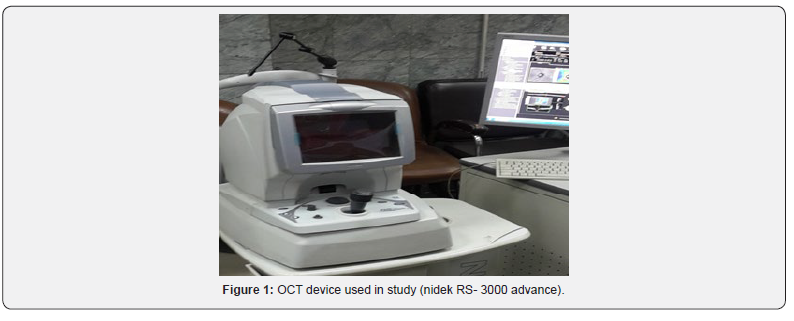
All patients were photographed by using optical coherence tomography (nidek RS- 3000 advance) figure 14 to measure RNFL thickness around optic disc ,Macula Map X-Y (6.0mm x 6.0mm [265x265]) and choroidal thickness by Macula Line (6.0mm[1024]) (Figure 1).

Inclusion criteria
a. Both sexes were included with their ages ranged from 20 to 50 years b. Patients with controlled hypothyroidism (congenital, acquired). c. Patients with controlled hyperthyroidism (Graves’ disease, toxic nodular goiter and Plummer’s disease).
Exclusion criteria
i. Previous intraocular surgery. ii. Any intraocular pathology (macular disorder, glaucoma and laser treatment). iii. High myopia > -6 diopters. iv. High IOP > 21 mm Hg.

Results
a. The results showed that There is a significant increase in RNFL between normal and hyperthyroidism group [114.5(63-370) :P <0.001)
b. While There is no significant difference between normal [104.5(11-129) and hypothyroidism group [105(42- 159)] (P=0.864) (Table 1).
c. Another result in our study is that There is no significant difference in MT between normal [249.5(184-324) and hyperthyroidism group (P=0.175) (P=0.036).
d. While There is a significant increase between normal [249.5(184-324)] and controlled hypothyroidism group (P=0.036).
e. There is a significant decrease in CT between normal and hyperthyroidism group (P<0.001)
f. There is a significant decrease between normal and hypothyroidism group (P=0.002).
g. ROC curve analysis in hyperthyroidism patients shows the specificity, sensitivity, AUC OF RNFL ARE [65%, 66.7%, 0.702] at cutoff value 107.5 μm. (Figure 2).

h. While the assessment of MT in ROC curve is [55%, 60%, and 0.572] at cutoff value 254.5 μm.
i. While the assessment of CT in ROC curve is [30%, 30%, and 0.245] at cutoff value 275.5 μm.

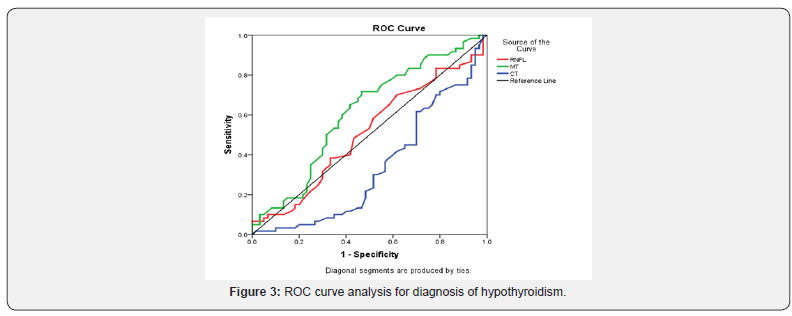
j. The ROC curve analysis in hypothyroidism patients shows the specificity, sensitivity, AUC of RNFL are [50%,53.3% and 0.509]at cutoff value 104.5 μm. (Figure 3)
k. While the assessment of MT in ROC curve is [62%, 60% and 0611] at cutoff value 293.5 μm.
l. While the assessment of CT in ROC curve is [43.3%, 36.7% and 0.337] at cutoff value 293.5 μm.
Discussion
Regarding our study there is no statistically significant difference between normal and hypothyroid patient regarding RNFL thickness This finding shows agreement with Bahçeci, Ozturk et al., Ulaş [5-7] (also there is a statistically significant increase in the RNFL thickness among hyperthyroid patients compared to normal group, this finding shows agreement with Emine et al. [8,9] but different from Forte R. et al. [10] study this difference may be due to that his type of patient was hyperthyroid patient with primary open angle glaucoma, while in our study the patient IOP was normal. Also our results shows disagreement with Sayın et al. [11] his study included 66 patient this difference may be due to that he included in his study uncontrolled patients with group has bilateral proptosis with hyperthyroidism this difference may be due to that he included in his study uncontrolled patients with group has bilateral proptosis and another group with unilateral proptosis while all patients included in our study were controlled with no proptosis.
Our study shows that there is a statistically significant decrease in CT between normal and hypothyroid patients and this results shows disagreement with Ulaş [7] who proved that the CT was thicker in hypothyroid patients compared to normal group and this discrepancy may be related to That the author investigated the full choroidal thickness manually from the outer portion of the hyper reflective line, corresponding to the retinal pigment epithelium, to the inner surface of the sclera while in our study we measured only the sub foveal thickness. CT in hyperthyroid patient shows a significant decrease compared to normal group while Özkan et al., Çalışkan et al. [12,13] shows conflicting results this may be related to the nature of patients included there studies was done on patient with active graves ophthalmopathy compared with controlled hyperthyroid patient receiving treatment ,while our study was done on controlled hyperthyroid patient compared to hypothyroid patient and normal people.
Another finding in our study that, there is a significant increase in MT in hypothyroid patient compared to normal group and no other study discussed that parameter before. The MT has no statistically significant difference between hyperthyroid patients and normal group. Sharon et al showed significant thinning in MT among hyperthyroid patients compared to normal control, he applied his study upon 42 patients with active hyperthyroidism compared to controlled hyperthyroidism in our patients [14]. Also Sayın et al. [11] disagree with our results his study he included in his study uncontrolled patients with group has bilateral proptosis with hyperthyroidism this difference may be due to that he included in his study uncontrolled patients with group has bilateral proptosis and another group with unilateral proptosis while all patients included in our study were controlled with no proptosis.
Conclusion
i. In hyperthyroid patients their significant increase in RNFL and significant decrease in CT relative to control groups.
ii. In hypothyroid patients their significant increase in MT and significant decrease in CT relative to control groups.
iii. OCT enable an accurate identification of RNFL, macular and choroidal changes in TED patients.
iv. Clinician should put in his consideration ocular complications of thyroid dysfunctions and should be alarmed if changes related to retina, choroid or RNFL have been detected.
References
- Adhi M, Duker JS (2013) Optical coherence tomography – current and future applications. Curr Opin Ophthalmol 24(3): 213-221.
- Gallego BI, Salazar JJ, de Hoz R, Rojas B, Ramírez AI, et al (2012) IOP induces upregulation of GFAP and MHC-II and microglia reactivity in mice retina contralateral to experimental glaucoma. Journal of neuroinflammation 9(1): 92.
- Oyster CW (1999) The human eye. In: Sunderland, Sinauer Associates, US, pp. 179-191.
- Rao HL, Babu JG, Addepalli UK (2011) Retinal nerve fiber layer and macular inner retina measurements by spectral domain optical coherence tomograph in Indian eyes with early glaucoma. Eye (Lond); 26(1): 133-139.
- Bahçeci U A, Ozdek S, Pehlivanli Z, Yetkin I, Onol M (2005) Changes in intraocular pressure and corneal and retinal nerve fiber layer thicknesses in hypothyroidism. European journal of ophthalmology 15(5): 556-561.
- Ozturk BT, Kerimoglu H, Dikbas O, Hamiyet Pekel (2009) Ocular changes in primary hypothyroidism. BMC Research Notes 2: 266.
- Ulaş F, Dogan Ü, Dikbaş O, Celebi S, Keles A (2015) Investigation of the choroidal thickness in patients with hypothyroidism. Indian Journal of Ophthalmology 63(3): 244-249.
- Emine S, Berker D, Elgin U, Tutuncu Y, Ozturk F (2012) Comparison of optic disc topography in the cases with graves’ disease and healthy controls. Journal of glaucoma 21(9): 586-589.
- Ye Lei, Zhou SS, Yang WL, Bao J, Jiang N (2018) Retinal microvasculature alteration in active thyroid-associated ophthalmopathy. Endocrine Practice 24(7): 658-667.
- Forte R, Bonavolonta P, Vassallo P (2010) Evaluation of Retinal Nerve Fiber Layer with Optic Nerve Tracking Optical Coherence Tomography in Thyroid-Associated Orbitopathy. Ophthalmologica 224(2):116-121.
- Sayın O, Yeter V, Arıturk N (2016) Optic disc, macula, and retinal nerve fiber layer measurements obtained by OCT in thyroid-associated ophthalmopathy. Journal of ophthalmology 21(9): 586-589.
- Ozkan B, Kocer CA, Altintas O, Karabaş L, Acar AZ (2016) Choroidal changes observed with enhanced depth imaging optical coherence tomography in patients with mild graves orbitopathy. Eye (Lond) 30(7): 917-924.
- Çalışkan S, Acar M, Gurdal C (2017) Choroidal thickness in patients with Graves’ ophthalmopathy. Current eye research 42(3): 484-490.
- Sharon BM, Igal L, Anat K, Varssano D1, Rosenblatt A (2017) Retina and Nerve Fiber Layer Thickness in Eyes with Thyroid-Associated Ophthalmopathy. Isr Med Assoc J 19(5):277-281.


