


Specific Role of Novel TL Material in Various Favorable Applications
Shashank Sharma1* and Sanjay Kumar Dubey2
1Department of Physics, Govt ERR PG Science College, India
2Department of Physics, Dr. Radha Bai Govt Navin Girls College, India
Submission: June 9, 2022; Published: June 21, 2022
*Corresponding author: Shashank Sharma, Department of Physics, Govt ERR PG Science College , Bilaspur, India
How to cite this article: Shashank S, Sanjay Kumar D. Specific Role of Novel TL Material in Various Favorable Applications. Insights Min Sci technol.2022; 3(2): 555609. DOI: 10.19080/IMST.2022.03.555609
Abstract
A promising candidate of long persistent Ca2MgSi2O7:Dy3+ material sample was well sintered via the traditional high temperature solid-state synthesis (SSS) technique. X-ray Diffraction (XRD), Field Emission Scanning Electron Microscopy (FESEM), Energy Dispersive X-ray Spectroscopy (EDX), and Thermoluminescence (TL) characteristics have been briefly investigated. The results of the XRD studies obtained for this phosphor revealed its tetragonal, akermanite crystal structure with a space group P4̅21m. The average crystallite size (D) was calculated as 67nm and the crystal lattice strain size (ε) as 0.27nm. The chemical composition of the synthesized phosphor was well clarified with the help of EDX Spectroscopy. The actual crystal phase formation of prepared phosphor was confirmed by FESEM morphological images. It is clear from the obtained TL data that the sample UV exposed for 15min exhibits optimum TL intensity. Consequently, the radiative recombination mechanism on do-pant [Dy3+] ion gives rise to the TL stimulation process. In this present paper, structural & thermal properties of these phosphors are discussed in detail. Therefore, it is a new promising solid-state lighting (SSL) device, novel TL material, high temperature dosimetry applications and long persistent phosphors (LPP).
Keywords: Solid-state synthesis (SSS); X-ray diffraction (XRD); Tetragonal; Akermanite; Ca2MgSi2O7:Dy3+ (CMSD)
Abbreviations: SSS: Solid-State Synthesis; CMSD: Ca2MgSi2O7:Dy3+; Dy3+: Dysprosium; XRD: X-Ray Diffraction; FESEM: Field Emission Scanning Electron Microscopy; EDX: Energy Dispersive X-Ray Spectroscopy; TL: Thermoluminescence; LPP: Long Persistent Phosphor; SSL: Solid-State Lighting; W-H UDM: Williamson-Hall Uniform Deformation Model; FWHM: Full Width Half Maximum; CN: Co-ordination Number; AR: Analytical Reagent Grade; Dr (%): Radius Percentage Difference; WLEDs: White Light Emitting Diodes
Introduction
In recent times, the increasing popularity and unexpected demand for WLEDs has made the lighting industries and markets more responsible for their unique vision in future. The lighting industry addresses a particular interest in rare-earth luminescence materials. It is clear that WLEDs with their excellent key properties including higher brightness, energy efficiency, reliability, long-lifetime, less environmental impact and cheaper, less synthetization time have kept alive the expectation of replacing traditional incandescent and fluorescent lamps that will be responsive to the foreseeable future [1].
Akernamite CMSD phosphor as a conventional luminescent material has attracted intense interest from material scientists and researchers due to its unique structural properties and feasible applications in producing white WLEDs. The feasible advantageous nature of lanthanide ions (i.e., d block elements) as doping ions has now well instituted in the field of luminescence [2]. It would be fair to say that the various doping ions prominently contribute to the long afterglow features of phosphors reaching from a few seconds to several hours [3]. To explain the luminescence properties, the emission spectra of lanthanide ions remain approximately the same in different host lattice crystals, but the chemical stability, durability & luminescent efficiency largely depend on the special physical characteristics of the selected host lattice crystal [4].
Many literatures have been discussed that the phenomenon of the TL process is simply explained in the way that some solid substances emit light on heating and are also called luminescent materials (i.e., phosphors), but this is quite different from the process of incandescence. It is quite true that it is very difficult to achieve normal light emission via any luminescent material (i.e., phosphors). Therefore, impurities are commonly employed in the luminescent material of rare-earth elements, which are also recognized as a host material. It is often observed that during the doping process of impurities such as different rare-earth (i.e., activators) ions like Europium (Eu), Dysprosium (Dy), Terbium (Tb), Cerium (Ce) etc., localized energy levels are formed in the forbidden energy band gap of the phosphors. Compared to other activator ions, it is very highly expected that the Dy3+ ions are involved in electron trapping as suitable activator ions.
This is the reason that when the Dy3+ ion is attached into the host crystal lattice through the doping process, then the persistent emission is stronger from the electron trapping process because the Dy3+ ion is responsible for electron trapping. An important factor behind all this is the matter of fact that two Dy3+ ions can clearly occupy the three ions of the host crystal lattice site. Dy3+ ions may promote the formation of defects in the crystal lattice. Consequently, that act as electron traps and serve as possible oxygen vacancies [5, 6].
Therefore, it is essential to explore the novel TL material. With this inspiration, the main objective of our present investigation regarding the selected powder samples, we report the preparation of CMSD phosphors via high temperature traditional SSS technique. Simultaneously, its structural characterization based on XRD, SEM, EDX analysis and study of thermal properties have also been discussed based on TL spectra and evaluated different kinetic or trapping parameters. TL characteristics have been reported to the best of our knowledge that the chosen CMSD phosphor sample has been found to be a LPP and novel TL material [7].
Experimental Details
I. Sample Synthetization
We have taken CMSD samples in our experiment (figure 1). This general melilite structure formula (i.e., M2XY2O7: RE3+, where M= Ca, Ba, Sr; X= Mg; Y= Si; RE= Eu, Dy, Ce etc.) relates to the akermanite crystal structure as well as to the mellite compound. This sample was well sintered via a traditional high-temperature SSS technique. The initial precursor chemical reagents CaCO3(AR), MgO (AR), SiO2 (AR) and Dy2O3 (AR) with very small quantities of H3BO3 (AR) were added as flux [36]. The only purpose behind taking flux was that it increases the reaction rate while keeping itself unchanged, which makes the process of sample preparation very fast. In the sample preparation process, the raw materials were carefully weighed in stoichiometric ratios.

Then, after weighing, all raw mixtures were grinded with the help of an agate mortar & pestle for 2h, after mixing homogeneously by adding a few drops of CH3COCH3 (AR). Thereafter, the sample of the synthesized mixture was transferred to an alumina crucible and sintered for 3:30h at 1150°C temperature under a weak reducing atmosphere, which was generated with the help of burning charcoal. The crucible is then taken out of the high temperature furnace and allowed to cool, using natural cooling process. After cooling down, a fine powder sample is prepared by additional grinding process again with the help of agate mortar & pestle. Due to which our final phosphor was obtained in the form of white powder. Such a way, the resultant powder sample was restored in an airtight and waterproof bottle for further structural and thermal characterization studies, like XRD, SEM, and EDX, TL. The chemical reaction process is given as follows:
8CaCO3+ 4MgO + 8SiO2∗H2O → 4Ca2MgSi2O7 + 8CO2 (↑) + 8H2O (↑) + 3O2 (↑) (1)
8CaCO3+ 4MgO + 8SiO2∗H2O + 2Dy2O3 → 4Ca2MgSi2O7:Dy3+ + 8CO2 (↑) + 8H2O (↑) + 3O2 (↑) (2)
The chemical reaction process involves the chemical decomposition of calcium carbonate [CaCO3] to form calcium oxide [CaO] & carbon dioxide [CO2]. When the temperature reaches higher than 950°C (approximately), then this process is done, which is shown according to this chemical reaction as below:
CaCO3 → CaO + CO2 (↑) (T ≥ 950°C) (3)
II. Sample Characterization
For crystal structure and phase identification, X-ray powder diffraction patterns of the synthesized powder sample were carried out at an extensive range (10°-80°) of Bragg angle 2θ using a Bruker D8 advanced X-ray diffraction measuring instrument with Cu-Kα target radiation (𝜆 = 1.54056 Å). Surface morphology of the sample was examined and EDX analysis performed with the help of SEM (ZEISS model microscope) associated with EDX (Dept. of Metallurgical engineering, NIT Raipur, C.G., India). The thermoluminescence (TL) data were collected with the help of the daily routine TL Reader (Integral-Pc Based) Nucleonix TL 10091 (Dept. of Physics, Pt. Ravishankar Shukla University, Raipur (C.G.), India).
Results and Discussion
In the present investigation, the characterization study of the synthesized phosphor sample has been done based on XRD, SEM, EDX & TL characteristics, which are as follows.
I. XRD Analysis
This analysis was better utilized for phase structure characterization of the synthesized powder samples. It is often observed that the data analysis of XRD patterns of standard CMS phase crystal structure is typically qualitative in nature, clearly based only and only on relative diffraction peak intensities. XRD patterns of the un-doped and CMSD samples are clearly displayed in figure 2. Comparing both powder samples; it can be clearly observed that all the diffraction peak positions have not changed even after the addition of a fixed doping concentration of dysprosium activator ions. The diffraction peak positions and relative intensities of sintered powder samples were well matched and in agreement with the help of standard JCPDS PDF File No. #77-1149 [7] & AMSCD CODE 0008032 [8].

The XRD results clearly confirmed that the crystal structure of the synthesized powder samples does not change because when dysprosium [Dy3+] ions occupy calcium [Ca2+] sites within the host crystal lattice [i.e., CMS] [36]. This is mainly because the ionic radii of Ca2+ ion sites are clearly captured by being close to the Dy3+ ionic radii [9]. XRD data were indexed to a tetragonal crystallography system (i.e., akermanite phase structure) with a P4̅21m space group (i.e., 113 space number and D32d space group) having cell parameters a = b = 7.8071 Å, c = 4.9821 Å & α=β=γ = 90°, and the cell volume is 303.663 (Å)3 [10-17,36].
II. Crystallite Size (L) and Crystal Lattice Strain (ε)
The crystallite size (D) and the crystal lattice strain size component for the sintered powder samples are calculated with the help of the Debye Scherer’s and W-H UDM plots [18-20]:
L = 0.94λβCosθ (4)
βCosθ = λ/D + ε (4Sinθ) (5)
The average crystallite size was obtained ~ 67nm and the average crystal strain size was evaluated ~ 0.27nm of prepared CMSD phosphor. Both crystalline parameters were obtained from the XRD measurement. Where L represents the crystalline size; λ (1.5406 Å) represents the X-ray emission wavelength for the target Cu-Kα radiation; β represents the FWHM of diffraction peak and θ represents the Bragg angle, ε represents the crystal lattice strain size. Table 1 clearly displays the crystalline parameters. The crystallite size and the strain component upsurge with an increase in the do-pant ion concentration, which raises in turn the volume of the unit cell in the crystal.

III. Radius Percentage Difference [Dr (%)]
To ensure the substitution of the cation of host crystal lattice sites by Dy3+ (CN. 6), the rare-earth do-pant ion is used according to the mathematical relation [Eq. 6], which calculates the ionicradius percentage difference between the do-pant ion and host crystal lattice site. In this way, an important condition for the substitution of cation by do-pant ion is that the radius percentage difference of the cation must be less than 30% [13]. Therefore, when this happens, the dopant [Dy3+] ion can very easily substitute the cation [Ca2+] sites.
Dr = [Rm (CN) - Rn (CN)]/ Rm (CN) × 100% (6)
The calculated Dr (%) values of the synthesized doped phosphors are demonstrated in table 2. From the above discussion, it becomes very clear that in the present research work, do-pant ion (i.e., Dy3+) clearly substitutes for the alkaline-earth ion (i.e., Ca2+) in the host crystal lattice site.

It can be supposed that the dopant Dy3+ ion enters in host crystal lattice (CMS). As a result, it is very clear from table 1 that the Dy3+ ion clearly substitutes the host crystal lattice site for only Ca2+ ions. This is mainly due to the ionic radius of Dy3+ (VI) ion (0.912 Å) being much closer to Ca2+ (VI) ion (about 1.00 Å) and Ca2+ (VIII) ion (about 1.12 Å) rather than the ionic radius of Mg2+ (IV) ion (about 0.72 Å) as well as ionic radius of Si4+ (IV) ion (about 0.40 Å) [9, 36]. Here, Dy3+ ions are more likely to occupy the Ca2+ lattice sites in the host crystal lattice [36] and thus will generate traps in substituted host crystal lattice site because of the different electro-negative tendencies of the two ions [14]. Table 1 confirms that the dysprosium [Dy3+] ions do not completely occupy two other tetrahedral sites, namely the magnesium [Mg2+] & silicon [Si4+] ions.
Therefore, [Ca2+] lattice sites can occupy two alternative lattice sites, the six coordinated [Ca2+] site [CaO6 (Ca (I) site)] and the eight coordinated [Ca2+] site [CaO8 (Ca (II) site)]. We have also explored that the Mg2+ [MgO4] and Si4+ [SiO4], two other independent positive ions (i.e., cation) also exist in the crystal lattice sites. [Mg2+] and [Si4+] positive ions clearly occupy the tetrahedral sites [15, 16].
IV. FESEM Analysis
It is true that the luminescence characteristics of any particle (i.e., Nano or Micro) are clearly defined based on their corresponding specific properties, likewise size, shape, size distribution, defects which depend on the morphology of the particles [17, 18]. FESEM images of the sintered CMSD powder sample are clearly displayed with single magnification in figure 3(a). FESEM morphology image were clearly indicated that the surface morphology of the particles in the synthesized sample was not uniform and they were tightly aggregated to each other with different particle size distributions. In addition, due to the high temperature heat treatment, some big aggregates are clear in this morphology of the particles [19]. It consists of irregular shaped particles with an average particle size of 46.569nm, which is the help of J Image software. Observing the FESEM morphological images, it is clearly confirmed that the synthesized CMSD powder sample has been obtained in micro form.

V. EDX Analysis
For an in-depth analysis of the chemical composition of any powder sample, it has been measured with the help of EDX spectra. It is better utilized as an actual procedure for quantifying & identifying the elemental composition of any specimen region as small as a few nanometers [20, 21]. The actual evidence of elements like Ca, Mg, Si, O and Dy sharp peaks are clearly exist in EDX spectra, which primarily indicates the actual formation of the sample in figure 3(b). Along with the clear evidence of rareearth Dysprosium ions in their relevant EDX spectrum image. As such, their EDX spectrum showed no emission peaks other than (Ca) calcium, Si (silicon), (O) oxygen and Mg (magnesium). The elements are presenting the actual chemical composition with respect to Weight % and Atomic % also analyzed, which is displayed in table 3.

VI. TL Analysis
The phenomenon of TL can also be defined in this way that it is one of the most essential techniques for making an in-depth study of the trap-centers as well as trap-level in an insulator or semiconductor stimulated by any radiation-source [26]. A novel TL luminescent material exhibits superior long afterglow characteristics, which are called persistent luminescence [37]. As such, they are playing a more essential and important role in various application areas, such as brightness in the darkness roads, bio-imaging and emergency indication signs, display boards, advisory displays etc. [22, 25]. In present times, the evolution of specific TL luminescent-material indicates a modern and rapidly developing application of research areas in physical science, medicine as well as mineral prospering, archaeological dating, forensic science and high temperature radiation dosimetry [23, 24] as well as long-persistency mechanism. (figure 4 a,b)
Figure 4(b) displays the TL glow curve peak of CMSD sample with different UV-irradiation dose times (i.e., 5, 10, 15, 20, 25min) with a constant heating rate of 5°C/sec. As the fixed concentration of the Dy3+ ion increases, the relative TL intensity also increases and reaches its optimum value. It is also confirmed that the TL intensity decreases with further increase in concentration of dopant Dy3+ ions. As a result, it has found that as the concentration of activator ions increases due to this, the distance between the activator ions becomes noticeably smaller. Energy is transferred from one ion to another ion due to increased interaction of the activator ions. On the other hand, it is also confirmed that the energy stored by the ions decreases with the decrease in the concentration of the activator ions. Consequently, there is an optimum and favorable concentration of the activator ion in CMSD phosphor sample at 15min UV- irradiation dose time.

It is readily apparent that electron traps in these crystal lattice sites may be located the oxygen [O2-] vacancies and hole traps may be located the calcium [Ca2+] vacancies or the bridging oxygen Ca- O-Si. It is also very likely that the excited electron can be transferred to the nearest oxygen [O2-] vacancy fabricated at the O (2) lattice sites. The result will be that the electron instantly reaches relaxing at the stable state and gets trapped in the lattice site. On the other hand, the possibility arises that the hole generated at dysprosium [Dy3+] lattice sites through the UV excitation moves towards silicon [Si4+] vacancy and is itself trapped at the Ca (2) lattice site. As a result, Ca2+ ion is formed through the electron-phonon interaction mechanism. Typically, the trapped electron in the lattice site and the self-trapped hole that are responsible for the crystal growth process are firmly connected with the oxygen [O2-] and silicon [Si4+] vacancies generated under it. After the above process, the holes in the crystal lattice site return to the dysprosium [Dy3+] site via thermal stimulation mechanism and get trapped again. That is, the process of re-trapping takes place. Meanwhile, heating of the phosphor sample leads to de-trapping of the traps. As a result, the radiative recombination mechanism on do-pant [Dy3+] ion gives rise to the TL stimulation process.
VII. TL Trapping Parameters
TL is the emission of light from a solid, either inorganic, semiconductor, or insulator in form, when it is heated after exposure to some radiation [26, 27]. In such a case, when the charge carriers (i.e., holes or electrons) are freed. When TL analysis of any phosphor, then the TL glow-curve of that phosphor primly depends on the kinetic (i.e., trapping) parameters which mainly comprise such as [Order of Kinetics b] and [Frequency Factor S] as well as [Activation Energy or Trap Depth] [28]. The peak shape method is a well appropriate method for the determination of kinetic parameters (i.e., trapping parameters) [29]. To determine the trapping parameters, the peak shape method figure 4(a) is being used.
The peak shape method is an analytical technique which was proposed by Chens, thus also known as Chen’s method [29]. This method is also useful to detect the position of energy levels in the forbidden energy gap and defect centers [30]. Therefore, the complete analysis of the glow curve has been done using this method. Figure 4(a) shows the peak shape of the glow curve of the sintered sample. Tm, T1 and T2 are maximum, lower (ascending part of glow curve) and higher (descending part of glow curve) temperatures at half the intensity, respectively [31, 32] and other kinetic parameters (τ, δ, ω) are originated using these temperatures, where (Tm-T1) defines τ, (T2-Tm) defines δ and (T2- T1) defines ω. Using these parameters, activation energy, order of kinetics and frequency factor is evaluated.
VIII. Order of Kinetics [𝒃]
For glow-curve peak, this parameter can be evaluated with the help of geometric shape factor) [μg] determination from the following mathematical form as below:
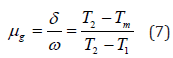
Where Tm represents the prominent peak temperature and T1 & T2 are represents temperatures at half intensity on the ascending and descending orders of the glow-curve peak, respectively. [ω = T2 - T1]and [δ = T2 - Tm] are representing the high-temperature half-width. The geometric shape factor is a key part of the TL glow-curve peak, which is to differentiate between I>st and IInd order kinetics. The mathematical value of the geometric shape factor [μg= 0.39-0.42] represents for I>st order kinetics and [μg= 0.49-0.52] represents for IInd order kinetics as well as for the mixed order kinetics, also represented as [μg = 0.43−0.48] [30-33].
IX. Activation Energy (E) or (Trap Depth)
The trapped electron needs some amount of energy to free itself, also known as activation energy (i.e., trap depth), which is required to liberate an electron to the conduction band from defects center [23]. The value of trap-depth (i.e., activation energy) can be evaluated with the help of the following mathematical equation as mentioned, which is valid for any kinetics (i.e., first, second and mixed order kinetics).
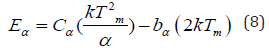
Cα and bα (where α = τ, δ, ω) are determined with the help of the following mathematical equation, which is valid for any general order kinetics [47]:
Cτ = [1.51+3 (μg-0.42)], bτ=[1.58+4.2(μg-0.42) (9)
Cδ = [0.976+7.3 (μg-0.42)], bδ=0 (10)
Cω = [2.52+10.2 (μg-0.42)], bω=1.0 (11)
X. Frequency Factor (𝐒−𝟏)
This kinetic parameter is one of the most significant parameters which are used for the sample characterization process [33]. This trapping parameter is calculated by substituting the previously evaluated values of order of kinetics [b] and activation energy E in the mathematical equation (as mentioned):
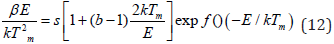
Where k represents the Boltzmann constant, E represents the activation energy or trap-depth & b represents an order of kinetics, Tm represents the prominent temperature of the glow-curve peak position, and β (i.e., at present work 50Cs−1) represents the heating rate of any material sample [30-33].The effect of different UV exposure times such as (5, 10, 15, 20 and 25min) on the CMSD phosphor sample and different TL kinetic parameters are calculated in table 4. Corresponding activation energy (E) and frequency factor (𝑠−1) were evaluated in range of (0.62-0.70eV) and (2.3×10⁷ to 9.7×10⁷) respectively. Thus, we obtained the maximum TL intensity in 15 min UV exposure time. In our case, the geometric shape factor (μg) lies between 0.44-0.47, this shows that it is a case of mixed order kinetics, which is approaching towards second order kinetics, responsible for deeper trap depth. According to Sakai’s and Mashangva, it is also reported that a trap depth between (0.65-0.75eV) is very appropriate for long afterglow properties [34, 35]. We suggest that this synthesized phosphor is a better LPP and novel TL material.

Conclusion
Un-doped and CMSD powder samples were successfully synthesized via high temperature SSS technique at 1150°C temperature for 3:30 h. Different characterization techniques, like XRD, SEM, EDX and TL were highly studied for understanding their spectroscopic and luminescence properties. The XRD analysis revealed that the compound is a single-phase structure CMSD phosphor with tetragonal crystallography with an akermanite phase structure with a space group P4̅21m. The average crystallite size was calculated as 67nm and the crystal lattice strain size as 0.27nm. The chemical composition of the synthesized phosphor was clear with the help of EDX spectroscopy.
FESEM images with single magnification display that the surface morphology of the particles was not uniform and they aggregated tightly with each other with different size distributions. The TL study displays that the optimum Dy3+ doping concentration was found for 15min UV irradiation dose time. As a result, the radiative recombination mechanism on the Dy3+ activator ion gives rise to the TL stimulation process. The activation energy or trap depth of CMSD phosphor sample was found in the range between (0.62-0.70eV), which is very appropriate and favorable for long afterglow properties. It is considered that this phosphor sample is highly applicable for LPP, novel TL material and high temperature radiation dosimetry applications.
Application of Future Scopes
Akermanite earth silicates have been broadly studied as host materials for phosphor applications because of their chemical and physical stability and varied luminescent color. Thus, the material is a suitable host for phosphor application in WLEDs and SSL devices as well as long persisting phosphor, high radiation dosimetry applications & novel thermo-luminescent materials. Compared to sulfide and aluminate-based phosphors, silicates play an important contribution among many inorganic phosphors. The most significant factor behind all this is the fact that they possess vast chemical and structural variations. Usually, they have large band gaps as a host matrix. Presently, this phosphor has been widely utilized prominently in specific beneficial areas, likewise cancer-therapy, drug-delivery, bone-materials, bone-tissue engineering, biomaterials, and tissue engineering applications. Along with this, it is also making a significant contribution in the field of DNA transplantation technique in medical science and computer application (i.e., for Image Processing) as well as operation research and Information technology areas.
Acknowledgments
Authors are very grateful to Dept. of Physics, Dr. Radha Bai, Govt. Navin Girls College, Raipur (C.G) for support in experimental research work. We are also thankful to kind support NIT Raipur (C.G.) and Kalinga University Raipur and Pt. Ravishankar Shukla University, Raipur (C.G.) India. The first author undertakes the work of writing the entire research Paper, data collection, paper design and results-discussion. Similarly, second author has properly checked the spelling mistake and grammatical error and helped in sample preparation.
Conflict of Interest
There is not any conflict or any economic interest that exists in our present research work.
References
- Matsuzawa T, Aoki Y, Takeuchi N, Murayama Y (1996) A new long phosphorescent phosphor with high brightness, SrAl2O4: Eu2+, Dy3+. Journal of the Electrochemical Society 143: 2670.
- Cai Jinjun, Huanhuan Pan, and Yi Wang (2011) Luminescence properties of red-emitting Ca2Al2SiO7: Eu3+ nanoparticles prepared by sol-gel method. Rare Metals 30: 374-380.
- Talwar GJ, Joshi CP, Moharil SV, Dhopte SM (2009) Combustion synthesis of Sr3MgSi2O8: Eu2+ and Sr2MgSi2O7:Eu2+ Journal of Luminescence 129(11): 1239-1241.
- Wu H, Yihua H, Guifang J, Li Chen, Xiaojuan W, et al. (2011) Photoluminescence and thermoluminescence of Ce3+ and Eu2+ in Ca2Al2SiO7 Journal of Luminescence 131(12): 2441-2445.
- Dutczak D, Thomas J, Alexander M, Arturas K, Andries M, et al. (2012) Yellow persistent luminescence of Sr2SiO4: Eu2+, Dy3+. Journal of Luminescence 132(9): 2398-403.
- Gupta SK, Kumar M, Natarajan V, Godbole SV (2013) Optical properties of sol-gel derived Sr2SiO4:Dy3+, Photo and thermally stimulated luminescence. Journal of Optical Materials 35(12): 2320–2328.
- JCPDS PDF File No. 17-1149, JCPDS International Center for Diffraction Data.
- American Mineralogist Crystal Structure Data-Base-Code AMCSD 0008032.
- Shannon RD (1976) Revised effective ionic radii and systematic studies of interatomic distances in halides and chalcogenides. Acta crystallographica section A: crystal physics, diffraction, theoretical and general crystallography 32(5): 751-767.
- Sharma S, Dubey SK, Pandey S, Diwakar AK (2021) Optical Characteristics of Novel WLED (Ca2MgSi2O7:Dy3+) North Asian International Research Journal Of sciences, Engineering & IT 7(11): 33-44.
- Feitosa AV, Miranda MAR, Sasaki JM, Araujo-Silva MA (2004) A new route for preparing CdS thin films by chemical bath deposition using EDTA as ligand. Brazilian Journal of Physics 34(2b): 656-658.
- Ubale AU, Sangawar VS, Kulkarni DK (2007) Size dependent optical characteristics of chemically deposited nanostructured ZnS thin films. Bull Mater Sci 30: 147-151.
- Kasturi S, Sivakumar V, Varadaraju UV (2017) Synthesis and photoluminescence of EuII in barium zinc orthosilicate: a novel green color emitting phosphor for white‐ Luminescence 32(3): 334-340.
- Jiang L, Chengkang C, Mao D, Chuanli F (2003) Concentration quenching of Eu2+ in Ca2MgSi2O7: Eu2+ Materials Science and Engineering: B 103(3): 271-275.
- Brisdon A, Nakamoto K (2010) Infrared and Raman Spectra of Inorganic and Coordination Compounds, Part B, Applications in Coordination, Organometallic, and Bioinorganic Chemistry. (6th), Wiley, pp. 424.
- Caracas R, Gonze X (2003) Ab initio determination of the ground-state properties of Ca2MgSi2O7 Physical review. B, Condensed matter and materials physics 68(184102): 1-7.
- Clarke A, Eberhardt C, Eberhardt CN (2002) Microscopy techniques for materials science. Wood head publishing press, UK.
- Reed S, Brent J (2005) Electron microprobe analysis and scanning electron microscopy in geology. Cambridge university press, UK.
- Sharma S, Dubey SK, Diwakar AK, Pandey S (2021) Structural Characterization and Luminescence Properties of Ca2MgSi2O7 (CMS) Phosphor. International Journal of Scientific Research in Physics and Applied Sciences 9(6): 49-53.
- Goldstein JI (1981) X-ray spectral measurement: WDS and EDS. In: Scanning Electron Microscopy and X-Ray Microanalysis. Springer, Boston, Massachusetts, US pp. 205-273.
- Egerton RF (2005) Physical principles of electron microscopy, Springer, New York, USA, p. 56.
- Hongde L, Bos AJ, Dobrowolska A, Dorenbos P (2015) Low-temperature VUV photoluminescence and thermoluminescence of UV excited afterglow phosphor Sr3AlxSi1-xO5: Ce3+, Ln3+ (Ln= Er, Nd, Sm, Dy and Tm). Physical Chemistry Chemical Physics 17(23): 15419-15427.
- Pratibha BS, Chandrashekara MS, Nagabhushana H, Ramesh KP, Naghabhushana BM (2014) Thermoluminescence studies on Sr2SiO4 Nano Powder. Proceedia Material Science 5: 944-52.
- Rivera T (2011) Synthesis and thermo-luminescent characterization of ceramic materials. Advances in ceramics, UK.
- Pan W, Guiling N, Xu Zhang, Jing W, Yuan L, et al. (2008) Enhanced luminescent properties of long-persistent Sr2MgSi2O7: Eu2+, Dy3+ phosphor prepared by the co-precipitation method. Journal of luminescence 128(12): 1975-1979.
- KVR Murthy, JN Reddy (2008) Thermo-luminescence: Basic Theory, Applications and Experiments, Nucleonix Systems Pvt. Ltd, India.
- SWS Mckeever (1985) Thermo-luminescence of Solids. Cambridge University Press, London, UK.
- DR Vij (2012) Luminescence of solids. Springer Science & Business Media, New York, USA.
- M Srinivas, B Appa Rao (2012) Luminescence studies of Eu3+ doped BaGd2O4 Indian Journal of Science and Technology 5(7): 1-5.
- V Pagonis, G Kitis, C Furetta (2006) Numerical and practical exercises in thermoluminescence. Springer Science & Business Media, New York, USA.
- AT Ege, E Ekdal, T Karali, N Can (2007) Determination of thermoluminescence kinetic parameters of Li2B4O7: Cu, Ag, P. Radiation measurements 42(8): 1280-1284.
- MT Jose, SR Anishia, O Annalakshmi, V Ramasamy (2011) Determination of thermoluminescence kinetic parameters of thulium doped lithium calcium borate. Radiation measurements 46(10): 1026-1032.
- A Deshpande, NS Dhoble, SC Gedam, SJ Dhoble (2016) Photo and thermoluminescence in K2Mg (SO4)2: Dy phosphor and evaluation of trapping parameters. Journal of Luminescence 180: 58-63.
- R Sakai, T Katsumata, S Komuro, T Morikawa (1999) Effect of composition on the phosphorescence from BaAl2O4: Eu2+, Dy3+ Journal of Luminescence 85(1-3): 149-154.
- M Mashangva, MN Singh, T B Singh (2011) Estimation of optimal trapping parameters relevant to persistent luminescence. International Journal of Pure & Applied Physics 49: 583-589.
- S Sharma, SK Dubey, AK Diwakar, S Pandey (2021) Novel White Light Emitting (Ca2MgSi2O7: Dy3+) Phosphor. JMSRR 8(4): 164-171.


