


Investigation of Formation Damage around Perforations using Numerical Simulation
Maryam Boloorian*, Mohammad Reza Resaei and Ali Nakhaee
Institute of Petroleum Engineering, University of Tehran, Iran
Submission:December 23, 2020;Published:January 29, 2021
*Corresponding author: Maryam Boloorian, Institute of Petroleum Engineering, University of Tehran, Iran
How to cite this article: Maryam B, Mohammad Reza R, Ali Nakhaee. Investigation of Formation Damage around Perforations using Numerical Simulation. Insights Min Sci technol.2021; 2(4): 555593. DOI:10.19080/IMST.2021.02.555593
Abstract
Formation damage in hydrocarbon reservoirs around the wellbore is inevitable and can happen from the earliest stages of drilling to the latest hydrocarbon recovery stages by tertiary enhanced recovery methods. Numerical simulations of production behavior around wellbore perforation in single-phase and two-phase states have been conducted by the CFD method to investigate the effect of perforation geometry on formation damage. Moreover, formation damage due to drilling mud penetration into the perforations by dispersion mechanism has also been analyzed. The results of the simulation were validated in good accordance with the published data.
Based on simulation results, although perforations enhance the drilling mud penetration damage, especially for perforation lengths up to 20cm, they can effectively reduce perforation skin if they become adequately cleaned. Perforation density, length, and diameter have the most pronounced effect on reducing the skin factor. There is almost a linear relationship between skin factor and clean perforation diameter. Since larger diameters come with shorter lengths, perforation optimization is required according to casing material, hole size, rock mineral, and perforation technology available.
Keywords: Formation damage; Perforation; Drilling mud filtration penetration; Two-phase flow; Numerical simulation
Introduction
Formation damage is an unavoidable phenomenon that can only be reduced or delayed by considering engineering principles during operations. Still, in the long term, formation treatment to maintain economic production is inevitable. The methods to treat a formation are to either remove the formed skin around the well or, in some way, pass through the formed skin and establish a connection between the wellbore and the intact section of the formation. The first step in formation treatment is identifying the cause, type, and severity of formation damage. Laboratory tests and well tests, along with the study of well history since drilling, are useful tools for this purpose.
Reservoir properties change in the near-wellbore area, which will cause additional pressure to drop around the wellbore. The permeability of this zone is different from that of the formation, and in most cases, it is reduced. Production reduction due to this permeability reduction or additional flow resistance is expressed by skin factor. Positive skin factor due to formation damage could happen during different stages, including drilling operations (invasion of drilling fluid), cementing operations, perforation operations, completion operations, production, and stimulation operations [1-9].
Production can decrease the pore pressure in the reservoir, subsequently decreasing the porosity. A decrease in reservoir pressure will also cause sedimentation of organic (asphaltene) and non-organic (mineral) materials. Penetration of drilling fluid filtrate into the formation causes damage to the production zone [10-15]. Most oil and gas wells are cemented and perforated, which creates additional resistance. Perforation geometry parameters such as shot density, shot penetration length, shot phasing, and shot diameter will affect the well productivity index and skin factor. During perforation operations, a damaged zone around the perforations will be formed with lower permeability than the intact formation.
Muskat and MacDowell investigated the effect of perforation on well productivity index [16,17]. Oscar Molina evaluated gas wells’ performance and efficiency around a perforation and damaged zone [18]. Hong investigated the productivity index in perforated completion without considering the damaged zone [19]. Mohammed H. A. Alshawaf investigated the effect of perforation geometry on skin factor and pressure drop [20]. Zheng et al. investigated formation damage due to perforation with laboratory tests and numerical simulation and modeling in single-phase and two-phase conditions [21].
Theory and Equations
Flow modeling around the perforation
The fluid flow around the perforations has been analyzed with finite volume and finite element formulations. This formulation aims to model the flow geometry around the perforation accurately.
Modeling by finite volume approach
Fluid flow equations of single-phase and two-phase liquidgas in porous media are modeled by considering a lost factor in momentum equations for porous media resistance flow. There are two different approaches for multi-phase flow modeling, Euler-Lagrange and Euler-Euler. The Euler-Euler approach and VOF model gas-liquid flow in porous media have been used in this study. Governing equations on multi-phase flow are conservation of mass equations, linear momentum equations, and conservation of energy equations (if required). A finite volume formulation approach is used for this purpose [22].
Filtrate distribution modeling around the well
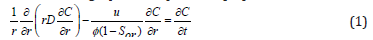
Filtrate concentration changes radially and depends on formation heterogeneity, formation porosity, fluid velocity, and time. Assuming constant formation porosity and incompressible fluid, the following equation is provided [15]:
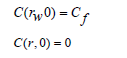
With initial conditions:
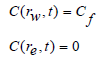
And boundary conditions in t>0 and q>0:
Dispersion factor D consists of two parts: convection - dispersion De and molecular distribution Dm which is expressed as follows [23]:

Considering filtrate velocity, we ignore the molecular distribution factor Dm compared to convection dispersion. For convection factor De there is the experimental equation based on fluid velocity (u) is expressed as follows [13].

Variables f and g are experimental numbers recorded as 1.25 and 51 [24].
Permeability and skin factor in the damaged zone
The filtrate concentration distribution and the corresponding penetration radius versus time were calculated in the previous section. Since we have assumed a water-based mud, filtrate concentration expresses the water saturation. With increasing water saturation, the relative permeability of the gas-phase will decrease.
Mud filtrate saturation is a function of filtrate concentration and irreducible water saturation, which is calculated by the following equation:

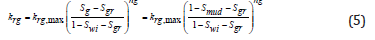
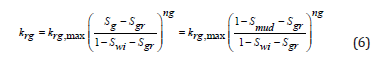
The power function developed by Corey and Brooks is used for the calculation of relative permeability using mud filtrate saturation [25].
For gas relative permeability:
For water relative permeability:
The following equation is used to estimate the formation damage:
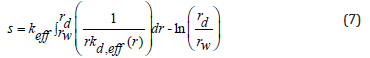
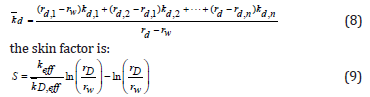
Reduction in permeability is numerically calculated by combining filtrate distribution and relative permeability equations. Average permeability in the invaded zone is calculated by the following equation:
Numerical Simulation
Perforation geometry and mesh
Perforations geometry and porous medium around them are shown in Figures 1 & 2. We have used symmetrical two-dimension geometry for this analysis. Having the symmetrical condition helps to reduce the simulation time significantly. The triangular mesh is used to increase the stability of the solution algorithm. Sensitivity analysis on dimensions and the number of meshes showed that the accuracy is independent of the mesh size. The applied boundary condition on different sides is shown in Figure 2. A combination of constant pressure and no-flow conditions is applied.


Results and Discussion
Validation
Validation of single-phase flow from a perforation

The experimental data provided by Nguyen is used to investigate the accuracy of the CFD model [26]. Results are used to investigate the effect of length and diameter of perforation on pressure drop. Figures 3 & 4 show the effects of increasing length and diameter of perforations on the total pressure drop. As shown, there is a good agreement between simulation and laboratory results. The simulated system consists of a core holder (one-meter length and 70 centimeters diameter) and perforations drilled with different diameters and lengths.

Validation of two-phase gas liquid flow from perforations
In this section, we will investigate two-phase flow pressure drop around perforations. The VOF model is used to perform a twophase solution. According to the perforation geometry considered by Ahmmad et al. [27], we have validated our results of the twophase CFD model, as illustrated in Figure 5. The liquid phase, in this case, is water, and the gas phase is air. A good agreement between simulation results and reported data is obtained. In gas-liquid flow with a constant amount of the liquid phase, the frictional pressure drop is decreased as the gas phase increases. This is due to the weakening effect of drag force in response to the decrease of the liquid volumetric percentage.

Validation of filtrate model
To validate our developed model, comparisons are made using the data published by Yan et al. [28]. The penetration depth of filtrate during 30 minutes in 13 rock samples is determined. Here, the mud is at the static condition with no mud circulation. The filtrate penetration radius along the wellbore is shown in Figure 6. As shown, the invaded depth varies from 40 centimeters at the beginning of the well to 10 centimeters at its end. Good agreement between simulation and reference data is achieved.

Extended simulation results
In this section, we investigate the effect of the following parameters on damage around the wellbore:
a) Damage due to drilling mud penetration (single perforation and a perforated interval)
b) Investigation of perforation geometry for single-phase (single perforation and a perforated interval)
c) Damage due to two-phase flow around the wellbore Damage due to mud filtrate
We quantify formation damage due to drilling mud dispersion by solving mud filtrate concentration around the perforation. Figure 7 shows the considered perforation geometry drilled half the way through the rock. Formation permeability is around 63mD and filled perforation permeability is 560mD. The only connection between drilling mud and formation is through the perforation.

Figure 8 shows the dispersion of mud filtrate. As can be seen at first it is only entered in the perforation and then penetrated into the whole formation. Mud filtrate profile into the formation is parabolic and progresses with time.
Single-phase gas flow around a perforation
Effect of the compact zone around a perforation
Solving single-phase gas flow around a perforation drilled 1/3 through the formation is shown in this section. Constant pressure boundary conditions are considered for inlet (6E+06 psia) and outlet (1E+06 psia) faces. Figure 9 shows pressure distribution for the case of porous medium permeability of 300mD, compacted zone permeability of 30mD with a thickness of 1 inch around perforation, and perforation permeability of 600mD filled with gravels. Figure 10 shows the velocity distribution for this case. Flow is uniform and converged at the center of the perforation, where the velocity is maximum.


Effect of perforation permeability
Figure 11 shows pressure distribution in a case like previous one, except that the formation permeability equal to 300mD and compact zone plus perforation permeability equal to 30mD. This is usually the case when perforations are not completely cleaned and inside the perforation tunnel is filled with debris, fines and miscellaneous materials.

Effect of flow boundary conditions
Figures 12 & 13 show the pressure and velocity distribution like the previous case as described in Figures 9 & 10, except that the constant-pressure boundaries are defined around the medium.
In this case, the pressures of upper and lower side boundaries are set constant as the inlet boundary pressure.
Two-phase gas-liquid flow around a perforation
We considered a core plug initially saturated with water and then started to inject gas as depicted In Figure 14. Perforation is at the outlet face, and saturation distribution before and after breakthrough is shown in Figure 15. As can be seen, when fluids are approaching the perforation tunnel, a high-pressure drop causes gas fingering and its rapid breakthrough.
Figure 16 shows phase concentration distribution without considering existing capillary forces in pores. As can be seen, phase concentration distribution is uniform.


Effect of perforation geometry on formation damage
In this section the amount of formation damage is quantifies by calculating skin factor for different cases. A two-dimensional geometry of the porous medium with permeability of 63mD is considered as shown in Figure 17. Pressure drop at the two ends of this porous medium is calculated at a low laminar flow rate. Resemble a casing, the outlet boundary is isolated and then a perforation with permeability of 560mD with different lengths and diameters is connected to the outlet. Additional pressure drops for each case compare to the case without casing is the skin factor associated with the corresponding case.


Determination of skin factor due to drilling mud filtrate Here the amount of drilling mud penetration in 20 minutes for different perforation lengths was simulated and skin factor is calculated. Figure 18 shows the increasing trend of skin factor with perforation length. Skin factor increases 2 times faster for short perforations up to 20cm length compare to the longer ones.

Skin factors for different perforation lengths and diameters
The analysis here applies for perforations after successful cleaning operation, i.e., no mud filtrate damage exists. For this purpose, we considered a 5-centimeter diameter perforation with different lengths. Figure 19 shows a sharp decrease in skin factor up to perforation length of 20cm; then, a steady reduction of skin with length is observed. This good impact, almost by 3 times, of short-length perforations sets a clear guideline for perforation operation design: they must be a minimum 20cm to be effectively reducing skin factors due to perforation. Now we investigate the effect of perforation diameter. For this purpose, a perforation with a one-meter length and different diameters is considered. Figure 20 shows reduction of skin factor by increasing perforation diameter from 2cm to 10cm. Since larger diameters come with shorter lengths, perforation optimization is required according to casing material, hole size, rock mineral, and perforation technology available.


Conclusion
CFD simulation is used to investigate production behavior around the perforations. In the cases described, associated formation damage and skin factor due to penetration of drilling mud into the perforations, perforation geometry, and multi-phase flow of gas-liquid around perforations are analyzed. The results of the simulations were validated with previously published data, and good agreement was observed. The following are the main findings of this study:
a) Perforation geometry and its design have a significant effect on total pressure drop. The existence of a compact zone around the perforations is the determinative factor in total pressure drop.
b) Perforations accelerate formation damage due to drilling mud penetration, especially for perforation lengths up to 20cm.
c) The length of clean perforations has a noticeable effect on decreasing skin factor. The decreasing skin factor rate is almost double for perforation lengths up to 20cm compared to more elongate perforations.
d) There is almost a linear relationship between skin factor and clean perforation diameter. Since larger diameters come with shorter lengths, perforation optimization is required according to casing material, hole size, rock mineral, and perforation technology available.
In multi-phase flow inside the reservoir, the second phase exerts more pressure drop to the system. The design of perforations will have a significant effect on controlling the multiphase flow.
References
- Alshawaf M,Gringarten A (2013) Impact of Completion on Wellbore Skin Effect. In 75th EAGE Conference & Exhibition incorporating SPE EUROPEC. European Association of Geoscientists & Engineers cp-348-01078. (SPE-164872).
- Besson J (1990) Performance of slanted and horizontal wells on an anisotropic medium. In European Petroleum Conference, Society of Petroleum Engineers.
- CarnegieA (1997) Application of Computer Models to Optimise Perforating Efficiency. In SPE Asia Pacific Oil and Gas Conference and Exhibition, Society of Petroleum Engineers.
- CincoLeyH, Ramey JH, MillerFG (1975) Pseudo-skin factors for partially penetratingdirectionally drilled wells. In Fall Meeting of the Society of Petroleum Engineers of AIME. Society of Petroleum Engineers.
- GhahriP (2010) Modelling of Gas-condensate flow around horizontal and deviated wells and cleanup efficiency of hydraulically fractured wells. Heriot-Watt University.
- GomesE,AmbasthaA (1993) Analytical expressions for pseudoskin for partially penetrating wells under various reservoir conditions. In SPE Annual Technical Conference and Exhibition. Society of Petroleum Engineers.
- GunaydinD, Shahab DM, Razi G, Kashy A (2007) Estimation of skin factor by using pressure transient testing results of a single rate well test.
- SafariM,GolsefatanA,JamialahmadiM (2014) Inhibition of scale formation using silica nanoparticle. Journal of dispersion science and technology35: 1502-1510.
- AdeniyiO,Nwalor J,AkoC (2008) A review on waterflooding problems in Nigeria's crude oil production. Journal of Dispersion Science and Technology29: 362-365.
- LiM, ZhouP, XiaoW, ZhangC, LiuZ (2020) Study on preparation and performance of fluid loss additive applied to chlorination titanium blast furnace slag. Journal of Dispersion Science and Technology, pp. 1-10.
- RaziMM, GhiassM, RaziFM (2013) Effect of guar gum polymer and lime powder addition on the fluid loss and rheological properties of the bentonite dispersions. Journal of dispersion science and technology34: 731-736.
- MovahediH, FarahaniMV,JamshidiS (2017) Application of Hydrated Basil Seeds (HBS) as the herbal fiber on hole cleaning and filtration control. Journal of Petroleum Science and Engineering152: 212-228.
- BakerL (1977) Effects of dispersion and dead-end pore volume in miscible flooding. Society of Petroleum Engineers Journal17(3): 219-227.
- BrooksRH, CoreyAT (1964) Hydraulic properties of porous media and their relation to drainage design. Transactions of the ASAE7(1): 26-28.
- CivanF, EnglerT (1994) Drilling mud filtrate invasion - improved model and solution. Journal of Petroleum Science and Engineering11: 183-193.
- MuskatM (1943) The effect of casing perforations on well productivity. Transactions of the AIME, 151(1): 175-187.
- McDowellJM,MuskatM (1950) The effect on well productivity of formation penetration beyond perforated casing. Journal of Petroleum Technology2(11): 309-312.
- MolinaO (2016) Analysis of production rates of a gas well using computational fluid dynamics and rate-dependent pseudo-skin factor. In SPE Annual Technical Conference and Exhibition. Society of Petroleum Engineers.
- HongK (1975) Productivity of perforated completions in formations with or without damage. Journal of Petroleum Technology27(8): 1027-1038.
- AlshawafM, Alain G (2012) Impact of Completion on Wellbore Skin Effect.
- ZhengL, RahmanM,AhammadM, ButtS, AlamJ (2016) Experimental and numerical investigation of a novel technique for perforation in petroleum reservoir. In SPE International Conference and Exhibition on Formation Damage Control, Society of Petroleum Engineers.
- MovahediH,Vasheghani FM, MasihiM (2020) Development of a Numerical Model for Single-and Two-Phase Flow Simulation in Perforated Porous Media. Journal of Energy Resources Technology142(4).
- DonaldsonEC,ChernoglazovV (1987) Characterization of drilling mud fluid invasion. Journal of Petroleum Science and Engineering 1: 3-13.
- PoulinTJ (1985) The determination of the coefficient of dispersion in sandstones. University of Oklahoma.
- BrooksRH, CoreyAT (1966) Properties of porous media affecting fluid flow. Journal of the irrigation and drainage division92(2): 61-90.
- NguyenT (1986) Experimental study of non-Darcy flow through perforations. In SPE Annual Technical Conference and Exhibition, Society of Petroleum Engineers.
- AhammadM, RahmanM, ZhengL, AlamJ, ButtS (2018) Numerical investigation of two-phase fluid flow in a perforation tunnel. Journal of Natural Gas Science and Engineering55: 606-611.
- YanJ, JiangG, WangF, FanW, SuC (1998) Characterization and prevention of formation damage during horizontal drilling. SPE drilling & completion13(4): 243-249.


