




 IJCSMB Home



dropdown Start here
Abstract
Glycogen accumulation is a physiological response in mammals to the increase in blood glucose concentration that occurs after a meal. Liver glycogen synthase, the enzyme responsible for glycogen synthesis, is highly regulated by phosphorylation and dephosphorylation and, it is also regulated by glucose-6-phosphate an allosteric effector. “In vivo” glycaemia, glycogen synthesis, liver glycogen synthase activity, and intracellular glucose-6-phosphate level during the fasted-to-refeed period in rats were studied. Furthermore, changes in the intracellular distribution of liver glycogen synthase were exposed by confocal and electronic microscopy.
Keywords:Liver; Glycogen Metabolism; Intracellular Distribution; Microscopy; Glycogensynthesis; Glycogen Accumulation; Hepatic Glycogen; Ultrathin Cryosections; Hepatocytes; Glucose 6Phosphate; Cell Periphery; Glucose Phosphorylation
Introduction
Hepatic glycogen synthesis is greatly enhanced in the post absorptive state when a large proportion of the absorbed glucose is directly converted into glycogen a reserve of carbon and energy. This glycogen accumulation is a physiological response in mammals to the increase in blood glucose concentration after a meal; the liver plays a central role in maintaining blood glucose homeostasis [1,2].
The mechanism of glycogen synthesis is not yet fully understood. In the liver, glycogen synthase (LGS) and glycogen phosphorylase (LGP) both are directly involved in glycogen metabolism to maintain postprandial blood glucose homeostasis [3 – 5]. LGS is the key enzyme controlling glycogen synthesis [6], it catalyzes the addition of α-1,4-linked glucose units from uridine diphosphate (UDP) glucose to a nascent glycogen chain. [7].
LGS is inhibited by phosphorylation at multiple sites mediated by protein kinases, such as protein kinase A and glycogen synthase kinase 3 (GSK3) [8,9]. In addition, LGS is activated by dephosphorylation via glycogen synthase phosphatase (GSP). Moreover, It is widely accepted that glucose phosphorylation as glucose-6-phosphate (G6P) constitutes a key step in hepatic glycogen synthesis promoting the covalent activation of LGS [10,11].On the other hand, LGP is activated by phosphorylation and inhibited by dephosphorylation by protein phosphatase 1 (PP1) [12], these events converge to activate GS and inhibit GP, resulting in accumulation of liver glycogen after a meal.
We have previously reported in isolated hepatocytes that glucose, besides its effect on the activation state of LGS, also changes the intracellular distribution of this enzyme. In response to glucose, the enzyme moves to the periphery of the cell [13]. This change in the subcellular distribution of liver glycogen synthase was related to the cell location in which glycogen synthesis begins [14].
The purpose of this study is to establish the physiological relevance of the subcellular distribution of liver glycogen synthase in liver glycogen synthesis in vivo. This study presents evidence that the translocation of LGS take place during the fasted to refeed transition in rats. Finally, translocation of hepatic glycogen synthase may then constitute a novel mechanism of regulation of liver glycogen synthesis.
Material and methods
Animals
Male Wistar rats weighing 200-230 g were used. Two dietary groups were selected: A) starved animals (control). All food was removed from the cage 24h before the experiments, but drinking water was available. B) refeed animals. After the 24-h starved rats, they were given access to food for 1, 2 or 4 hours. The experimental protocol was approved by the Ethical Committee at the Universitat de Barcelona (DAAM-8153). All experiments were performed in accordance with the guidelines and regulations established by the Universitat de Barcelona.
Preparation of samples
Rats were anaesthetised by inhalation of ethyl ether and plasma glucose concentration was measured. Immediately, livers were excised and samples were used for several biochemical measurements and LGS immune localization.
Glycogen Synthase activity, glycogen and Glucose-6- Phosphate determinations
Liver samples were homogenized in 10 volumes of ice-cold 10 mM Tris/HCl buffer (pH 7.4) containing 150 mM KF, 15 mM EDTA, 0.6 M sucrose, 1 mM phenylmethyl-sulphonyl fluoride, 1 mM benzamidine, 25 μg/mL leupeptin and 50 mM β-mercaptoethanol. Homogenates were centrifuged at 10,000 x g for 15 min at 4ºC, and supernatants were used for some determinations.
LGS activity was determined as described [15] using the low (0.25 mM)-to-high (10 mM) glucose 6-phosphate concentration. Liver glycogen content was determined after ethanol precipitation as described in [16], G6P was determined as described in [17], and protein was measured as described in [18].
Liver Glycogen synthase immunofluorescence labelling
Liver slices from starved and refeed rats were immediately fixed in 3% paraformaldehyde in PBS 0.1 M (pH=7.4) for 60 min and cryoprotected for 10 h in 2.1 M sucrose Then they were mounted on sample carriers and frozen in liquid nitrogen for cryosectionning. Cryosections of 1 μm of thickness were obtained in a Reichert-Jung ultramicrotome equipped with FL4 system for cryosectioning. For immunofluorescence labelling, obtained sections were blocked with 20 mM glycine 1% BSA in PBS (buffer A) for 10 min and incubated for 1 h at room temperature with a polyclonal antibody raised in rabbits against homogeneous rat liver glycogen synthase diluted 1:75. [9]. After 3 washes in PBS for 10 min, sections were incubated for 45 min at room temperature with a secondary antibody mixture (anti-rabbit-FITC) and phalloidin TRITC diluted in buffer A. After 3 washes in PBS, sections were mounted in a hydrosoluble immunofluorescence medium (Mowiol) and observed by laser scanning confocal microscopy.
Confocal images were obtained with a Leica TCS 4D (Leica Lasertechnik GmbH, Heidelberg, Germany) confocal scanning laser microscope (CSLM) adapted to an inverted microscope (Leitz DMIRB). Images were taken using a 63X (NA 1.4 oil) Leitz Plan- Apochromatic or a 100 X (NA 1.3 oil) Leitz Plan Fluotar objectives. FITC (liver glycogen synthase) and TRITC (actin filaments), were simultaneously excited at 488 and 568 nm lines of kripton-argon laser, green and red emitted fluorescence were detected in two photomultipliers used in parallel.
Each image collected was the average of four-line scans at the standard scan rate. The image size was 512x512 pixels. Colocalization analysis was performed by the Multi Colour software (vers 2.0, Leica Lasertechnik GmbH, Heidelberg). A twodimensional confocal cytofluorogram showed the correlation of the fluorescence signal from the two channels as a diagram: the fluorescence intensities of the green and red channels were represented in x-axis and y-axis respectively [19]. The coincidence labelling between the two single images was shown as the portion of the cytofluorogram located along the diagonal of the graph (x=y). The vertical (FITC) and horizontal (TRITC) portions of the graph are related to the single labelled regions within the two single images. The selected colocalization area in the cytofluogram was handily marked with a random window, shown in white pixels look-up-table and was directly identified in the combined image.
Liver Glycogen Synthase immune localization by electron microscopy
Small liver pieces from starved and refed animals were washed in PBS and fixed with 2% paraformaldehyde - 0.1% glutaraldehyde. Then they were cryoprotected for 10 h with 2.1 M sucrose, mounted on sample carriers and frozen in liquid nitrogen. Cryoultrasections were obtained in a ReichertJung ultramicrotome equipped with the FC4 system. Sections were transferred to a 100mesh grid with the carbon-coated formvar film. For immunolabelling on ultrathin cryosections, we followed the procedure described by [20] with slight modifications. Grids were washed 3x5 min on drops of 20 mM glycine in PBS and blocked with PBSgly 1% BSA for 20 min. Incubation (30 min) with the primary antibody rabbit anti-glycogen synthase at 1:75 dilution in the blocking solution was performed, followed by 3x5 min washes in PBSgly. The grids were incubated for 20 min in a solution of Aprotein labelled with 15 nm gold particles at 1:50 dilution. After 3 washes in PBS of 5 min each and 6 washes in double distilled water of 2.5 min each, the sections were contrasted in 0.3% uranyl acetate in methyl cellulose for 10 min on ice. Finally, grids were examined at the Hitachi 600 AB electron microscope (Hitachi Ltd. Tokyo, Japan). For quantitation analysis 15 photographs each of starved and refed immunodetected cryosections of 20,000X magnification were obtained on a Hitachi AB 600 electron microscope. To quantify the distribution of glycogen synthase in the interior of the hepatocytes, the cells were arbitrarily divided into two radial zones of identical thickness. The first zone was the most peripheral and included the plasma membrane, while the second was the closest to the nuclear envelope.
Statistical analyses
Statistical significance of differences was assessed by Student’s t-test.
Materials
Glucose-6-phosphate and UDP-glucose were obtained from Sigma Chemical Co. (St. Louis, MO, U.S.A.). Analytical-Grade reagents came from Merck (Barcelona, Spain). Protein AGold was obtained from Amersham (Madrid, Spain).
Results
Refeeding effects on glycaemia and liver glycogen content
When 24h starved rats were given access to pellet diet, an increase in plasma glucose concentration (glycaemia) was detected; in control-starved rats glycaemia was about 110 ± 9 mg/ dL whereas it raised to the maximum value, 188 ± 12 mg/dL after 2-h of having access to food (Table 1). The content of liver glycogen increased during the refeeding period: in starved rat livers It was 1.4 ± 0.1 mg/g of the liver and in refed rats increased up to 34.2 ± 1.5 mg/g of the liver after 4-h of restoring food (Table 1).
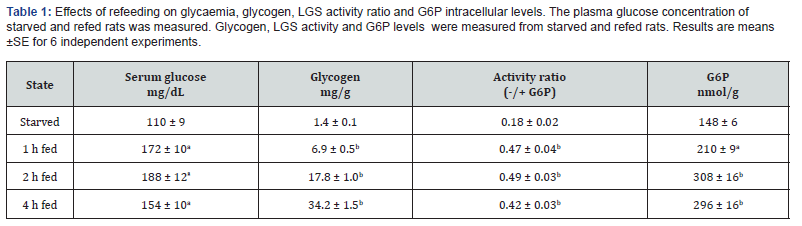
ap<0.01 versus starved
bp<0.001 versus starved
Effects of refeeding on liver glycogen synthase activity and intracellular G6P levels
Refeeding triggered the activation of hepatic glycogen synthase as previously observed for glucose in isolated hepatocytes [6]. LGS activity (+/-) measured in starved rats was 0.18 ± 0.02, however, the LGS activity ratio has the maximum value, 0.49 ± 0.03, at 2 h of refeeding (Table 1). Intracellular G6P level measured in starved rats was 148 ± 6 nmol/g of liver, whereas the maximum value, 308 ± 14 nmol/g of the liver, was also obtained after 2 h refeeding.
Effects of refeeding on the intracellular localization of LGS. Detection by confocal microscopy.
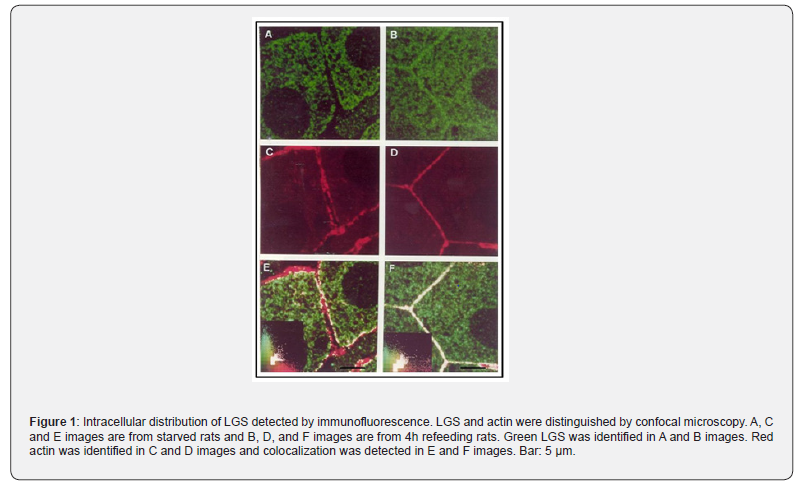
Liver slices were processed for immunofluorescence detection of LGS, and, at the same time, actin filaments were stained. In samples from starved rats, LGS was scattered through the cytoplasm with no apparent distribution (Figure 1A). After 4 h refeeding, LGS immunofluorescence was also observed within the cytoplasm however, a high fluorescence density was observed at the cell periphery (compare Figure 1A and Figure 1B). No apparent change in actin filament distribution was observed during the refeeding period (Figures 1C and 1D).
The increase of fluorescent signal of LGS at the cell periphery was more evident when colocalization analysis between LGS and actin fluorescence were performed (Figures 1E and 1F), indicating that the change in the distribution of LGS induced by refeeding correlated with a marked increase in the co-distribution of both proteins at the cell periphery.
A two-dimensional confocal cytofluorogram shows the correlation of the fluorescence intensities of the green (FITC) and red (TRITC) channels which were represented in x-axis and y-axis respectively. The selected colocalization area in the cytofluogram was handily marked with a random window, shown in white pixels look-up-table and was directly identified in the combined image. Confocal cytofluorogram showed about 40 % of LGS translocation after refeeding 4 h. This percentage was calculated by fluorescence density measures in LGS staining sections from control (starved rats) and in 4 h refeeding rats.
Effects of refeeding on the intracellular localization of LGS detected by electron microscopy (EM)
In order to study the intracellular distribution of LGS at higher resolution, liver slices were processed by cryoultramicrotomy, LGS was immunostained and Protein A-colloidal gold particles were detected by EM. Figure 2 shows representative pictures from liver slices of starved and refed rats. In Figure 2A (nucleus zone, N) and Figure 2B (plasmatic membrane zone, pm) from starved rats, LGS was spread into the cytoplasm. However, after 4 h refeeding more gold particles appeared towards the periphery of the cell, Figure 2C (N) and Figure 2D (pm).
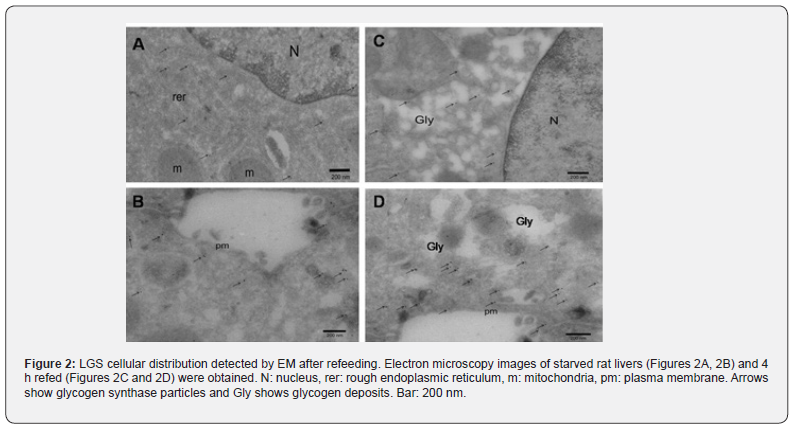
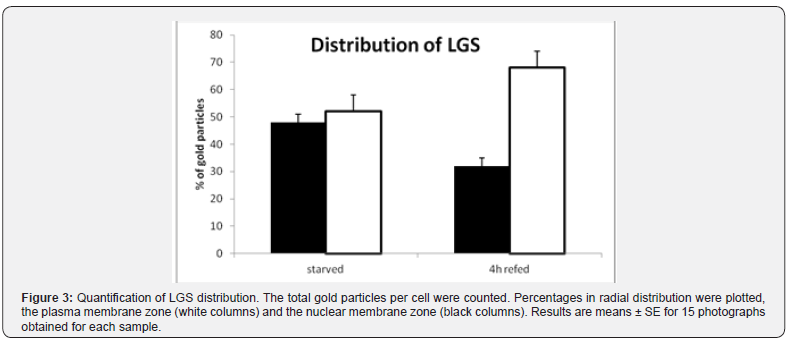
In order to quantify these observations, 15 photographs (20,000X; combined area 12.4 μm2) were obtained for each sample, the gold particles were counted and the radial distribution of these gold particles was plotted in two intervals. In liver from starved rats, few particles were present close to the membrane. In contrast, in the cell from 4 h refed rats, most of the gold particles were found near the membrane, thus confirming that glycogen synthase had translocated to the cell cortex in response to refeeding.
Figure 3 shows the total gold particles percentage per hepatocyte. From plasma membrane to nuclear membrane distances were divided into two halves, the first including the plasma membrane and the second one including the nuclear membrane. In livers from starved rats, 52% of gold particles are spread in the plasma membrane zone and, 48% in the nuclear membrane zone. On the other hand, in livers from 4 h refed rats 68 % of gold particles in the first half and, 32% in the second.
Discussion
The regulation of glycogen metabolism is critical for the maintenance of glucose homeostasis in mammals, but it is not completely understood. The results presented here deepen in understanding this part of metabolism and give a new vision. The results show a clear correlation between glycaemia, intracellular G6P levels, LGS activity and glycogen synthesis during the refeeding period. Greatest glycaemia value (2h refeeding) correlated with the highest intracellular G6P levels (2h refeeding) and also correlated with the highest LGS activity (2h refeeding). However, glycogen synthesis is increasing linearly during 4 h of refeeding, it is cumulative.
Blood glucose concentration increases in the post absorptive state and intracellular glucose phosphorylation take place [21], hepatic glycogen synthesis is very sensitive to changes in glycogen synthase activity and correlated more closely with the increase in free glucokinase activity, suggesting that glucose-induced translocation of glucokinase plays a major role in the control of glycogen synthesis. In addition, glucose phosphorylation as G6P plays a central role in activating LGS [10, 11, 22].
It has been reported that glucose, in addition to activating hepatic glycogen synthase [13, 23], triggers changes in the intracellular distribution of the enzyme in isolated hepatocytes from starved rats. In skeletal muscle from male Wistar rats, observed [24] that the muscle glycogen content and muscle glycogen synthase activity and localization were influenced by the nutritional animal state in the same way of this study.
The relevance of the LGS translocation in vivo has been studied. The enzyme can be found in the cell periphery of whole livers from refed rats, and this is precisely the place where glycogen synthesis starts [14]. Results obtained by confocal and electronic microscopy supports the biochemical observations that the subcellular localization of LGS was changing during the refed period.
Finally, this text provides a new approach on the liver glycogen metabolism, the glycogen synthase translocation must be considered as an additional regulatory mechanism controlling the synthesis of glycogen in the liver. The next step should be studying the translocation of liver glycogen synthase in diabetic animals.
Acknowledgments
We thank Ms Anna Adrover for skillful technical support, the Scientific and technological Facilities, University of Barcelona, for their assistance. We also thank Dr. Joan J. Guinovart for sharing his laboratory equipment and Ms Gladys Donald for assistance in preparing the English manuscript. This work was supported by grant BMC2002-00705, Ministry of Science and Technology (DGIMCYT), Spain.
Conflict of Interest
I confirm that I have no conflict of interest in relation to this manuscript.
References
- Roach PJ, Skurat AV, Harris RA, Cherrington AD, Jefferson LS, et al. (2001) in The Endocrine Pancreas and Regulation of Metabolism. Oxford Univ Press 2: 609-647.
- Agius L (2010) Physiological control of liver glycogen metabolism: lessons from novel glycogen phosphorylase inhibitors. Mini Rev Med Chem 10(12): 1175-1187.
- Hers HG (1976) The control of glycogen metabolism in the liver. Annu Rev Biochem 45: 167-189.
- Nuttall FQ, Gilboe DP, Gannon MC, Niewoehner CB, Tan AW (1988) Regulation of glycogen synthesis in the liver. Am J Med 85(5A): 77-85.
- Agius L (2008) Glucokinase and molecular aspects of liver glycogen metabolism. Biochem J 414(1): 1-18.
- Ferrer JC, Favre C, Gomis RR, Fernández-Novell JM, García-Rocha M, et al. (2003) Control of glycogen deposition. FEBS Lett 546(1): 127-132.
- Roach PJ, Depaoli-Roach AA, Hurley TD, Tagliabracci VS (2012) Glycogen and its metabolism: some new developments and old themes Biochem J 441(3): 763-787.
- Carling D, Hardie DG (1989) The substrate and sequence specificity of the AMP-activated protein kinase. Phosphorylation of Glycogen Synthase and Phosphorylase kinase. Biochim Biophys Acta 1012(1): 81-86.
- Beurel E, Grieco SF, Jope RS (2014) Glycogen Synthase kinase-3 (GSK3): regulation, actions, and diseases. Pharmacol Ther 148: 114-131.
- Villar-PalasíC, Guinovart JJ (1997) The role of glucose 6-phosphate in the control of glycogen synthase. FASEB J11(7): 544-558.
- Wilamowitz-Moellendorff A, Hunter RW, García-Rocha M, Kang L, López-Soldado I, et al. (2013) Glucose-6-Phosphate–Mediated Activation of Liver Glycogen Synthase Plays a Key Role in Hepatic Glycogen Synthesis. Diabetes 62(12): 4070-4082.
- Ceulemans H, Bollen M (2004) Functional diversity of protein phosphatase-1, a cellular economizer and reset button. Physiol Rev 84(1): 1-39.
- Fernández-Novell JM, Bellido D, Vilaró S Guinovart JJ (1997) Glucose induces the translocation of glycogen synthase to the cell cortex in rat hepatocytes. Biochem J 321(pt 1): 227-231.
- Fernández-Novell JM, López-Iglesias C, Ferrer JC, Guinovart JJ (2002) Zonal distribution of glycogen synthesis in isolated hepatocytes. FEBS Lett 531(2): 222-228.
- Guinovart JJ, Salavert A, Massagué J, Ciudad CJ, Salsas E, et al. (1979) Glycogen synthase: A new activity ratio assay expressing a high sensitivity to the phosphorylation state. FEBS Lett 106(2): 284-288.
- Chan TM, Exton JH (1976) A rapid method for the determination of glycogen content and radioactivity in small quantities of tissue or isolated hepatocytes. Anal Biochem 71(1): 96-105.
- Lang G, Michal G, Bergmeyer, Ultrich H (1974) D-Glucose-6-phosphate and D-fructose-6-phosphate. In: Methods of Enzymatic Analysis Academic press 3: 1238-1242.
- Bradford MM (1976) A rapid and sensitive method for the quantitation of microgram quantities of protein utilizing the principle of protein-dye binding. Anal Biochem7: 248-254.
- Demandolox D, Davoust J (1997) Multicolor analysis and local image correlation in confocal microscopy. J Microsc 185: 21-36.
- Griffiths G, Simmons K, Warren G, Tokuyasu KT (1983) Immunoelectron microscopy using thin, frozen sections: Applications to studies of the intracellular transport of Semliki Forest virus spike glycoproteins. Methods Enzymol 96: 466-485.
- Agius L, Peak M, Newgard CB, Gómez-Foix AM, Guinovart JJ (1996) Evidence for a role of glucose-induced translocation of glucokinase in the control of hepatic glycogen synthesis. J Biol Chem 271(48): 30479-30486.
- Ciudad CJ, Carabaza A, Guinovart JJ (1986) Glucose 6-phosphate plays a central role in the activation of glycogen synthase by glucose in hepatocytes. Biochem Biophys Res Commun 141(3): 1195-1200.
- Fernández-Novell JM, Roca A, Bellido D, Vilaró S Guinovart JJ (1996) Translocation and aggregation of hepatic glycogen synthase during the fasted-to-refed transition in rats. Eur J Biochem 238: 570-575.
- Nielsen JN, DeraveW, Kristiansen S, Ralston E, Ploug T, et al. (2001) Glycogen synthase localization and activity in rat skeletal muscle is strongly dependent on glycogen content. Journal of Physiology 531(Pt 3): 757-769.

























