Electrical Bioimpedance Spectroscopy as Biosensor Technique to Identify Pluripotent Stem Cells and Fibroblasts
Vazquez-Zapien GJ1, Mata-Miranda MM1, Guerrero-Robles CI1,2, Sanchez-Monroy V3, Lozano-Trenado LM4, Gonzalez-Diaz CA2*
1Escuela Militar de Medicina, Centro Militar de Ciencias de la Salud, SEDENA, México
2Escuela Superior de Medicina, Instituto Politécnico Nacional, México
3Escuela Nacional de Medicina y Homeopatía, Instituto Politécnico Nacional, México
4Escuela Militar de Graduados de Sanidad, Centro Militar de Ciencias de la Salud, SEDENA, México
Submission: July 26, 2017; Published: September 22, 2017
*Corresponding author: Gonzalez Diaz CA, Escuela Superior de Medicina, Instituto Politécnico Nacional, C.P. 11340, México,Tel: +52-5555202079; Fax: +52-5557296000; Email: gonzalezantoni@hotmail.com
How to cite this article: Vazquez Z G, Mata M M, Gonzalez D C, Guerrero-Robles C, Monroy V, et al. Electrical Bioimpedance Spectroscopy as Biosensor Technique to Identify Pluripotent Stem Cells and Fibroblasts. Int J cell Sci & mol biol. 2017; 3(2) : 555610. DOI: 10.19080/IJCSMB.2017.03.555610.
Abstract
Pluripotent stem cells have the capacity to differentiate into specialized cells, and it has relevance in the engineering of tissue regeneration. The identification and characterization of diverse cells types requires complex techniques as flow cytometry, immunocytochemistry and the exploration of molecular markers; such techniques require infrastructure and qualified personnel. The objective of this study was to analyse the use of Electrical Bioimpedance Spectroscopy (EBIS) measurements as non-complex alternative technique to identify populations of undifferentiated pluripotent mouse Embryonic Stem Cells (mESCs) and Mouse Embryonic Fibroblasts (MEFs). EBIS measurements were compared in populations of pluripotent stem cells and fibroblasts which were characterized previously using Fourier Transform Infrared (FTIR) spectroscopy and fluorescence microscopy. The results indicate that EBIS technique has potential sensitivity at certain frequency range to discriminate between both evaluated cell populations. Additional studies with different concentrations in order to evaluate quantitatively the sensitivity and specificity of the proposed technique are recommended.
Keywords: Biosensor; Spectroscopy; Bioimpedance; Stem cells; Pluripotent
Introduction
Stem Cells (SCs) culture has become relevant due to its capability to originate different cell lineages under certain culture conditions [1]. This cell differentiation ability is the trend in medical engineering for its use in tissue regeneration therapy [2,3]. According to their origin and developmental potential, SCs could be classified as totipotent, pluripotent, multipotent and unipotent [4]. To identify undifferentiated and differentiated cells, specialized techniques are required such as flow cytometry, immunocytochemistry and genes exploration [5-7]. In particular, characterization of mouse Embryonic Stem Cells (mESCs) has been developed by the exploration of pluripotent markers such as Nanog, Oct4 and SOX2 [8-10]. In addition, Fourier Transform Infrared (FTIR) spectroscopy has been used to investigate the structural and chemical properties of biological samples trough their vibrational spectra [11,12]. In 2013, Cao et al. analyzed functional groups associated to mESCs and Mouse Embryonic Fibroblasts (MEFs) [13]. The mentioned techniques are very efficient but require specialized personnel and infrastructure, so it is appropriate to propose emerging techniques that could help to facilitate the identification of diverse cells lines.
Bioimpedance measurements have been proposed since 1957 as an emerging tool for the study of the passive electrical properties of cells in suspension with potential value in biomedical applications [14]. Main advantages of the use of Electrical Bioimpedance Spectroscopy (EBIS) in biomedical research are: it requires low-cost instrumentation, is easily applicable in practice and enable on-line monitoring. Important EBIS biomedical applications have been focused on cells characterization. Coulter counter is a typical application of impedance methods in the cellular field; it is used to count the number of cells in a suspension and eventually to extract information about the cell sizes. Another important EBIS application was proposed in 2007 by Arum They et al. Han reported the feasibility to identify different tumor cell lines through the characterization of their electrical properties, measured with EBIS [15]. Cell growth characterization during culturing is also an important issue in a variety of biomedical applications. In 2013, Yi-Yu Lu et al. proposed the use of electrical bioimpedance spectroscopy-based multi-electrode as culture monitoring system to characterize PC12 cell growth, their findings showed important correlation coefficients between impedance and cell growth characterization [16].
In this study, we proposed the use of EBIS measurements as fundament biosensor of undifferentiated and specialized cells. The main objective of this work was to analyze the use of the EBIS as an alternative technique to identify populations of mESCs and MEFs. The main idea was to evaluate the technical feasibility of proposing measures of EBIS as simple technique to identify different cell lines.
Materials and Methods
Experimental design
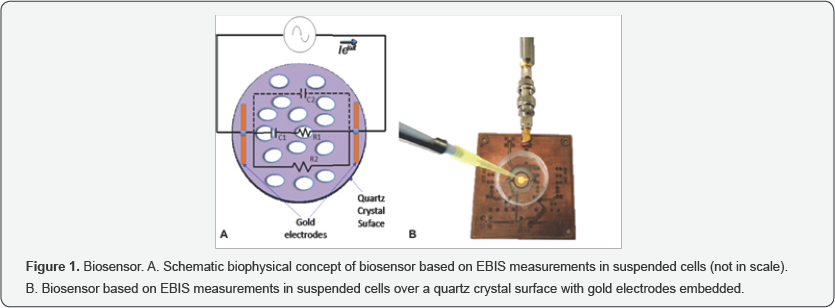
The biophysical concept of EBIS measurements in suspended cells is shown in Figure 1A. Two cell lines were evaluated, mESCs and MEFs. Approximately 2x10⁵ cells of each cell line were suspended in 200μl of Phosphate Buffer Solution (PBS) and placed over a quartz crystal surface with embedded gold electrodes in such a way that a consolidated volume was kept by capillarity. The electrodes represent the electric-ionic inter phase in which our biosensor proposal of the two studied cell lines is based (using EBIS measurements). Bioimpedance spectra at multiple frequencies for each cell type were measured by triplicate assays.
Cell cultures
Mouse embryonic stem cells (ATCC, SCRC-1011) were seeded at a density of 50,000 cells/cm2 on monolayers of mitotically inactive MEFs feeder cells. We used mESCs basal medium (ATCC, SCRR-2010), supplemented with 15% Fetal Bovine Serum (FBS) (ATCC; 30-2020), 0.1m M 2-mercaptoethanol (Invitrogen, 21985023) and 1,000U/ml mouse leukemia inhibitory factor (Chemicon; ESG1107). Before EBIS measurements of mESCs, these cells were separated from the monolayer of MEFs.
Mouse embryonic fibroblasts, STO cells (S, SIM, T, resistant to thioguanine, O, resistant to oubain), were cultured using Dulbecco's Modified Eagle's medium (DMEM) (ATCC; 30-2002), supplemented with 15% FBS and 1% penicillin-streptomycin (10,000IU/ml-10,000μg/ml) (Invitrogen; 15140). Both cell types were incubated at 37°C in a humidified incubator (5% CO2, 95% air), and once the cultures reached 70% confluence, three samples of 2x10⁵ cells were obtained and resuspended in +200μl of PBS.
Immunocytochemistry
Immunocytochemistry characterization of mESCs was developed using a Nanog, Oct4 and SOX2 marker panel (Abcam, ab107156). Titration experiments to determine the optimal antibody dilution were performed in mESCs cultures. mESCs were seeded in chamber slide (Lab-Tek, 177372); once cells reached 70% of confluence they were fixed in 4% paraformaldehyde (Sigma, P6148) and 0.15% picric acid (Sigma; 197378) for 30 minutes and then samples were washed with PBS twice. Subsequently, cells membranes were permeablized using 0.1% Triton X100 (Sigma, X100) in PBS at room temperature for 5 minutes, thereafter, samples were washed with PBS and incubated with blocking protein (Dako, X0909) for 20 minutes to inhibit nonspecific staining. Primary antibodies Anti Nanog (1:200, Abcam, ab80892), Anti Oct4 (1:250, Abcam, ab19857) and Anti SOX2 (1:250, Abcam; ab97959) were applied to samples and incubated overnight at 4 °C, thereafter samples were washed with PBS twice and secondary antibody, alexa fluor 488 goat antirabbit (1:250, Abcam, AB96895) was applied and incubated for 45 minutes in darkness. Finally, samples were washed with PBS and coverslipped with 10% glycerol. Microscopic observations were carried out in a fluorescence microscopy (Ti-U Eclipse, Nikon, Japan).
Fourier Transform Infrared Spectroscopy
To characterize the structural and chemical properties of the employed mESCs and MEFs populations, a FTIR spectrometer Bruker Vertex 70 was employed in the wavenumber interval of 400-4000cm-1 by using the Attenuated Total Reflectance (ATR) sampling mode to measure the infrared absorption of the samples. Cell samples were centrifuged at 1200rpm for 3 minutes, the supernatant was removed and a small volume (3μL) of the concentrated sample was placed on the surface of the ATR crystal. The infrared radiation propagates along the crystal to obtain the corresponding spectrum, which was averaged across several data acquisitions.
Experimental Bioimpedance Measurements
An experimental bioimpedance measurement system was implemented on the basis of a precision impedance meter (Agilent; Model 4294A), which supplied a signal I cos (Mt] in the range of 100MHz. The biosensor system was adapted by two electrodes positioned in such a way that the electric circuit is closed through a sample of PBS with suspended cells. Both electrodes are fabricated in gold embedded in a quartz crystal surface with radius r=9mm (QSX 301, Biolin Scientific Inc.) (Figure 1B). Measurements were developed in the frequency range of 100Hz to 100MHz at 181 steps spaced logarithmically. Bioimpedance magnitude and phase values were normalized (Norm) in every spectrum with respect to its own maximum value. The concept behind the system is that the measurements are representative for the changes of volumetric electrical properties in each sample; it means the frequency response of the complex impedance Z changes as a function of the sample cell type.
Results

Significative bioimpedance magnitude differences between mouse Embryonic Stem Cells and Mouse Embryonic Fibroblasts.
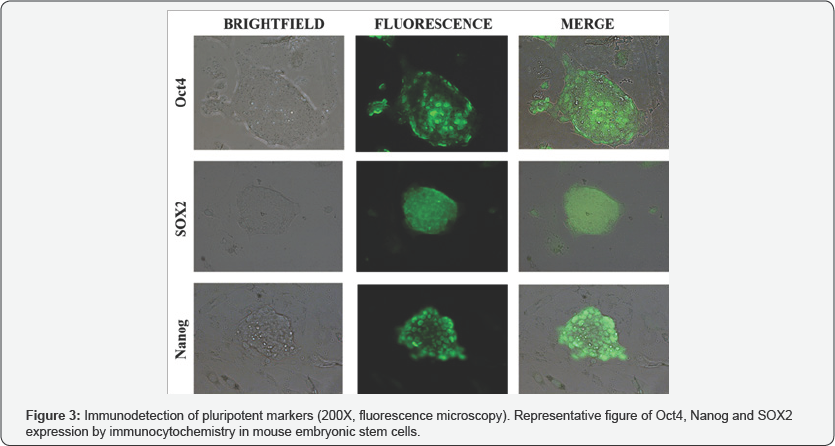
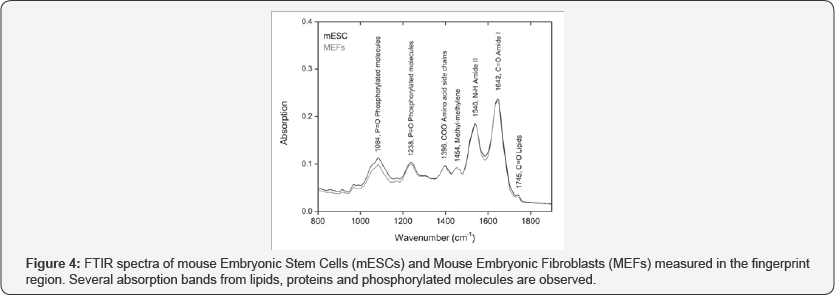
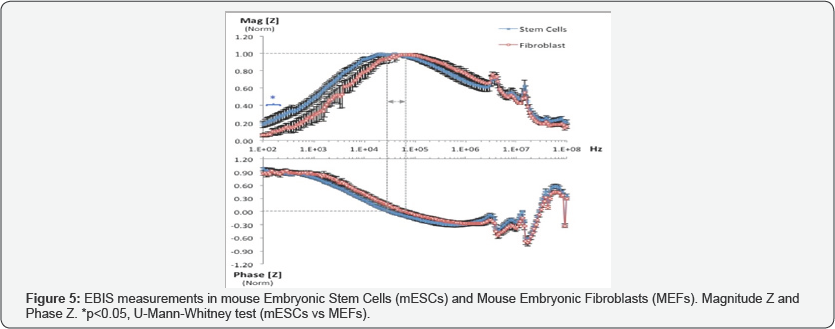
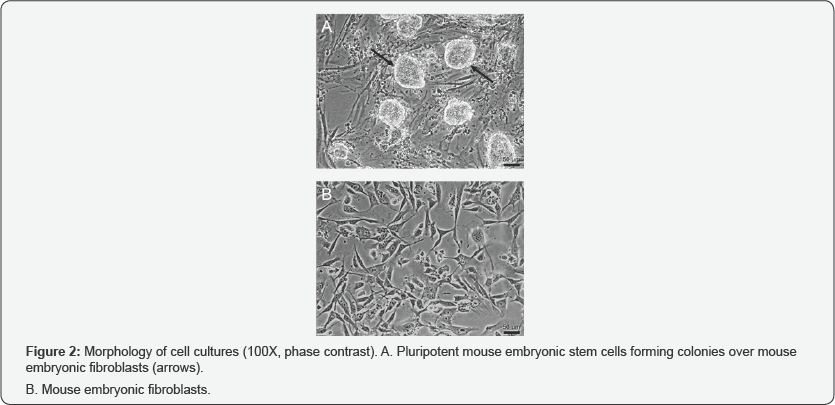
Microscopic observation of morphology in the cell cultures showed that mESCs were rounded in shape with a tendency to growth in colonies (Figure 2A). MEFs morphology was observed more complex, fusiform and did not make conglomerates (Figure 2B). Immunodetection of pluripotent markers in mESCs was evident for Nanog, Oct4 and SOX2 proteins evaluated by fluorescence microscopy (Figure 3). FTIR spectra of both mESCs and MEFs show absorption bands related with lipids, proteins, amino acids, methyl-methylene, and phosphorylated molecules which are present in this kind of cells (Figure 4). EBIS analysis showed differences in the complex impedance frequency response between mESCs and MEFs in the range of 1x10⁴ to 1x10⁵Hz (Figure 5)s. Significative bioimpedance magnitude differences between mESCs and MEFs were observed in the lowest frequencies (Table 1).
Discussion
The morphological characterization shows that the evaluated cell samples correspond to mESCs and MEFs populations. mESCs cultures grew in colonies, showing extensive capacity for replication, these colonies were comprised of many round cells with diffuse cytoskeletons (Figure 2A). In contrast, MEFs were adherent plastic ware cells, that spread out to form a monolayer of actively dividing cells; under a light microscope these cells are tapered with thin extensions, closed oval nucleus and scant cytoplasm (Figure 2B), such observations for mESC and MEFs are in agreement with Ginis et al. and Acosta et al. respectively [10,17]. immunocytochemistry assay of mESCs shows that this cell line in culture retains its undifferentiation state, evidenced by the expression of characteristic markers of pluripotency (Oct4, SOX2 and Nanog) [10]. In previous studies, our group as well as Chialin Chen et al. has reported the cell complexity characterization of mESCs. We have shown that mESCs retain a low cell complexity related to its undifferentiated state, and according its maturing process such complexity tends to increase [7,18].
Structure and chemical properties of the employed mESCs and MEFs were confirmed by the observation of its typical functional groups vibrational spectra. FTIR spectra of both SCs and fibroblasts measured in the fingerprint region 800-1900cm- 1are shown in Figure 4. Similar to our previous reports and Cao et al., we could detect a very weak band at 1745cm-1 arises from the C=O stretching vibration of lipid esters. An intense band at 1642cm-1 is related to the stretching C=O vibration of the amide I group of proteins, whereas the band at 1540cm-1 arises from the N-H bending vibration of the amide II group. The next protein bands at 1454 and 1396cm-1 are associated with methyl- methylene groups and COO- stretching vibrations of amino acid side chains respectively. Finally, the bands at 1238 and 1084cm-1 are due to the asymmetric and symmetric stretching vibrations of PO2 phosphodiester groups from phosphorylated molecules [11-13]. Large similarity between both kinds of embryonic cells can be observed, however the intensity of the band at 1084cm- 1 from MEFs is lightly diminished in comparison with the respective band of mESCs, probably due to its correlation with the regulation of stem cell self-renewal activity. This self-renewal mechanism shows that regulation of Nanog protein stability occurs through ERK1 mediated phosphorylation according to Kim et al. [19].
The bioimpedance measurements show sensitivity in the alpha dispersion bandwidth, this frequency range is associated with a low electrical conductivity of the cell membranes and most of the current must flow around the cells [20,21], in such conditions the structural cell components and its capacitive effects are relevant. The mESCs and MEFs populations evaluated show different morphological structural patterns as the observed in Figure 2A & 2B thus, is assumed that the reactive components between both types of cell structures are evidently different. The observation seems in agreement with previous report of changes in bioimpedance measurements as a function of cell morphology, maturity and functionality [22].
For analytical purpose, a classic simplified electrical model for cells in suspension was adapted from previous reports [14,20,21] and was represented by solid lines in Figure 1A. The membrane and cytoplasm of the cells are represented by C1 and R1 respectively; the conductive extracellular medium is represented by R2. In addition, we have considered that the used macro-electrodes induce a significative parasite capacitive effect C2, and it was represented in dotted lines in Figure 1A. Given the configuration of the whole involved passive elements, the integrated electrical model might correspond a pass band filter with a resonance effect approximately centered in the 10 to 100KHz band width, is evident that the specific resonance frequency could be defined as a function of C1 and R1, and such parameters are specifically associated to the morphological and biophysical characteristics ofthe evaluated cells. The morphology of mESCs indicates less complexity than MEFs (Figure 2), this condition is expected to reflect a different dielectric behavior in the integrated electrical model considered, in this sense lower capacitive values of C2 correspond to increment of the resonance frequency of the system, this behavior is in agreement with the experimental observation of the complex impedance frequency response between mESCs and MEFs, a shift of the resonance frequency is evidenced by coherent poles with maximum magnitude at zero phase values.
The purpose of this experiment was to analyze the use of the EBIS as an alternative technique to identify populations of mESCs and MEFs and to determine the technical feasibility of using simple and inexpensive instrumentation to identify different cell lines. In this sense, this work is a basic study and the assumptions for interpretation of the findings represents a preliminary analysis, we have estimated than additional experiments and analytical studies regarding the effect of different cells concentrations and the passive electrical properties involved in the observed phenomena are warranted.
Conclusion
The results indicate that EBIS technique has potential sensitivity at certain frequency range to discriminate between both evaluated cell populations. Additional studies with different concentrations in order to evaluate quantitatively the sensitivity and specificity of the proposed technique are recommended.
Aknowledgements
We thank Escuela Medico Militar now named Escuela Militar de Medicina on its 100th anniversary.
References
- Mata Miranda MM, Vazquez ZGJ, Sanchez MV (2013) Generalidades y aplicaciones de las células madre, Perinatol. Reprod. Hum 27(3): 194-199.
- Arévalo JA, Páez DM, Rodriguez VM (2007) Células madre mesenquimales: características biológicas y aplicaciones clínicas. NOVA 5: 177-184.
- Magallanes FM, Carmona B, Alvarez MA (2010) Aislamiento y caracterización parcial de células madre de pulpa dental. Rev Odont Mex 14(1): 15-20.
- Vázquez ZGJ, Rojas LM, Delgado MRJ, Martinez NLR, Perez IDG, et al. (2014) Histologic and spectroscopic study of pluripotent stem cells after implant in ocular traumatic injuries in a murine model. Stem Cell Res Ther 5(5): 119.
- Macias AC, Del Valle Perez LO, Galvan JA, De la Cuetara K, Socarras BB, et al. (2014) Phenotypic characterization of mesenchymal human stem cell from bone marrow and adipose tissue.preliminary results. Rev Cubana Hematol Inmunol Hemoter 30: 162-170.
- Ku HT, Zhang N, Kubo A, O'Connor R, Mao M, et al. (2004) Commiting embryonic stem cells to early endocrine pancreas in vitro. Stem Cells 22(7): 1205-1217.
- Vazquez-Zapien GJ, Sanchez-Monroy V, Chirino YI, Mata-Miranda MM (2013) Morphological, genetic and protein characterization in the differentiation of embryonic stem cells to early pancreatic cells. Int J Morphol 31: 1421-1429.
- Singh SK, Kagalwala MN, Parker TJ, Adams HA, Majumder S (2008) REST/NRSF maintains self-renewal and pluripotency of embryonic stem cells. Nature 453(7192): 223-227.
- Pan G, Thomson JA (2007) Nanog and transcriptional networks in embryionic stem cell pluripotency. Cell Res 17(1): 42-49.
- Ginis I, Luo Y, Miura T, Thies S, Brandenberger R, Gerecht Nir S (2004) Differences between human and mouse embryonic stem cells. Dev Biol 269(2): 360-380.
- Mata Miranda MM, Vázquez Zapién GJ, Rojas Lopez M, Sanchez Monroy V, Perez Ishiwara DG et al. (2017) Morphological, molecular and FTIR spectroscopic analysis during the differentiation of kidney cells from pluripotent stem cells. Biol Res 50(1): 14.
- Vázquez Zapién GJ, Mata MMM, Sanchez MV, Delgado MRJ, Perez IDG, et al. (2016) FTIR spectroscopic and molecular analysis during differentiation of pluripotent stem cells to pancreatic cells, Stem Cells. Int ID 6709714 p. 10.
- Cao J, Ng ES, Mc Naughton D, Stanley EG, Elefanty AG, et al. (2013) The characterisation of pluripotent and multipotent stem cells using Fourier transform infrared microspectroscopy. Int J Mol Sci 14(9): 17453-17476.
- Schwan HP (1957) Electrical properties of tissue and cell suspensions. Adv Biol Med Phys 5: 147-209.
- Han A, Yang L, Frazier AB (2007) Quantification of the heterogeneity in breast cancer cell lines using whole-cell impedance spectroscopy. Clin Cancer Res 13(1): 139-143.
- Lu YY, Huang JJ, Huang YJ, Cheng KS (2013) Cell growth characterization using multi-electrode bioimpedance spectroscopy. Meas Sci Technol 24(3).
- Acosta A (2006) Fibroblast: its origin, structure, functions and heterogeneity within the periodontium. Univ Odontol 25: 26-33.
- Chen C, Chai J, Singh L, Kuo CY, Jin L, et al. (2011) Characterization of an in vitro differentiation assay for pancreatic-like cell development from murine embryonic stem cells: detailed gene expression analysis. Assay Drug Dev Technol 9(3): 403-419.
- Kim SH, Kim MO, Cho YY, Yao K, Kim DJ, et al. (2014) ERK1 phosphorylates Nanog to regulate protein stability and stem cell selfrenewal. Stem Cell Res 13(1): 1-11.
- Foster KR, Schwan HP (1989) Dielectric properties of tissues and biological materials: a critical review. Crit Rev Biomed Eng 17(1): 25104.
- Grimnes S, Martinsen OO (2008) Bioimpedance & Bioelectricity Basics. (2nd edn) Academic Press, Great Britain, UK, pp. 87-89.
- Savolainen V, Juuti UK, Onnela N, Vaajasaari H, Narkilahti S, et al. (2011) Impedance spectroscopy for determining human embryonic stem cell- derived retinal pigment epithelium maturity. Invest Ophthalmol Vis Sci 39(12): 3055-3069.


