Extractive Spectrophotometric Methods for the Determination of Dothiepin in Pure and Pharmaceutical Formulations
Umamaheswar K, Naganjaneyulu T and Rambabu C*
Department of Chemistry, Acharya Nagarjuna University, India
Submission: March 27, 2017; Published: May 10, 2017
*Corresponding author: Rambabu C, Department of Chemistry, Acharya Nagarjuna University, India, Tel: 9949838299; Email: rbchintala@gmail.com
How to cite this article: Umamaheswar K, Naganjaneyulu T, Rambabu C. Extractive Spectrophotometric Methods for the Determination of Dothiepin in 004 Pure and Pharmaceutical Formulations. Glob J Pharmaceu Sci. 2017; 2(2) : 555582. DOI: 10.19080/GJPPS.2017.02.555582
Abstract
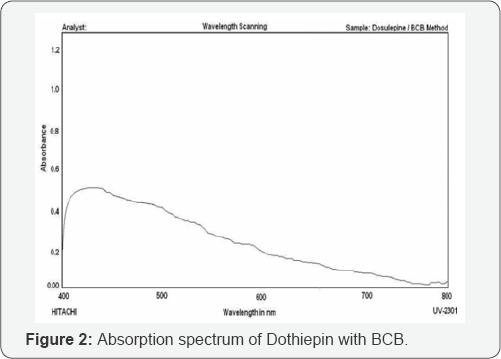
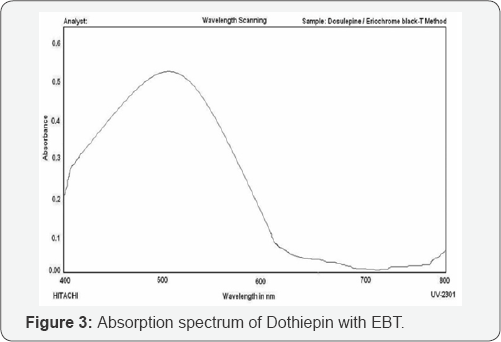
Two sensitive and accurate extractive spectrophometric methods have been developed for the estimation of dothiepin in pure and pharmaceutical dosage forms. The developed methods are based on the formation of colored solvent extractible ion-association complexes of the drug with bromocresol blue [BCB] and eriochrome black-T [EBT]. The extracted complexes showed absorbance maxima at 418 and 508 nm respectively. Beer's law is obeyed in the concentration ranges between 16 - 56 and 5-17.5μ/mL for the two methods respectively. The effective concentration of dye, pH and optimum conditions are established for these methods. The methods are applied for the determination of the drug in commercial tablets and results of analysis are validated statistically through recovery studies.
Keywords: Dothiepin; Spectrophotometric methods; BCB; EBT; Dichloromethane; Chloroform
Introduction
Dothiepin also known as dosulopin, is a thio analogue of amitriptyline which has been used extensively. It is a safe and effective agent for the treatment of major depressive disorders [1]. Although the onset of action is comparable to that of other tricyclic antidepressants, dothiepin may cause fewer intolerable side effects and have less cardiotoxicity than the other compounds. In addition, dothiepin reduces the anxiety associated with some major depressive episodes. These features suggest that dothiepin may be particularly helpful for treating anxious depressed patients and patients who have underlying cardiac disease or who are elderly [2] (Figure 1).
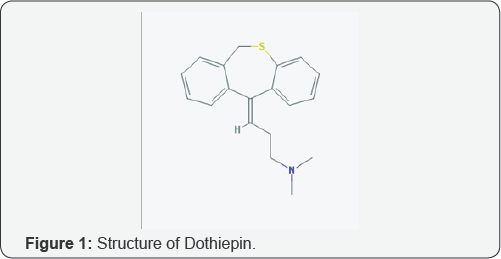
Few validated methods for quantification of dothiepin like HPLC [3-5], LCMS [6], spectrophotometry [7,8] are so far reported. The determination of dothiepin along with other anti depressants [9-11] and capillary electrophoresis method of analysis [12] is also reported. In this study, we report two simple extractive spectrophotometric methods for the determination of the dothiepin.
Materials and Methods
Apparatus
Spectral and absorbance measurements were carried out by using ELICO UV-Visible double beam spectrophotometer model SL-159 equipped with 1.0cm thickness matched quartz cells. Systronics digital pH meter was used to adjust and determine the hydrogen ion concentration of the buffer solution.
Preparation of Standard drug solution
Pharmaceutical grade dothiepin (99.8% pure), was used in method development. A stock standard solution containing1.0mg. mL-1 was prepared by dissolving accurately weighed (100mg) of pure drug with double distilled water in 100mL calibrated flask. This stock solution is further diluted appropriately with double distilled water to get a working standard concentration of 200μg.mL-1 for the proposed methods.
Reagents and solutions
All chemicals and reagents used were of analytical grade or pharmaceutical grade. All solutions were prepared in doubly distilled water.
Hydrochloric acid (0.1M, SD Fine Chemicals, India)
Prepared by diluting 8.5mL of concentrated acid to 1 liter of double distilled water.
Buffer solution, pH 4.0
Prepared by mixing 50mL of 1.0 M sodium acetate solution with 39.5mL of 1.0M HCl solution and diluted to 250mL with doubly distilled water. The pH of the solution was adjusted to an appropriate value with the aid of a pH meter.
BCB method (M1)
Aliquots of the drug (0.8-2.8mL) were taken in a series of 25mL separating funnels. 0.5mL of 0.1M HCl solution and 2.0mL of 0.2% BCB solution were added, shaken well and made the solution to 15mL with distilled water. Then the color of the aqueous layer was extracted with 10mL of dichloromethane. The absorbance of the organic layer was measured at 418nm against a reagent blank.
EBT method (M2)
Into a series of separating funnels, appropriate amount of the working standard drug solutions were pippetted out. To each funnel 2.0 mL of pH 4.0 buffer solution and 1.0 ml of 0.1% w/v eriochrome black-T were added. Shaken well for 2min and the volume of the aqueous phase was made up to 15mL with distilled water. A 10 mL of chloroform was added to each funnel. The solutions were shaken for thorough mixing of the two phases and were allowed to stand for clear separation of the layers. The absorbance values of the chloroform layers were measured against their respective reagent blank at the wavelength of the maximum absorbance at 508nm.
Results and Discussion
Method development
In order to ascertain the optimum wavelength of maximum absorption (λmax) of the colored species formed in the above methods, specified amounts of dothiepin were taken and colors were developed separately by following the above proposed procedures.The absorption spectra were scanned on a spectrophotometer in the wave length region from 400 to 800nm against similar reagent blank or distilled water and are shown in Figure 2 & 3. These spectra show a single well-defined peak with characteristic absorption maxima where as the blank in each method has low or no absorption in this region. The wavelength of absorption maxima of each proposed method was used for the visible spectrophotometric analysis of dothiepin in bulk samples.
Optimization studies of experimental variables for the proposed procedures
The optimization studies for the color development by the proposed methods for the assay of dothiepin were established by varying the parameters one at a time, keeping the others fixed and observing the effect produced on the absorbance of the colored species and were found to be same as described in Table 1.

Method validation
Optical Characteristics: In order to test whether the colored species formed in the above methods, adhere to Beer's law, the absorbances at appropriate wavelengths of a set of solutions containing varying amounts of dothiepin and specified amounts of reagents (as given in the recommended procedures for each method) were recorded against the corresponding reagent blanks. The Beer's law plots of these systems are recorded graphically (Figure 3 & 4).
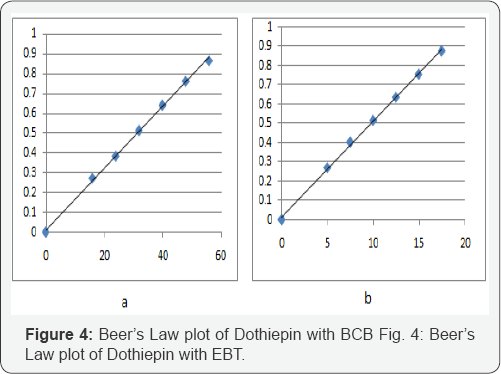
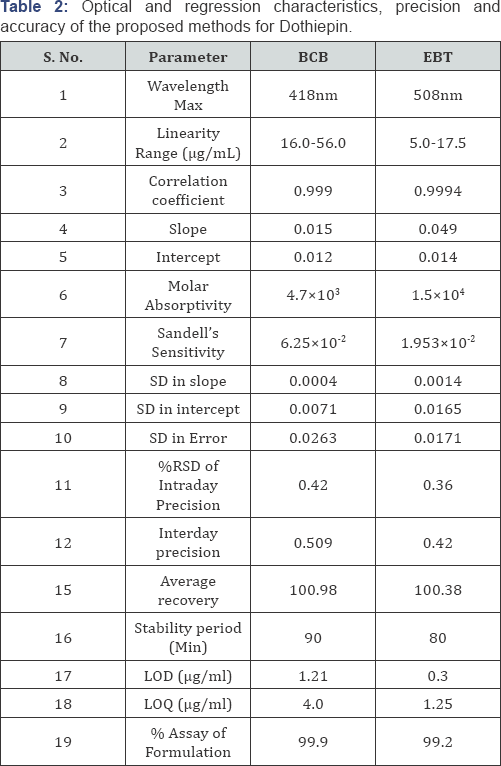
Linearity range and analytical data: Linearity ranges for each proposed spectrophotometric method for quantitative analysis of dotheipin, were made by plotting calibration curves over the concentration ranges cited. The statistical parameters (optical characteristics) such as Beer's law limits, correlation coefficient, Sandell’s sensitivity, molar absorptivity, percent relative standard deviation (calculated from six replicate samples containing 3/4th of the amount of the upper Beer’s law limits) were calculated for all the proposed methods and the results are summarized in Table 2.
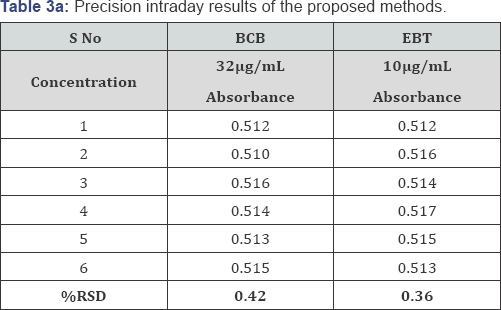
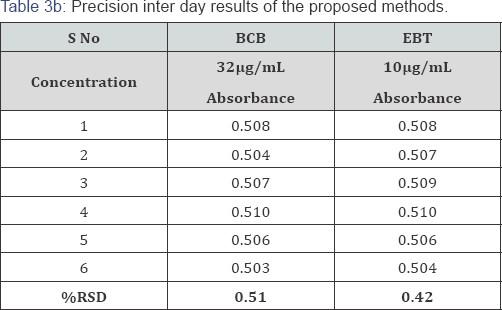
Precision: The precision of each proposed method was ascertained from the absorbance values obtained by actual determination of six replicates of a fixed amount of dothiepin (32.0μg/mL) for BCB and (10.0μg/mL) for EBT methods in Intraday and Inter day and the results are summarized in Table 3. The percent relative standard deviation (0.43 and 0.36 for Intraday precision & 0.51 and 0.42 for Inter day precision) and percent range of error (at 0.05 and 0.01 confidence limits) were calculated for the proposed methods (Table 3).
Recovery studies: To ensure the accuracy and reproducibility of the results obtained, known amounts of pure drug was added to the previously analyzed formulated samples and the samples were reanalyzed by the proposed methods. The percentage recoveries thus obtained were given in Table 4.

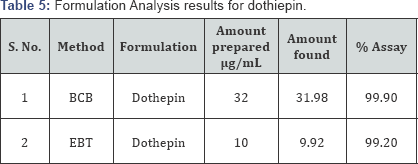
Application to the analysis of commercial sample: In order to check the validity of the proposed methods, the drug Dosulepin was determined in commercial formulations. From the results of the determination it is clear that there is a close agreement between the results obtained by the proposed methods and the label claim. These results indicate that there was no significant difference between the proposed methods and the reference methods with respect to accuracy and precision (Table 5).
Conclusion
Two sensitive spectrophotometric methods have been developed, optimized and validated for the determination of dothiepin in pure drug and in tablet dosage forms. The simplicity, sensitivity and selectivity make these methods a suitable alternative to the HPLC methods. Other characteristics such as short performance time, ease of handling, no requirement of either expensive equipments or specialized technicians also suggest that the procedures developed by the authors can be adopted as routine laboratory methods in quality control laboratories where modern instruments are not available.
References
- Maguire KP, Burrows GD, Norman TR, Scoggins BA (1981) Metabolism and pharmacokinetics of dothiepinBr. J Clin Pharmacol 12 (3): 405409.
- Bareggi SR, Cavallaro R, Pirola R, Altamura AC (1990) Pharmacokinetics and adverse effects of single doses of dothiepin in young and elderly subjects-Progress in Neuro-Psychopharmacology and Biological Psychiatry 14 (2): 163-170.
- Shibanoki S, Imamura Y, Arakawa Y, Ishikawa K (1987) Determination of dosulepin and its metabolite application of high performance liquid chromatography with electrochemical detection. J Chromatogr 415(2): 365-371.
- Aruna PA, Ajitha V, Uma Maheshwar Rao (2014) Analytical method development and validation of simultaneous estimation of dosulepin and methylcobalamin in tablet dosage form by RP-HPLC. International Journal of Pharmacy 4(3): 267-274.
- Rambabu C, Venkatrao S V, Umamaheswar K (2013) Development and validation of a RP-HPLC method for the determination of Dosulepin in Pharmaceutical Formulations. American Journal of Pharmatech Research 3(2): 319-327.?
- Kollroser M, Schober C (2002) Simultaneous determination of seven tricyclic antidepressant drugs in human plasma by direct-injection HPLC-APCI-MS-MS with an ion trap detector. The Drug Monit. 24(4): 537-544.
- Dhara Desai, Dimal Shah, Falgun Mehta, Usmangani K et al. (2014) First Order Derivative Spectrophotometric Estimation of Dosulepin and Methylcobalamin in Pharmaceutical Formulation. International Journal of Pharmacy and Integrated Life Sciences 2(5): 126-138.
- Sameer AM, Abdulrahman, Basavaiah K, Cijo MX, Vinay KB, et al. (2012) Validation of UV Spectrophotometric methods for the determination of Dothepine hydrochloride in Pharmaceutical dosage form in stress degradation studies. Journal of Applied Spectroscopy 79(5): 780-787.
- Shivakumar Reddy L, Prasad Reddy SLN, Srinivas Reddy G (2014) Validated Stability Indicating Liquid Chromatographic Method for Simultaneous Estimation of Dosulepin and Methylcobalamin in Combined Pharmaceutical Dosage Form Orient. J Chem 30(3): 12431251.
- Desai DB, Shah D, Falgun AM, Usmangani KC, Kashyap KB (2014) Liquid Chromatographic Estimation of Dosulepin HCl and Methylcobalamin in Pharmaceutical Formulation Research and Reviews. J Pharmaceutics & Nanotechnology 2(2): 29-35.
- Usharani G, Chandrashekar B, Devanna N (2014) Simultaneous Estimation of Dosulepin and Methylcobalamin in Bulk and Pharmaceutical Formulation by Reverse Phase High Performance Liquid Chromatography (RP-HPLC). Journal of Pharmacy and Biological Sciences 9(3): 55-59.
- Clark BJ, Barker P, Large T (1992) The determination of the geometric isomers and related impurities of dothiepin in a pharmaceutical preparation by capillary electrophoresis. J Pharm Biomed Anal 10(10- 12): 723-726.


