




 ECOA Home




Physico-chemical Characteristics and Water Quality Assessment of Nwaniba River, Southeastern Nigeria
Asuquo IE1*, Asuquo GI2 and Abiaobo NO3
¹1Department of Fisheries and Aquaculture, Akwa Ibom State University, Nigeria
²School of Applied Sciences, Edinburgh Napier University, Edinburgh, Scotland
3 Department of Zoology, Akwa Ibom State University, Nigeria
Submission: August 25, 2026;Published: October 23, 2026
*Corresponding author: Asuquo IE, Department of Fisheries and Aquaculture, Akwa Ibom State University, Nigeria.
How to cite this article: Asuquo IE, Asuquo GI, Abiaobo NO. Physico-chemical Characteristics and Water Quality Assessment of Nwaniba River, 002 Southeastern Nigeria. Ecol Conserv Sci. 2026; 5(3): 555663 DOI:10.19080/ECOA.2026.05.555663
Abstract
Twelve physico-chemical parameters of Nwaniba River, a tropical freshwater system in Uruan Local Government Area, Akwa Ibom State, Southeastern Nigeria, were investigated monthly from June to December 2025 at three sampling stations (upstream, midstream and downstream) using standard analytical methods (APHA, 2005). Mean (±SE) values recorded were: air temperature 24.08±0.24°C, water temperature 26.56±0.28°C, pH 6.92±0.14, dissolved oxygen (DO) 5.54±0.43mg∙L⁻¹, biochemical oxygen demand (BOD) 4.59±0.21mg∙L⁻¹, electrical conductivity 6.12±0.49µS∙cm⁻¹, nitrate 0.33±0.06mg∙L⁻¹, ammonia 3.92±0.21mg∙L⁻¹, phosphate 0.11±0.01mg∙L⁻¹, sulphate 0.74±0.17mg∙L⁻¹, total alkalinity 79.43±5.02mg∙L⁻¹ and total dissolved solids (TDS) 3.05±0.39mg∙L⁻¹. All parameters except nitrate showed no significant seasonal variation (P>0.05). Pearson correlation identified a strong positive association between conductivity and TDS(r = 0.795, P<0.01) and between water temperature and pH(r = 0.678, P<0.01). Principal component analysis resolved three components jointly explaining 58.65% of total variance, with Component 1(24.57%) dominated by nitrate, pH and BOD. All recorded values fell within limits considered acceptable for unpolluted tropical freshwater, indicating that Nwaniba River remained within a generally good water quality status over the study period. These findings provide baseline water quality data to support the sustainable management of this previously under-studied river.
Keywords: Akwa Ibom State; Nwaniba River; Physico-Chemical Parameters; Seasonal Variation; Water Quality
Abbreviations: DO: Dissolved Oxygen; BOD: Biochemical Oxygen Demand; ANOVA: Analysis Of Variance; TDS: Total Dissolved Solids; SE: Mean; PCA: Principal Component Analysis
Introduction
Rivers and streams are of strategic importance worldwide, providing water for domestic, industrial and agricultural purposes while organising the landscape and ecological setting of a drainage basin [1]. The quality and quantity of surface water in a river basin are influenced both by natural factors such as rainfall, temperature and rock weathering, and by anthropogenic changes that alter natural flow or hydrochemistry [2]. Water quality attributes are primary determinants of fish survival, reproduction, growth performance and overall biological production [3,4], affecting aquatic biotic integrity both directly through mortality and indirectly through shifts in competitive ability among species [5,6].
Most rivers and their tributaries in developing regions serve simultaneously as sources of drinking water and as receptacles for domestic, agricultural and industrial waste, a dual role that places considerable pressure on water quality as population growth, urbanisation and changing land use intensify [7]. The nature and concentration of chemical constituents in freshwater systems change in response to physical, chemical, hydrological and biological processes [8,9], themselves shaped by climate, geography and geology [10]. Similar assessments of physico-chemical status have been reported for several freshwater systems in Akwa Ibom State and southeastern Nigeria [8,11,12].
Nwaniba River, located in Uruan Local Government Area of Akwa Ibom State, Southeastern Nigeria, is an important source of water for its riparian community and supports domestic use, dry-season farming and subsistence fishing. Despite this socio-economic importance, published baseline data on its water quality remain limited. This study addresses that gap by characterising the temporal and spatial variation in twelve physico-chemical parameters of Nwaniba River over a seven-month period (June-December 2025), examining inter-parameter relationships through correlation and principal component analysis, and evaluating the river’s water quality status against established freshwater quality benchmarks.
Literature Review
Physico-chemical characterisation of tropical African rivers has repeatedly shown that temperature, dissolved oxygen, pH and nutrient concentrations are among the most sensitive indicators of seasonal hydrological change and local land-use pressure [11,13,14]. In Nigerian systems, BOD values below about 5mg∙L⁻¹ are generally taken to indicate clean to fairly clean water [15], while elevated nitrate and phosphate are frequently linked to agricultural fertiliser run-off [6,16,17]. Spatial gradients from upstream to downstream often reflect the concentration of domestic effluent near settlements and the recovery of dissolved oxygen where current velocity increases [8]. Principal component analysis and correlation analysis are widely used to summarise multi-parameter water-quality datasets [1,2]. Site-specific baselines remain essential because seasonality and parameter patterns cannot be reliably extrapolated from one water body to another within the same climatic zone [18-22].
Materials and Methods
Study Area
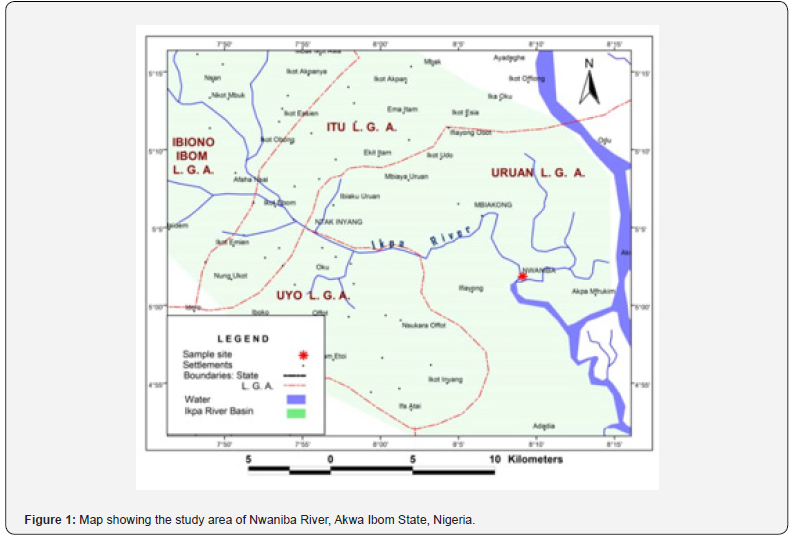
Nwaniba River (Figure 1) is located in Uruan Local Government Area of Akwa Ibom State, Southeastern Nigeria, approximately 50 km from Uyo, the state capital. It is bounded by Uyo to the north, Nsit Atai to the south, Okobo to the east and Itu to the west. The river lies between 4°51′0″N and 8°01′0″E, has a predominantly sandy and muddy bed, moderately fast current from upstream to downstream, and patches of aquatic macrophyte cover. It experiences a tropical humid climate with distinct wet and dry seasons. Three sampling stations were established: Station 1 (upstream, 04°50′29.3″N, 8°03′19.9″E), located where domestic effluent and surface run-off enter the river directly; Station 2 (midstream, 04°50′01.8″N, 008°02′57.8″E), characterised by sand dredging activity and dense macrophyte cover; and Station 3 (downstream, 04°49′49.3″N, 008°02′56.1″E), characterised by swift current. The river had a mean depth of 1.1 m and mean width of 8.3 m.
Sample Collection and Analysis
Water sampling was conducted monthly at the three stations from June to December 2025, between 08:00 and 10:00 h, following standard methods [10,23]. Surface water was collected at mid-channel at each station using pre-washed plastic bottles; samples for biochemical oxygen demand (BOD) were collected in brown glass-stoppered bottles filled without trapping air. Non-conservative parameters-temperature, pH, dissolved oxygen (DO) and electrical conductivity-were measured in situ in triplicate. Remaining samples were transported to the laboratory for determination of BOD (5-day incubation at 20°C), total alkalinity (titrimetric method), total dissolved solids (gravimetric method), nitrate (Brucine method), phosphate (vanadomolybdate method), sulphate (turbidimetric gelatin-BaCl₂ method) and ammonia (Nessler’s colorimetric method).
Statistical analysis
Monthly and seasonal (wet: June-August; dry: September-December) means, standard errors, ranges and coefficients of variation were computed for all twelve parameters. Seasonal differences were tested by one-way analysis of variance (ANOVA) at the 5% probability level. Pearson product-moment correlation was used to examine pairwise relationships among parameters, and principal component analysis (PCA) was applied to identify the dominant sources of variance in the physico-chemical dataset.
Results and Discussion
Monthly Variation in Water Quality Parameters
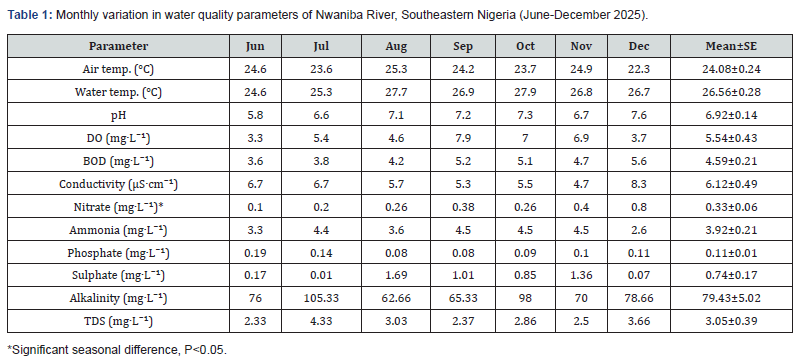
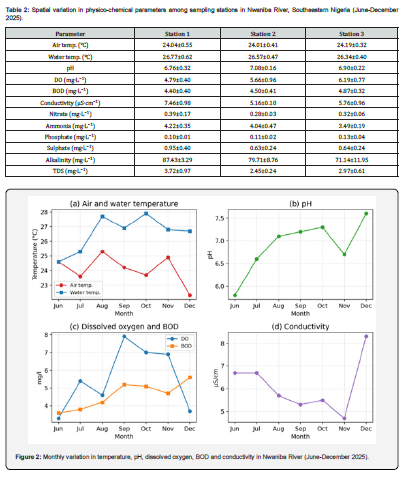
Monthly variation in the twelve physico-chemical parameters is presented in (Table 1) and (Figures 2 and 3). Air temperature was highest in August (25.30°C) and lowest in December (22.30°C). Water temperature peaked in October (27.90°C) and was lowest in June (24.60°C). pH rose steadily from 5.80 in June to 7.60 in December. Dissolved oxygen was highest in September (7.90mg∙L⁻¹) and lowest in June (3.30mg∙L⁻¹), while BOD rose from 3.60mg∙L⁻¹ in June to 5.60mg∙L⁻¹ in December. Nitrate rose progressively from 0.10mg∙L⁻¹ in June to 0.80mg∙L⁻¹ in December, the only parameter to show a statistically significant difference between months (P<0.05). Alkalinity recorded the highest absolute mean value (79.43±5.02mg∙L⁻¹).
Spatial Variation Among Sampling Stations
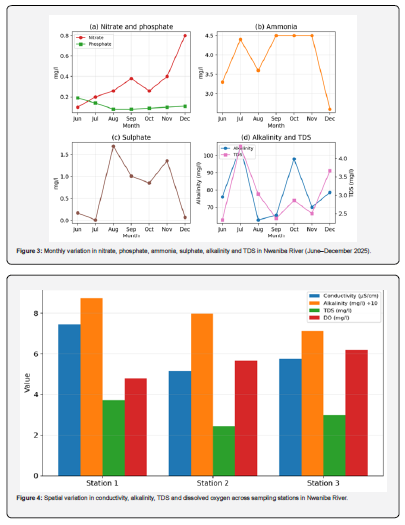
(Table 2) and (Figure 4) present the spatial variation among the three sampling stations. Dissolved oxygen increased progressively downstream (Station 1: 4.79±0.40mg∙L⁻¹; Station 3: 6.19±0.77mg∙L⁻¹), consistent with greater turbulence at the downstream station. Conductivity, alkalinity and TDS were highest at Station 1, consistent with domestic effluent and surface run-off entering at the upstream station. Nitrate was highest at Station 1 (0.39±0.17mg∙L⁻¹).
Seasonal Variation
One-way ANOVA comparing wet-season (June-August) and dry-season (September-December) means found no statistically significant seasonal difference (P>0.05) for eleven of the twelve parameters. Nitrate was the sole exception (P<0.05), with a higher dry-season mean (0.57mg∙L⁻¹) than wet-season mean (0.23mg∙L⁻¹), consistent with increased dry-season agricultural fertiliser run-off into the river.
Correlation Among Physico-Chemical Parameters
Pearson correlation identified several significant relationships. Water temperature was positively correlated with BOD(r = 0.448, P<0.05), pH(r = 0.678, P<0.01) and sulphate (r = 0.556, P<0.01), and negatively correlated with phosphate (r = −0.605, P<0.01). pH was positively correlated with BOD(r = 0.575, P<0.01) and nitrate (r = 0.590, P<0.01). The strongest correlation was between conductivity and TDS (r = 0.795, P<0.01).
Principal Component Analysis
PCA resolved three components that cumulatively explained 58.65% of total variance. Component 1 (24.57%) was most strongly associated with nitrate (0.83), pH(0.80) and BOD(0.83), and negatively with air temperature (−0.69). Component 2(17.87%) was associated with sulphate (0.73) and water temperature (0.73), and negatively with phosphate (−0.89). Component 3(16.21%) was most strongly associated with TDS (0.94).
The general absence of significant seasonal variation across most parameters contrasts with reports of more pronounced seasonality from several other tropical freshwater systems in Nigeria [11,13,14] and may reflect the buffering effect of the equatorial climate on water chemistry [18]. The significant dry-season elevation of nitrate is consistent with agricultural fertiliser application during dry-season farming [6,16,17,21,22]. BOD values below 5mg∙L⁻¹ are generally considered indicative of clean to fairly clean water [15]; the overall BOD mean recorded here (4.59±0.21mg∙L⁻¹) sits close to this threshold. Taken together, the data indicate that Nwaniba River, while subject to measurable anthropogenic influence particularly at the upstream station, remains within a generally acceptable water quality status for a community-utilised tropical river [24-27].
Conclusion
This study provides a documented physico-chemical characterisation of Nwaniba River, Akwa Ibom State, Nigeria, for June-December 2025. Eleven of twelve measured parameters showed no significant seasonal variation, while nitrate increased significantly in the dry season, most plausibly reflecting agricultural run-off associated with dry-season farming. Spatial patterns indicated elevated conductivity, alkalinity and TDS at the upstream station, consistent with localised domestic effluent input, while dissolved oxygen increased downstream with greater current velocity. Overall, water quality parameters remained within limits considered acceptable for unpolluted tropical freshwater. These findings establish a quantitative baseline against which future change can be assessed, and support continued monitoring and management measures to limit further nutrient input from surrounding agricultural land use.
Acknowledgements
The authors thank the Nwaniba River community, Uruan, for cooperation during sample collection. The authors declare no conflict of interest.
References
- Kumar A, Bisht BS, Joshi VD, Dhewa T (2011) Physical, chemical and bacteriological study of water quality of river Yamuna. International Journal of Chemistry and Biochemistry 3(1): 1-10.
- Raj NJ, Azeez PA (2009) Impact of land-use pattern on the water quality of Vellar River, Tamil Nadu, India. Bulletin of Environmental Contamination and Toxicology 82(2): 197-200.
- King RP (1998) Allometry, growth performance and mortality of Tilapia mariae (Boulenger, 1899) (Cichlidae) in Ikpa River, Nigeria. In RP King, BS Moses (Eds.), Fish and fisheries of southeastern Nigeria. University of Cross River State, Nigeria.
- Essien-Ibok MA, Akpan AW, Udo MT, Chude LA, Umoh IA, et al. (2010) Seasonality in the physical and chemical characteristics of Mbo River, Akwa Ibom State, Nigeria. Journal of Agriculture, Food and Environment 6(1&2): 59-71.
- Ekpo IE, Chude LA, Onuoha GC, Udoh JP (2012) Studies on the physico-chemical characteristics and nutrients of a tropical rainforest river in southeast Nigeria. AACL Bioflux 5(3): 142-162.
- Ekpo IE, Asuquo IE, Abiaobo NO (2016) Threatened and endangered fish species in Nigeria, a menace to biodiversity - A review. African Journal of Education, Science and Technology 3(1): 1-16.
- Chavan RP (2006) Assessment of water quality and pollution status of River Godavari [Report].
- Ekpo IE (2012) Diversity and condition factor of fish species of Ikpa River at Nwaniba, in Niger Delta, Nigeria. Journal of Research in Sciences 1(1): 36-47.
- Asuquo IE, Uko UF (2019) Evaluation of some physico-chemical parameters of Obio Akpa River in the culture of Clarias gariepinus. AKSU Journal of Agriculture and Food Sciences 2(1): 249-255.
- Bartram J, Balance R (1996) Water quality monitoring: A practical guide to the design and implementation of freshwater quality studies and monitoring programmes. E & FN Spon.
- Jacob US, Okobochi AC, Jonah UE, Ejemole KI, Oji AE, et al. (2023) Physicochemical parameters and ichthyofaunal composition of streams in Ikono and Ibiono Ibom Local Government Area, Akwa Ibom State, Nigeria. Journal of Applied Sciences and Environmental Management 27(10).
- Akpan NA, Udombe RB, Ukpong MB (2024) Investigation of the quality of physicochemical parameters in water samples from Qua Iboe River, Ikot Ekpene Stretch, Akwa Ibom State, Nigeria. Asian Journal of Geological Research 7(1): 31-40.
- Sikoki FD, Anyanwu IN (2013) Spatial and temporal variations of physicochemical variables in a small pristine stream in Niger Delta, Nigeria. Journal of Fisheries and Aquatic Science 8: 129-135.
- Uzukwu PU, Nzeako SO, Ekelemu JK (2014) Physico-chemical parameters of the upper reach of the New Calabar River at Aluu, Nigeria. Current Science 23: 45-56.
- Moore JW, Moore EA (2006) Water pollution: Causes and cures [Report].
- Aguigwo JN (1998) Studies on the physico-chemical parameters and plankton productivity of a productive stream. Journal of Aquatic Sciences 13: 9-13.
- Ezra AG, Nwankwo DI (2001) Composition of phytoplankton algae in Gubi reservoir, Bauchi, Nigeria. Journal of Aquatic Sciences 16(2): 115-118.
- Gobo AE (1988) Relationship between rainfall trends and flooding in the Niger Delta-Benue River Basin. Journal of Meteorology 13(132): 220-224.
- Egborge ABM (1991) The chemical hydrology of the River Osun, Western State, Nigeria. Freshwater Biology 4: 177-178.
- Adebisi AA (1991) The physico-chemical hydrology of a tropical seasonal river: Upper Ogun River. Hydrobiologia 79: 157-165.
- Asuquo GI, Ekwu AO, Asuquo IE (2024) Analysis of the physico-chemical characteristics of Mbiakong river in South east Nigeria. Pollution Research 43(3): 16-23.
- Akpan II, Essien-Ibok MA, Abiaobo NO, Udosen IE, Asuquo IE, et al. (2022) Biodiversity and abundance of fish species in Ekpene Ukpa River, a tributary of the Qua Iboe River estuary, Niger Delta, Nigeria. Journal of Aquatic Sciences 37(1): 41-49.
- American Public Health Association (2005) Standard methods for the examination of water and wastewater (21st ed.). APHA.
- Asuquo GI, Akpan II, George UU, Asuquo IE, Ukpatu JE, Ejiogu IN (2022) Phytoplankton composition and abundance in Mbiakong River, Cross River Estuary, Niger Delta, Nigeria. Asian Journal of Environment and Ecology 19(4): 135-141.
- Asuquo IE, Ofor CO (2025) Physicochemical parameters of test media exposed to Luffa cylindrica extracts and implications for Clarias gariepinus fertilization efficiency. Journal of Wetlands and Waste Management 7(1): 1-16.
- Ekwu AO, Asuquo IE (2013) The effects of climate change on aquatic resources: The Nigerian scenario. In L. Etim, J. P. Udoh, N. Etim, & A. Ekwu (Eds.), Contemporary issues in sustainable tropical agriculture (pp. 13-21). Faculty of Agriculture, University of Uyo.
- Oribhabor BJ, Asuquo IE (2015) Impacts of chemical pollution on the aquatic ecosystems. Proceedings of 2nd International Interdisciplinary Conference on Global Initiatives for Integrated Development (IIC-GIID 2015): 1302-1310.