


Systolic Blood Pressure Explanatory Factors for Prostate Cancer Patients
Mahashweta Das1, Rui Gong2, Shipra Banik3 and Rabindra Nath Das4*
1Department of History, The University of Burdwan, Burdwan, India
2Department of Informatics and Mathematics, Mercer University, USA
3Department of Physical Sciences, Independent University, Bangladesh
4epartment of Statistics, The University of Burdwan, India
Submission: October 25, 2022; Published: December 05, 2022
*Corresponding Address: Rabindra Nath Das, Department of Statistics, The University of Burdwan, Burdwan, West Bengal, India
How to cite this article: Mahashweta D, Rui G, Shipra B, Rabindra Nath D. Systolic Blood Pressure Explanatory Factors for Prostate Cancer Patients. Canc Therapy & Oncol Int J. 2022; 22(5): 556098. DOI:10.19080/CTOIJ.2022.22.556098
Abstract
The linkages between the prostate cancer (PC) biomarkers and hypertension risk factors such as systolic and diastolic blood pressure are controversial. The present article attempts to identify the systolic blood pressure (SBP) determinants of the PC patients. It is identified herein that mean SBP is higher at older ages (P<0.001) of PC patients than younger, and it is also over for cardiovascular disease (CVD) history (P=0.086) patients than normal. It is directly linked to diastolic blood pressure (DBP) (P<0.001) and primary tumor size (SZ) (P=0.005) of PC subjects. It is inversely linked to the serum prostatic acid phosphatase (PAP) (P=0.062). On the other hand, variance of SBP is more scattered for CVD history (P=0.018) patients than normal, and heart patients marked by electrocardiogram (EKG) (P=0.017) than normal and benign. Moreover, variance of SBP is inversely linked to DBP (P=0.009), serum haemoglobin (HG) (P=0.002), and PAP (P=0.005). The above SBP associations with other factors for PC subjects of the considered data set have been obtained by joint generalized linear models (JGLMs) method. Mean SBP is dependent on PC factors such as primary tumor size and PAP, while its variance is dependent on PAP only. For hypertension PC patients, care should be taken on CVD history of the patients, SBP, DBP and their primary tumor size only.
Keywords: Cardiovascular disease (CVD) history; Diastolic blood pressure (DBP); Primary tumor size (SZ); Prostatic acid phosphatase (PAP); Systolic blood pressure (SBP); Unequal variancehe CEBPA gene; AML-pCT: AML Post Cytotoxic Therapy; AML-MR: AML myelodysplasia-related; ALAL: Acute Leukemias of Ambiguous lineage
Introduction
For the senior men over the world, it is commonly observed that most of them are facing very complex conditions of prostate cancer (PC) and hypertension [1,2]. Note that for senior men, PC is the most common cancer. It is observed in practice that most of the PC patients are affected with cardiovascular disease (CVD) and hypertension [2-6]. Therefore, PC patients are affected with over hypertension risk factors such as systolic blood pressure (SBP) and diastolic blood pressure (DBP) [6-12]. The global age-standardized prevalence of over hypertension risk factors such as SBP ≥140 mmHg and DBP ≥90 mmHg in men was estimated as ≥20% in 2015 [12].
For several decades, it is considered that over SBP or DBP is a symptom for developing some diseases that shows a longer cumulative exposure in ageing-related diseases such as diabetes, CVD and PC [13]. It is known that hypertension is related to inflammation, which is a hallmark of cancer promotion [5,6,14]. The inflammatory cells in the prostate microenvironment connected with precursor lesions for PC in the prostate gland, termed as proliferative inflammatory atrophy, were observed [13,14]. It was reported that systemic prediagnostic inflammatory risk factors along with white blood cells and highly sensitive C-reactive protein were linked to PC promotion [6,7,13,14].
Most of the previous articles could not identify any suitable probabilistic model of SBP based on PC biomarkers and related risk factors, therefore the previous reported associations between PC and hypertension risk factors were controversial [ 1,2,8]. Moreover, most of the previous articles derived the association of SBP with PC risk factors using percentage, simple correlation, confidence intervals, regression analysis, meta-analysis, etc, which are not appropriate [1-3,8,9-12,15-18]. The associations of SBP with PC risk factors are still hazy in the PC literature. So, the current article aims to identify the determinants of SBP for PC patients adopting a suitable probabilistic model. The current report searches the following queries about PC research.
i. Is SBP associated with PC risk factors? What are the explanatory factors of SBP for PC patients? These are the primary hypertension queries in PC epidemiology.
ii. How can one derive the explanatory (or determinants) of SBP?
iii. What are the effects of SBP on PC patients?
The article investigates these above research hypotheses related to PC literature considering the following sections such as materials & methods, statistical analysis, results & discussions, and conclusions. The obtained SBP explanatory factors are displayed in Table 1, while the determinants are obtained by joint generalized linear models (JGLMs), and the impacts of SBP are shown in the discussion section.

Materials & Methods
Materials
The current research investigation is performed using a randomized clinical trial data set, which was obtained from 474 senior men with third or fourth PC stages. The donor of this data set was D.P. Byar, and the researcher published two analysis reports of the PC data set along with his co-researchers [19,20]. Moreover, the data set was reproduced in the book by Andrews and Herzberg [21]. For each investigated man, the following factors were studied: 1. Investigated unit’s stage (=I-stage=T1) (0= no cancer; 1= PC); 2. Estrogen (mg) (=RX=w2); 3. Follow up months (=D-time=w3); 4. Survival status (Alive=T4) (0=Alive; 1= Dead due to PC; 2= Dead due to vascular or heart; or pulmonary embolism; or cerebrovascular; or other cancer; or respiratory disease; or other specific non-cancer; or unknown cause; or unspecified non-cancer); 5. Age(=w5); 6. Weight (= Wt= w6); 7. Performance rating (=PFRT=T7) (0= normal activity; 1= confined to bed; 2= in bed < 50% daytime; or in bed > 50% daytime); 8. Cardiovascular disease (CVD=T8) history (0=no, 1=yes); 9. Systolic blood pressure (=SBP=w9); 10. Diastolic blood pressure (=DBP=w10); 11. Electrocardiogram (= EKG=T11) code (0=normal; 1=benign; 2= rhythmic disturb & electrolyte; or heart block; or heart strain; or conduction; or recent myocardial infarction (MI); or old MI); 12. Serum haemoglobin (=HG=w12); 13. Primary tumour size (SZ=w13); 14. Tumour index stage and histolic grade (= SG= w14); 15. Serum prostatic acid phosphatase (=PAP=w15); 16. Bone metastases (=BM=T16) (0=no, 1=yes); 17. Study date (S-date=w17). The PC data set contains ten continuous and seven attribute characters. In the present research investigation, SBP is considered as the response (or dependent) continuous variable, and the remaining others are used as the independent (or explanatory) factors/ variables.
Statistical Methods
The considered dependent continuous variable SBP is located as heteroscedastic. So, the non-constant variance response SBP can be modeled adopting stabilizing variance under a suitable transformation, but it is not always stabilized [22]. Therefore, the dependent variable SBP can be suitably modeled by joint generalized linear models (JGLMs) under gamma, or log-normal distribution [23,24]. JGLMs is illustrated in the books by Lee et al. [23], and Das [25]. These two models are described very shortly as follows.
Log-normal JGLMs
For the positive response  (mean) and
  say, where
  are dispersion parameters and
  shows the variance function, commonly, the log transformation Zi = log(Yi=SBP) is used to stabilize the variance
  while it may not be stabilized always [22]. For obtaining an advanced model, JGLMs for the mean and dispersion are derived. Herein for the response SBP, considering log-normal distribution, JGL mean, and dispersion models (with
  are as follows:
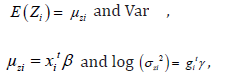
where  are the explanatory factors/variables vectors attached with the regression coefficients β and γ , respectively.
Gamma JGLMs
For the above stated  , the variance consists of two parts such as
  (depending on the mean parameters) and
  (independent of
  ). The variance function
  indicates the GLM family distributions. For illustration, if V(μ) = μ , it is Poisson, gamma if V(μ) = μ2 , and normal if V(μ) =1etc. Gamma JGL mean and dispersion models for SBP are as follows:
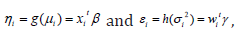
where g(⋅) and h(⋅) are the GLM link functions for the mean and dispersion linear predictors respectively, and  are the
vectors of explanatory factors/variables connected to the mean
and dispersion parameters, respectively. Maximum likelihood
(ML) method is applied for computing mean parameters, and the
restricted ML (REML) method is adopted for obtaining dispersion
parameters, which are illustrated in the book by Lee et al. [23].
are the
vectors of explanatory factors/variables connected to the mean
and dispersion parameters, respectively. Maximum likelihood
(ML) method is applied for computing mean parameters, and the
restricted ML (REML) method is adopted for obtaining dispersion
parameters, which are illustrated in the book by Lee et al. [23].
Statistical & Graphical Analysis
The response SBP is modeled on the all remaining explanatory factors/variables using JGLMs under both the distributions such as gamma and log-normal. The best SBP fitted model is accepted based on the lowest Akaike information criterion (AIC) value that reduces both the predicted additive errors and the squared error loss [26; p.203-204]. Following the AIC criterion, JGL log-normal model fit (AIC= 1862) of SBP is better than gamma fit (AIC= 1864.81). Both the best SBP fitted JGLMs analysis outcomes are presented in Table 1. All the included variables/ factors in both the mean and dispersion models are almost significant.

The data developed SBP models are examined by graphical diagnostic tools. The best selected SBP fitted log-normal JGLMs (Table 1) are verified in Figure 1. Figure 1(a) shows the absolute SBP log-normal JGL fitted residuals plot against its predicted values, which is almost a flat straight line, except the two tails, implying that variance is constant with the running means. The left tail is increasing as a larger absolute residual is located at the left boundary, while the right tail is decreasing as a smaller absolute residual is located at the right boundary. Figure 1(b) presents the SBP log-normal fitted mean model (Table 1) normal probability plot, which shows no fit discrepancy. Therefore, these two figures indicate that the SBP log-normal fitted JGLMs are similar to the unknown true SBP models.
Results & Discussion
Results
The summarized SBP fitted consequences from JGLMs analysis are placed in Table 1. It is noted that the log-normal fitted SBP models are better (based on AIC), so its mean and dispersion fitted outcomes are discussed herein. From the log-normal fitted SBP mean model, it is shown that mean SBP is directly associated with age (P<0.001), CVD history (P=0.086), DBP (P<0.001), and primary tumor size (SZ) (P=0.005), while it is inversely associated with PAP (P=0.062). On the other hand, variance of SBP is directly associated with CVD history (P=0.018) and heart patients marked by electrocardiogram (EKG) code at third level (P=0.017), while it is inversely associated with DBP (P=0.009), HG (P=0.002) and PAP (P=0.005).
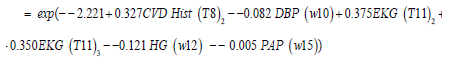
JGL log-normal fitted SBP mean model (Table 1) is
Estimated

Primary Tumor size (SZ) (w13) – 0.001 PAP (w15),and the JGL log-normal fitted SBP dispersion σˆ2 model (from Table 1) is
Discussion
The best log-normal fitted SBP analysis consequences are displayed above along with its mean and dispersion models. From the log-normal SBP fitted mean model, it is obtained that mean SBP is directly associated with age (P<0.001), concluding that mean SBP increases as PC patients become older, which is observed in practice. Mean SBP is directly associated with CVD history (0=no, 1=yes) (P=0.086), implying that mean SBP is higher for CVD patients with PC than non-CVD with PC. It is directly associated with DBP (P<0.001), interpreting that it increases as DBP goes up. It supports the natural relationship between SBP and DBP, which is always observed for any hypertension subject. Also, mean SBP is directly associated with the primary tumor size (P=0.005), indicating that SBP increases as the primary tumor size increases. This is not reported in any previous article. It shows that SBP is associated with inflammation growth (that is formation of primary tumors) [5,6,14]. Again, mean SBP is inversely associated with the serum PAP (P=0.062), implying that mean SBP decreases as serum PAP increases. It shows that PC patients with higher PAP levels have lower SBP levels, implying that PAP is a protective factor for SBP. This relationship between SBP and PAP is not reported in any previous article. But it has been identified herein that SBP is directly associated with primary tumor size, so the PC patients with larger primary tumors may have higher SBP levels. On the other hand, PC patients with larger primary tumors may have higher levels of serum PAP, so they may have lower SBP levels. Consequently, PC patients with larger primary tumors may not have higher SBP levels. So, PC patients without CVD history may have normal SBP levels.
From the log-normal fitted SBP variance model, it is observed that variance of SBP is directly associated with CVD history (P=0.018) (0=no, 1=yes), implying that SBP level is more scattered for CVD patients than normal. From the SBP mean model, it is identified that SBP is higher for CVD history patients, so the SBP levels for CVD patients may be quite different than normal. So, the SBP variance is more for CVD history patients. Therefore, the variance model supports the mean model’s findings. Also, variance of SBP is directly associated with the heart patients marked by electrocardiogram (EKG) code at third level (P=0.017) (0=normal; 1=benign; 2= rhythmic disturb & electrolyte; or heart block; or heart strain; or conduction; or recent myocardial infarction (MI); or old MI), implying that SBP level is more scattered for heart patients at third level than normal and benign. Actually, EKG third level contains subjects with many factors, so SBP levels for those subjects are different. SBP variance is inversely associated with DBP (P=0.009), or HG (P=0.002), or PAP (P=0.005) implying that SBP levels are more scattered for the PC subjects with lower levels of DBP, or HG, or PAP. Note that any of the above results related to the SBP dispersion model for PC subjects are not focused in any previous article.
The relationship of SBP with PC biomarkers and other factors along with its effects are discussed in the above. It supports some well-known relationships such as SBP & DBP relationship, SBP & age relationship, SBP & inflammation growth relationship [5,6,8,14]. All other current findings regarding SBP associations are little known in the previous PC literature [1, 2,9-14,17].
Particularly, the findings in the SBP dispersion model are very rarely pointed out in any earlier articles. Most of the previous reports adopted percentage counts, simple correlation and regression, meta-analysis, which are not suitable to identify the associations of SBP with the other factors [1,2,8-14,16-18]. So, the present outcomes are not mentioned in any previous research articles. Researchers, readers and reviewers can verify the above reported results by reanalysis of the data set that is noted in the material section. All outcomes presented herein related to SBP explanatory factors for the considered PC data set are completely new in the PC literature.
Conclusion
The relationships of SBP with PC biomarkers, clinical history, physical characters and other factors are derived herein using JGLMs. The best fitted probabilistic model is obtained by comparing two possible models, lowest AIC, graphical diagnostics, and small standard error of the estimates. Two possible models are reported herein, while both the models reflect similar interpretations, concluding that present outcomes are the most reliable. The article presents some interesting findings related to the PC literature that are helpful to the medical practitioners, researchers and common men. Mean SBP is dependent on PC factors such as primary tumor size and PAP, while its variance is dependent on PAP only. For hypertension PC patients, care should be taken on CVD history of the patients, SBP, DBP and their primary tumor size only.
Conflict of Interest
The authors confirm that this article content has no conflict of interest.
Acknowledgement
The authors are very grateful to the principal data investigators D.P. Byar (National Cancer Institute), who provided the data freely for scientific study.
References
- Stanaway JD, Afshin A, Gakidou E (2018) Global, regional, and national comparative risk assessment of 84 behavioural, environmental and occupational, and metabolic risks or clusters of risks for 195 countries and territories, 1990–2017: a systematic analysis for the Global Burden of Disease Study 2017. Lancet 392(10159): 1923-1994.
- Leong DP, Fradet V, Shayegan B, Duceppe E, Siemens R, et al. (2020) Cardiovascular Risk in Men with Prostate Cancer: Insights from the RADICAL PC Study. J Urol 203(6): 1109-1116.
- Hsing AW, Chokkalingam AP (2006) Prostate cancer epidemiology. Frontiers in Bioscience 11: 1388-1413.
- Batta A, Panag KMDS, Singh J (2012) Diagnosis of prostate cancer -Role of biomarkers. Int J Cur Biomed Phar Res 2: 339-345.
- Jonusasa J, Drevinskaitea M, Patasiusa A, Kinciusd M, Janulionisb E, et al. (2022) Androgen-deprivation therapy and risk of death from cardio-vascular disease in prostate cancer patients: a nationwide lithuanian population-based cohort study. The Aging Male 25(1): 1-9.
- Stikbakke E, Schirmer H, Knutsen T, Martin Stoyten, Tom Wilsgaard, et al. (2022) Systolic and diastolic blood pressure, prostate cancer risk, treatment, and survival. The PROCA-life study. Cancer Med 11(4): 1005–1015.
- Christakoudi S, Kakourou A, Markozannes G, Ioanna Tzoulaki, Elisabete Weiderpass, et al. (2020) Blood pressure and risk of cancer in the European Prospective Investigation into Cancer and Nutrition. Int J Cancer 146(10): 2680-2693.
- Liang Z, Xie BO, Li J, Xiao Wang, Song Wang, et al. (2016) Hypertension and risk of prostate cancer: a systematic review and meta-analysis. Sci Rep 6: 31358.
- Seretis A, Cividini S, Markozannes G, Xanthippi Tseretopoulou, David S Lopez, et al. (2019) Association between blood pressure and risk of cancer development: a systematic review and meta-analysis of observational studies. Sci Rep 9(1): 8565.
- Wilk M, Wasko-Grabowska A, Szmit S (2020) Cardiovascular Complications of Prostate Cancer Treatment. Front. Pharmacol 11: 555475.
- Davis MK, Rajala JL, Tyldesley S, Pickles T, Virani SA (2015) The Prevalence of Cardiac Risk Factors in Men with Localized Prostate Cancer Undergoing Androgen Deprivation Therapy in British Columbia, Canada. J Oncol 2015: 820403.
- Zhou B, Bentham J, Di Cesare M (2017) Worldwide trends in blood pressure from 1975 to 2015: a pooled analysis of 1479 population-based measurement studies with 19·1 million participants. Lancet (London, England) 389(10064): 37-55.
- Sfanos KS, Yegnasubramanian S, Nelson WG, De Marzo AM (2018) The inflammatory microenvironment and microbiome in prostate cancer development. Nat Rev Urol 15(1): 11-24.
- Arthur R, Williams R, Garmo H, L Holmberg, P Stattin et al. (2018) Serum inflammatory markers in relation to prostate cancer severity and death in the Swedish AMORIS study. Int J Cancer 142(11): 2254-2262.
- YuPeng Liu, FuLan Hu, DanDan Li, Fan Wang, Lin Zhu, et al. (2011) Does physical activity reduce the risk of prostate cancer? A systematic review and meta-analysis. Eur Urol 60(5): 1029–1044.
- Pei-Ying Pai, Vivian Chia-Rong Hsieh, Chang-Bi Wang, Hsi-Chin Wu, Wen-Miin Liang, et al. (2015) Long term antihypertensive drug use and prostate cancer risk: A 9-year population-based cohort analysis. Int J Cardiol 193: 1-7.
- Beebe Dimmer JL, Dunn RL, Sarma AV, Montie JE, Cooney KA (2007) Features of the metabolic syndrome and prostate cancer in African American men. Cancer 109(5): 875–881.
- Martin RM, Vatten L, Gunnell D, Romundstad P (2010) Blood pressure and risk of prostate cancer: Cohort Norway (CONOR). Cancer Causes Control 21(3): 463–472.
- Byar DP, Corle DK (1977) Selecting optimal treatment in clinical trials using covariate information. Chronic Diseases 30(7): 445-469.
- Byar DP, Green SB (1980) The choice of treatment for cancer patients based on covariate information: application to prostate cancer. Bull. Cancer, Paris 67(4): 477-488.
- Andrews DF, Herzberg AM (1985) Data, A Collection of Problems from Many Fields for the Student and Research Worker. Springer-Verlag, New York, USA.
- Myers RH, Montgomery DC, Vining GG (2002) Generalized Linear Models with Applications in Engineering and the Sciences. John Wiley & Sons, New York, USA.
- Lee, Y, Nelder JA, Pawitan Y (2017) Generalized Linear Models with Random Effects (Unified Analysis via H–likelihood) (2nd edn). Chapman & Hall, London, UK.
- Das RN, Lee Y (2009) Log-normal versus gamma models for analyzing data from quality-improvement experiments. Quality Engineering 21(1): 79-87.
- Das RN (2014) Robust response surfaces, regression and positive data analyses. Chapman & Hall, London, UK.
- Hastie T, Tibshirani R, Friedman J (2009) The Elements of Statistical Learning, Springer-Verlag, Germany.


