FDG-PET Metabolic Vs CT Anatomical Monitoring of Tumor Response to Anterior Chemotherapy in Breast Carcinoma-The Uncertainties
Krithikaa Sekar, Bindiya Vijayan, Ancy Mathew, C K Fareena Taj, Radheyshyam Naik, Kruthika Murugan, B S Ajai Kumar, B J Srinivas, Ramesh S Bilimagga, Shekar Patil, Sateesh Chirondoni Thungappa, Veena Ramaswamy, Shivakumar swamy, Sudhakar Sampangi, Kumar Kallur, Somrat Bhattacharjee, M S Belliappa, Mahesh Bandemagal, K Govind Babu, Amritanshu Ram and G Lohith*
Department of Radiation Oncology, HCG Hospitals, India
Submission: June 04, 2021; Published: June 21, 2021
*Corresponding Address:Dr G Lohith, Consultant Radiation Oncologist, HCG Hospitals-Bangalore, India
How to cite this article:Krithikaa S, Bindiya V, Ancy M, C K Fareena T, Radheyshyam N, et al. FDG-PET Metabolic Vs CT Anatomical Monitoring of Tumor Response to Anterior Chemotherapy in Breast Carcinoma-The Uncertainties. Canc Therapy & Oncol Int J. 2021; 19(1): 556003. DOI: 10.19080/CTOIJ.2021.19.556003
Abstract
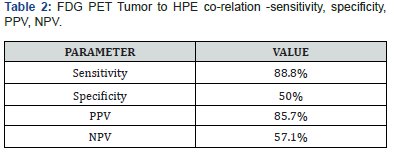
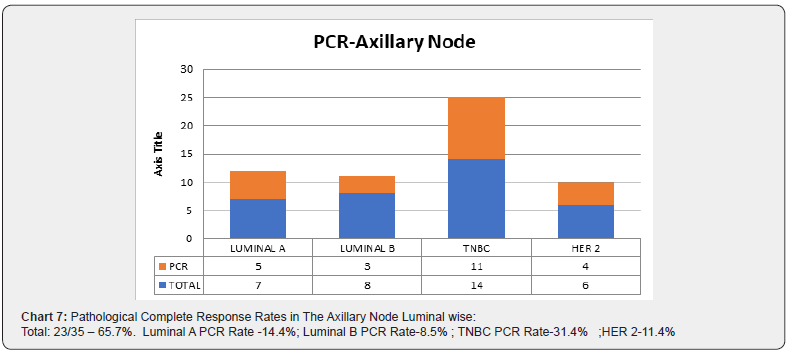
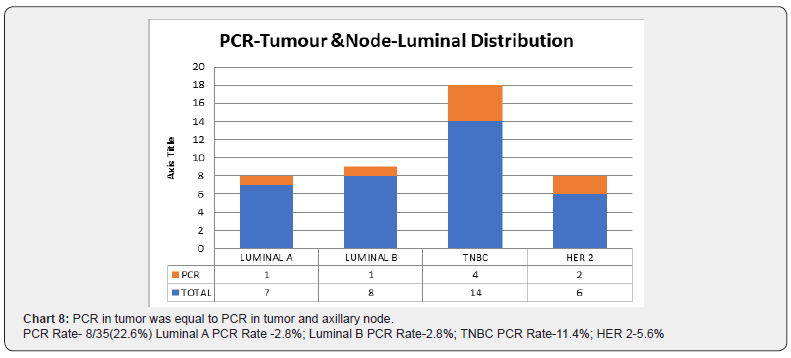
Purpose: To compare the metabolic tumor response and volumetric tumor response to pathological tumor response to NACT and to predict the sensitivity, specificity, positive predictive value and negative predictive value of FDG PET to neoadjuvant chemotherapy. Material and method: The study was performed after institutional ethical committee clearance.35 consecutive eligible patients treated between January 2015 to May 2016 were included in the study. PETCT was acquired at baseline and post neoadjuvant chemotherapy, prior to surgery. The SUV max of tumor and involved nodes at baseline and post neoadjuvant chemotherapy was compared to pathological tumor size and nodal status. Response was assessed using PRECIST and RECIST criteria. Statistical methods used for analysis were software SPSS version 13, calculations for Sensitivity, specificity, positive predictive value and negative predictive value. Results: The median age was 51.3 years (range 33 to 68 years). The patients were generally healthy with ECOG PS 0-1. FDG PET tumor to HPE correlation -sensitivity, specificity, PPV, NPV SENSITIVITY 88.8% SPECIFICITY 50% PPV 85.7% NPV 57.1% our results show the high sensitivity and low specificity of PETCT in detecting residual tumor. Overall PCR was in 22.6% (8/35). Pathological Complete Response Rates In The Axillary Node Luminal wise:Total:23/35 – 65.7%. Luminal A PCR Rate -14.4%; Luminal B PCR Rate-8.5%; TNBC PCR Rate-31.4%; HER 2-11.4%. Conclusion: Although PETCT aids in differentiating necrotic area from viable tumor area and a decrease in SUV uptake post NACT is an indication of treatment response, there appears to be uncertainties in the sensitivity and specificity of PETCT detection of pathological tumor and nodal status. Further analysis onto to same is recommended to infer strategies to improve prediction of pathological outcome.
Introduction
The spectrum of utility of FDG-PETCT in Breast cancer extends from, staging, early assessment of response to treatment, monitoring metastatic tumors for evaluating disease status at follow up [1]. Neoadjuvant chemotherapy in breast carcinoma aids in downsizing tumor, improves chances of breast conservation surgery and eliminates micro-metastasis [2]. Monitoring metabolic response post neoadjuvant chemotherapy has been a useful tool to plan surgery, predict response to therapy and outcomes [3]. Literature suggests PETCT to be more accurate for NACT response monitoring because of its superiority to current imaging studies for distinguishing tumor tissue from necrotic or fibrotic tissue [4]. Several studies have reported the usefulness of volumetric monitoring of treatment response in Breast carcinoma using MRI [5]. Our study compares the FDG PET and CT response predictivity to pathological tumor response.
Aim
To analyze the predictivity of FDG PET and CT in assessing pathological tumor response post neoadjuvant chemotherapy.
Objective
To compare the metabolic tumor response and volumetric tumor response to pathological tumor response to NACT and to predict the sensitivity, specificity, positive predictive value and negative predictive value of FDG PET to neoadjuvant chemotherapy.
Material and Method
The study was performed after institutional ethical committee clearance.35 consecutive eligible patients treated between January 2015 to May 2016 were included in the study. PETCT was acquired at baseline and post neoadjuvant chemotherapy, prior to surgery. The SUV max of tumor and involved nodes at baseline and post neoadjuvant chemotherapy was compared to pathological tumor size and nodal status. Response was assessed using PRECIST and RECIST criteria. Statistical methods used for analysis were software SPSS version 13, calculations for Sensitivity, specificity, positive predictive value, and negative predictive value.
Inclusion Criteria
⇒ Histologically proven carcinoma Breast
⇒ Baseline PETCT for assessment
⇒ Neoadjuvant chemotherapy
⇒ PETCT post neoadjuvant chemotherapy
⇒ Complete postoperative histopathological availability
Exclusion Criteria
⇒ Patients with progressive disease not amenable to surgery.
⇒ Patients with distant metastatic disease.
⇒ Patients without baseline or post NACT PETCT.
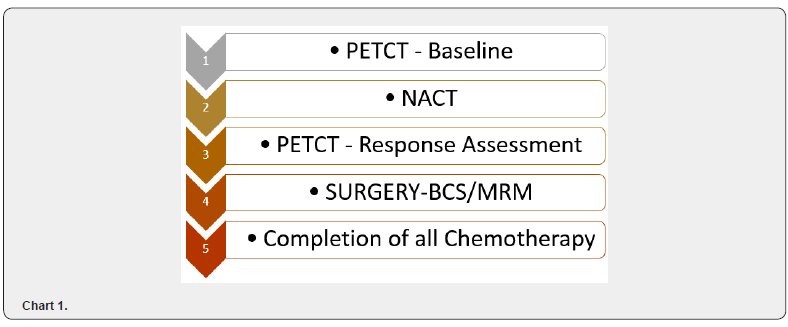
Flowchart of Schema
Chart 1
PETCT Acquisition
As per protocol, with patient fasting overnight, 3 microcurie 18 Fluor Deoxy Glucose was injected and positron emission tomography images was acquired. SUV max was calculated based on the formula tracer uptake in ROI / (injected activity / patient weight).
Chemotherapy
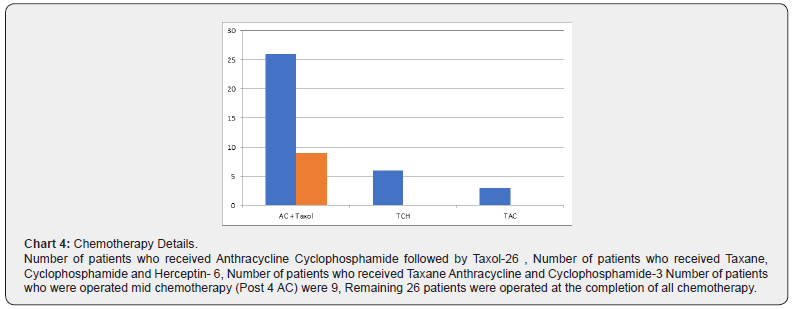
Her-2 negative patients received 4 cycles of 3 weekly Anthracycline and Cyclophosphamide followed by 12 cycles of weekly Paclitaxel or 6 cycles of TCH chemotherapy if Her-2 positive.
Histopathology
The size of grey, white area in specimen, size of residual tumor, treatment related changes, number of nodes removed, status of axillary node were recorded from the histopathology report.
Response evaluation criteria
Comparison Of Baseline PETCT to Post NACT PETCT i. SUV Max in tumor ii. SUV Max in axillary node iii. Tumour dimensions in upfront and post NACT CT.
Comparison of PETCT to HPE
i. 1.Size of grey, white area ii. 2.Size of residual tumor iii. 3.Axillary nodal status
Statistical Calculations
a. Sensitivity- True Positive (TP)/True Positive False Negative (FN) (Proportion of patients with positive pathological node having PET positivity) b. Specificity-True Negative (TN)/False Positive (FP)+True Negative (Proportion of patients with Negative pathological node having PET Negativity) c. Positive Predictive Value-True Positive/True Positive False Positive (Patients with positive PETCT having pathological node positivity) d. Negative Predictive Value-True Negative/False Negative True Negative
(Patients with negative PETCT having pathological node negativity)
Results
⇒ The median age was 51.3 years (range 33 to 68 years).
⇒The patients were generally healthy with ECOG PS 0-1.
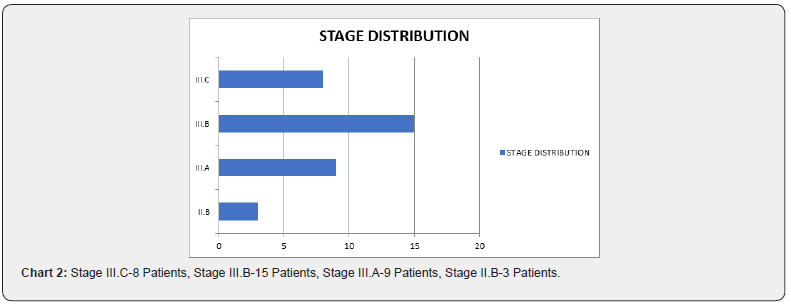
⇒ The staging information (Chart 2)
⇒ Luminal distribution (Chart 3)
⇒ Details of chemotherapy (Chart 4)
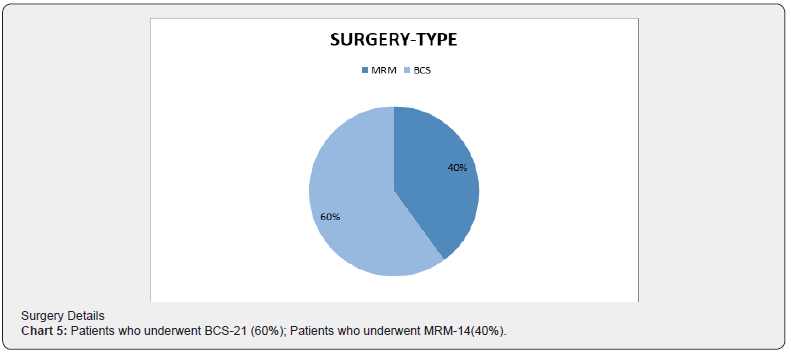
⇒ Surgery Details (Chart 5)

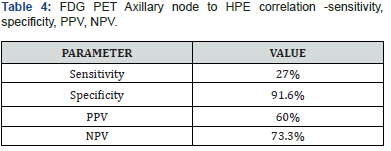
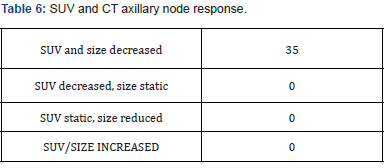
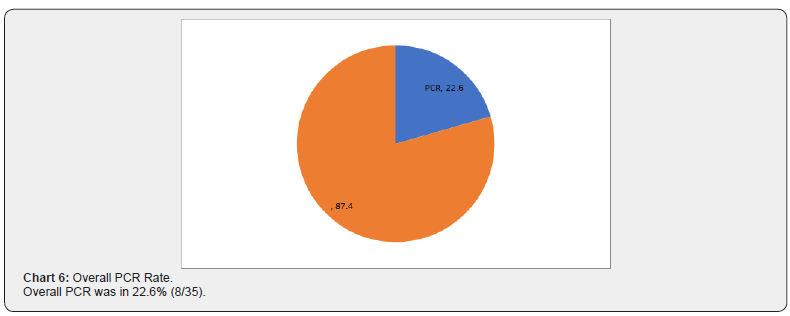
Correlation between presence of FDG PET residue in primary tumor and histopathological residual primary tumor (Table 1). Our results show the high sensitivity and low specificity of PETCT in detecting residual tumor (Table 2). Correlation between FDG PET Axillary nodal status and histopathological axillary nodal status (Table 3). On the contrary, the sensitivity of PETCT in detecting axillary node is low, however with a very high specificity. ie) Patients with a negative axillary node in HPE have a 91.6% chance of PET showing No SUV uptake post chemotherapy from the baseline significant uptake (Tables 4 -7).



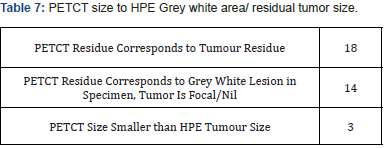
From our observation, in 14/35 cases (40%), had microscopic residual tumor, however PETCT had shown size range of 2.5 to 3.8cm with a Max SUV between 3 to 5.6. On evaluating HPE report, the size of grey, white area of the specimen correlated with the PETCT tumor size. In 3/35 cases (8.5%), the residue in histopathology was larger than the PET reported measurements. Probable explanation could be microscopically infiltrative margins, not otherwise picked up in imaging (Charts 6-8).
Discussion
FDG PET in Breast Cancer
Screening: PETCT is not recommended imaging of choice for screening undetected breast cancer as the sensitivity of the same in detecting lesions less than 1cm is low. Meta-analysis evaluating 13 studies on PETCT in breast cancer detection showed that most of the studies were unevenly weighted toward large palpable primary lesions and typically omitted nonpalpable imagingdetected cancers and hence did not recommend the same [6].
Staging: Early stage: Routine metastatic workup in earlystage breast carcinoma is not recommended and hence is PETCT in this setting [7].
Staging: Locally advanced: In locally advanced carcinoma, PETCT is used in screening for metastatic disease and quantifying extent of locoregional disease [8].
Individual site sensitivity
Axilla: In low risk of involvement for axillary nodes the sensitivity was 61%, 80% specific, a positive predictive value of 62% and a negative predictive value of 79%. However, the sensitivity increased in patients with high risk for axillary nodal involvement [9].
IMR: Studies have shown that FDG PET is superior to CT in detecting nodal disease of the Internal mammary region, involvement of which is expected in about 25-30% of patients with locally advanced carcinoma [10].
LIVER: FDG PET/CT has been shown to be very accurate and sensitive in the detection of liver metastases derived from a wide range of primary cancers. D’Souza et al. [11] showed the superiority of PET/CT over contrast-enhanced CT in the detection of untreated hepatic metastases in a prospective study evaluating 45 patients with suspected liver metastases from various primary cancers. The authors found that the sensitivity and specificity in the detection of hepatic metastases was 87.9% and 16.7%, respectively, for contrast-enhanced CT and 97% and 75%, respectively, for PET/CT.
LUNG: The sensitivity and specificity of FDG-PET/CT for pulmonary metastasis were 57.1% and 99.1%, respectively, and the positive and negative predictive values were 90.1% and 93.6%, respectively, based on literature review. The uptake of FDG was affected by the size of the metastatic nodules; uptake was positive and negative in pulmonary metastases with an average size of 14.9mm and 5.75mm, respectively. The limit of positive FDG uptake was reached in pulmonary metastases of about 9mm [12].
BONE: Several studies have shown the superiority of FDG PET to bone scintigraphy in detecting lytic and intramedullary metastases of bone. Also, in equivocal bone lesions detected by other imaging modalities, PETCT offers additional clarification [13].
BRAIN: Based on studies, the sensitivity and specificity of detecting brain metastasis with FDG alone was 45% and 80%. Combined with CT it improved to 50% and 93%. However, in addition to better sensitivity and specificity, its ability in detecting small size lesions and leptomeningeal disease makes MRI the investigation of choice in detecting brain metastasis [14].
Metastatic tumors: In patients with metastatic breast cancer, tumor response on PET/CT appears to be a superior predictor of PFS and DSS than response on CE-CT. Study findings published in the European Journal of Nuclear Medicine and Molecular Imaging revealed that the differences in response assessment with PETCT versus other modalities could have caused changes in patient management in 25% of the cohort of 65 women with stage IV breast cancer. The current standard for monitoring tumor response and breast cancer progression has been based on changes in tumor size. This is very effectively measured on contrast-enhanced CT (CE-CT) imaging. However, the ability of FDG PET/CT to measure glucose metabolism, assess metabolic activity in osseous metastases, and differentiate an active tumor from post-therapeutic change, shown by changes in FDG uptake, have demonstrated a high accuracy for predicting histopathologic response of breast cancer [15].
Monitoring at follow-up: Detecting early recurrence has an important survival benefit because it prompts clinical consideration for administering different therapies. However, it is difficult to differentiate true recurrence from posttreatment sequelae using the conventional imaging modalities [16]. Grahek et al. [17] studied 134 patients with suspected recurrence, and they found that the sensitivity and specificity of PET for detecting recurrence were 84% and 78%, respectively, whereas the sensitivities and specificities of the conventional imaging modalities were 63% and 61%, respectively
Neoadjuvant Chemotheray Response Assessment: PETCT
The effect of PET for evaluating the response to treatment has already been demonstrated for different types of neoplasm, including breast cancer [18]. In a study by Smith et al, the mean reduction in FDG uptake after the first cycle of chemotherapy was significantly higher in the lesions that showed a partial, complete macroscopic, or complete microscopic response than that of the non-responsive lesions, as determined by histopathological examinations [19]. Rose et al. have also reported that after a single cycle of chemotherapy, PETCT predicted the pathological complete response with a 90% sensitivity and a specificity of 74%, and by using a decrease in FDG uptake at the threshold of < 55% to the baseline PETCT, all the responders were correctly identified after the first treatment course with a 100% sensitivity and 85% specificity [20]. Studies have shown that after NACT, 39 (28%) patients showed negative conversion of Axillary lymph node on surgical specimens. The sensitivity of ultrasound, MRI and PET/CT was 50%, 72% and 22%, respectively. The specificity of ultrasound, MRI and PET/CT was 77%, 54% and 85%, respectively. Combination of three imaging modalities showed the highest sensitivity, and PET/CT showed the highest specificity. Ultrasound alone or combination of ultrasound and PET/CT showed the highest positive-predictive value [21].
Discussion of Results
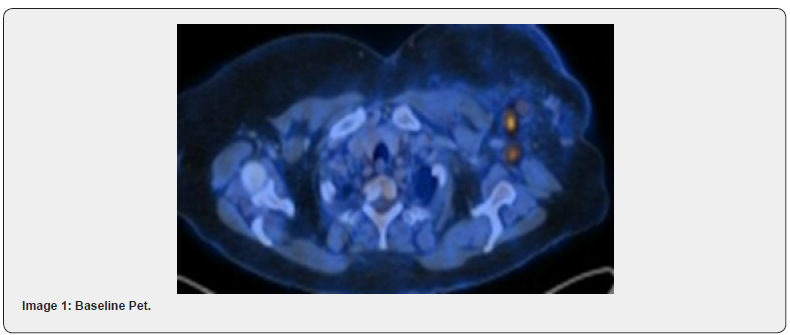
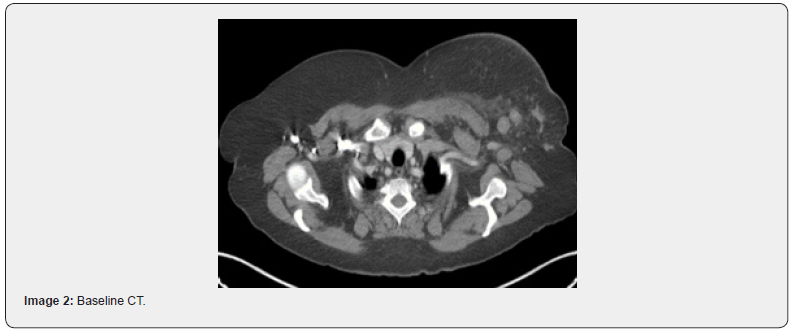
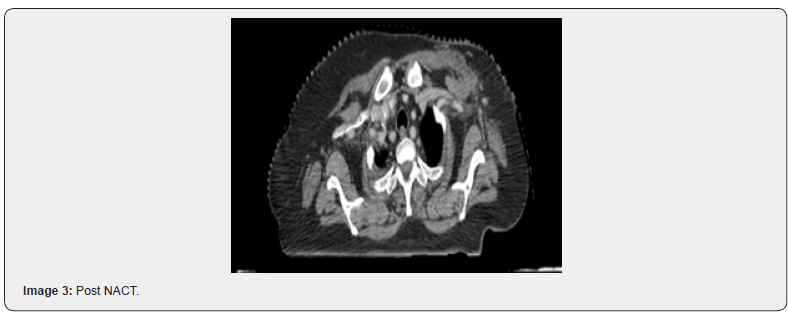
The rate of PCR in our study was 22.8%. Various studies have reported PCR rates between 20 to 34% [21,22]. Of note, the PCR rates differed between the luminal groups and the proportion of patients in different subclassifications were altered in these studies. Highest PCR among the luminal: Study by Kim et al showed that the highest PCR rates were with TNBC [23]. Another study by Haque et al showed that highest PCR rates were in her2 positive [24]. From our observation, in the era of Trastuzumab based chemotherapy, the PCR rates are increasing in her2 as previously noted in TNBC as in our study [25]. Sensitivity of PETCT in NACT setting in Breast Cancer for assessing tumor response, as reported in the studies mentioned above ranges between 60- 90% and specificity up to 90%. Our study reports a sensitivity of 88.8% in primary tumor correlation with HPE residue and a 91% specificity in detecting pathological axillary nodal status. However, of mention, the specificity i.e., the ability of PETCT to detect a complete pathological response in tumor appears to be low (50%) with 8/35(22.8%), showing a PCR in primary tumor with a contradicting PETCT significant SUV uptake and a CT residual lesion whose size corresponds to the grey, white lesion in Specimen. Also, in 3/35 cases (8.5%), PETCT reported decrease in size and SUV of lesion and was contradicted with a significant difference in size of pathological residue (later being1.7 times larger than PET reported residue). Similarly, the sensitivity of PETCT in detecting a pathological positive axillary node was 33% only, i.e.) with a residual pathological axillary node and a contradicting PETCT showing NIL SUV uptake. PET&CT Showing complete regression of axillary node with decrease in SUV from upfront 8.7 to NIL However pathological axillary node status was positive (Images 1-4).

Conclusion
Although PETCT aids in differentiating necrotic area from viable tumor area and a decrease in SUV uptake post NACT is an indication of treatment response, there appears to be uncertainties in the sensitivity and specificity of PETCT detection of pathological tumor and nodal status. Further analysis onto to same is recommended to infer strategies to improve prediction of pathological outcome.
References
- Bos R, van Der Hoeven JJ, van Der Wall E, Petra van Der Groep, Paul J van Diest, et al. (2002) Biologic correlates of (18) fluorodeoxyglucose uptake in human breast cancer measured by positron emission tomography. J Clin Oncol 20(2): 379-387.
- Early Breast Cancer Trialists’ Collaborative Group (EBCTCG) (2018) Long-term outcomes for neoadjuvant versus adjuvant chemotherapy in early breast cancer: meta-analysis of individual patient data from ten randomised trials. Lancet Oncol 19(1): 27–39.
- Jin S, Kim SB, Ahn JH, Kyung Hae Jung, Sei Hyun Ahn, et al. (2013) 18 F-fluorodeoxyglucose uptake predicts pathological complete response after neoadjuvant chemotherapy for breast cancer: a retrospective cohort study. J Surg Oncol 107(2): 180-187.
- Garcia Vicente AM, Cruz Mora MA, Leon Martin AA, María Del Mar Munoz Sanchez, Fernanda Relea Calatayud, et al. (2014) Glycolytic activity with 18F-FDG PET/CT predicts final neo-adjuvant chemotherapy response in breast cancer. Tumour Biol 35(11): 11613-11620.
- Miyake KK, Nakamoto Y, Kanao S, Shiro Tanaka, Tomoharu Sugie, et al. (2014) Journal Club: diagnostic value of (18)F-FDG PET/CT and MRI in predicting the clinicopathologic subtypes of invasive breast cancer. Am J Roent-genol 203(2): 272-279.
- Samson DJ, Flamm CR, Pisano ED, Aronson N (2002) Should FDG PET be used to decide whether a patient with an abnormal mammogram or breast finding at physical examination should undergobiopsy? Acad Radiol 9(7): 773–783.
- Groheux D, Hindie E, Rubello D, Marc Espie, Georges Baillet, et al. (2009) Should FDG PET/CT be used for the initial staging of breast cancer? Eur J Nucl Med Mol Imaging 36: 1539–1542.
- Avril N, Dose J, Janicke F, S Bense, S Ziegler, et al. (1996) Metabolic characterization of breast tumors with positron emission tomography using F-18 fluorodeoxyglucose. J Clin Oncol 14(6): 1848-1857.
- Wahl RL, Siegel BA, Coleman RE, Gatsonis CG, PET Study Group (2004) Prospective multicenter studyof axillary nodal staging by positron emission tomography in breast cancer: a report of the Staging Breast Cancer with PET Study Group. J Clin Oncol 22(2): 277–285.
- Bellon JR, Livingston RB, Eubank WB, Julie R Gralow, Georgiana K Ellis, et al. (2004) Evaluation of the internal mammary lymph nodes by FDG-PET in locally advanced breast cancer (LABC). Am J Clin Oncol 27(4): 407-410.
- D'Souza MM, Sharma R, Mondal A, Abhinav Jaimini, Madhavi Tripathi, et al. (2009) Prospective evaluation of CECT and 18F-FDG-PET/CT in detection of hepatic metastases. Nucl Med Commun 30(2): 117–125.
- Bamba Y, Itabashi M, Kameoka S (2011) Value of PET/CT imaging for diagnosing pulmonary metastasis of colorectal cancer. Hepatogastroenterology 58(112): 1972-1974.
- Cook GJ, Houston S, Rubens R, Maisey MN, Fogelman I (1998) Detection of bone metastases in breast cancer by 18FDG PET: differing metabolic activity in osteoblastic and osteolytic lesions. J Clin Oncol 16(10): 3375–3379.
- Kitajima K, Nakamoto Y, Okizuka H, Onishi Y, Senda M, et al. (2008) Accuracy of whole-body FDG-PET/CT for detecting brain metastases from non-central nervous system tumors. Ann Nucl Med 22(7): 595-602.
- Riedl CC, Pinker K, Ulaner GA, Leonard T Ong, Pascal Baltzer, et al. (2017) Comparison of FDG-PET/CT and contrast-enhanced CT for monitoring therapy response in patients with metastatic breast cancer. Eur J Nucl Med Med Imaging 44(9): 1428-1437.
- Eubank WB, Mankoff DA, Vesselle HJ, Eary JF, Schubert EK, et al. (2002) Detection of locoregional and distant recurrences in breast cancer patients by using FDG PET. Radiographics 22(1): 5–17.
- Grahek D, Montravers F, Kerrou K, Aide N, Lotz JP, et al. (2004) [18 F]FDG in recurrent breast cancer: diagnostic performances, clinical impact and relevance of induced changes in management. Eur J Nucl Med Mol Imaging 31(2): 179–188.
- Schelling M, Avril N, Nahrig J, W Kuhn, W Romer, et al. (2000) Positron emission tomography using [18F] fluorodeoxyglucose for monitoring primary chemotherapy in breast cancer. J Clin Oncol 18(8): 1689–1695.
- Smith IC, Welch AE, Hutcheon AW, Miller ID, Payne S, et al. (2000) Positron emission tomography using [18F]-fluorodeoxy-D-glucose to predict the pathologic response of breast cancer to primary chemotherapy. J Clin Oncol 18(8): 1676–1688.
- Rese C, Dose J, Avril N (2002) Positron emission tomography for the diagnosis of breast cancer. Nucl Med Commun 23(7): 613–618.
- S You, D K Kang, Y S Jung, Y-S An, G S Jeon (2015) Evaluation of lymph node status after neoadjuvant chemotherapy in breast cancer patients: comparison of diagnostic performance of ultrasound, MRI and 18F-FDG PET/CTS You, MD, D K Kang, MD, and T H Kim, MD, PhD. Br J Radiol 88(1052): 20150143.
- Hidemi Kawajiri, Tsutomu Takashima, Naoki Aomatsu, Shinichiro Kashiwagi, Satoru Noda (2014) Prognostic significance of pathological complete response following neoadjuvant chemotherapy for operable breast cancer. Oncol Lett 7(3): 663-668.
- Seung Il Kim, Joohyuk Sohn, Ja Seung Koo, Se Ho Park, Hyung Seok Park, et al. (2010) Molecular Subtypes and Tumor Response to Neoadjuvant Chemotherapy in Patients with locally advanced Breast Cancer. Oncology 79(5-6): 324-330.
- Waqar Haque, Vivek Verma, Sandra Hatch, V Suzanne Klimberg, E Brian Butler, et al. (2018) Response rates and pathologic complete response by breast cancer molecular subtype following neoadjuvant chemotherapy. Breast Cancer Res Treat 170(3): 559-567.
- Buzdar AU, Ibrahim NK, Francis D, Daniel J Booser, Eva S Thomas, et al. (2005) Significantly higher pathologic complete remission rate after neoadjuvant therapy with trastuzumab, paclitaxel, and epirubicin chemotherapy: results of a randomized trial in human epidermal growth factor receptor 2-positive operable breast cancer. J Clin Oncol 23: 2676–2685.


