Enhancing Mammogram Images with Segmentation and Colorization for Assisting Breast Cancer Detection
William Tien Pham1*, Trung Tat Pham2, and Pamela Illescas Maldonado3
1Department of Natural Sciences, Trinity University, San Antonio, Texas, USA
2Cyberworx & Department of Computer & Cyber Sciences, United States Air Force Academy, Colorado, USA
3Escuela de Ciencias de la Salud, Universidad Viña del Mar, Viña del Mar, Chile
Submission:November 05, 2020; Published:November 17, 2020
*Corresponding Address:William Tien Pham, Department of Natural Sciences, Trinity University, San Antonio, Texas, USA
How to cite this article:Pham W T, Pham T T, Illescas Maldonado P. Enhancing Mammogram Images with Segmentation and Colorization for Assisting Breast Cancer Detection. Canc Therapy & Oncol Int J. 2020; 17(2): 555960.DOI:10.19080/CTOIJ.2020.17.555960
Abstract
This paper presents a combined sequence of the K-mean clustering of mammogram images to identify the region of interest and false colorization of the region of interest to enhance digital mammograms in the context of assisting the analysis for the detection of breast cancer. The K-means clustering technique was selected for its computational efficiency and for its not requiring prior knowledge of the statistical nature of the data. The region of interest is selected among the resulting clusters so that it can be colorized in a magnifying manner along a digitally simulated visible spectrum to enhance visualization of details that is so important for medical experts in their detection of breast cancer. Numerical results are presented in the study as the proof of concept, and demonstration of workability, applicability, and practicality of the newly developed sequential hybrid technique of image enhancement.
Keywords: Image enhancement; Segmentation; Colorization; Mammograms; Breast cancer
Introduction
Breast cancer is the formation of uncontrollable cells in the breasts of human, commonly seen in women [1]. Next to skin cancer, breast cancer is the second most common cancer among women in the United States [2]. Mammogram is the scanning process designed to detect signs of breast cancers [3]. The result of a mammogram is a black and white monochromic image [4] showing the internal structure of the breasts that allows medical experts to view, analyse, and detect the first signs of breast cancers [5]. This preliminary detection is followed with a more invasive biopsy procedure [6] to ascertain the presence of breast cancers.
The analysis of mammogram images is manually and visually done by medical experts to identify lumps of cells that massively accumulate inside the breasts [7]. Since this analysis is visually done, it is desirable to enhance the images [8] in some manner that allows better visualization of the contrasting details and easy detection of these lumps so that a decision to perform biopsy procedure can be made. Many image enhancement techniques are available but require the medical experts to understand them to manually set their parameters correctly for the enhancement to work. The setting of these parameters is often adjusted on the trial-and-error basis that can be repetitive and tedious [9], and consequently can wear out the mental acuity of the experts [10].
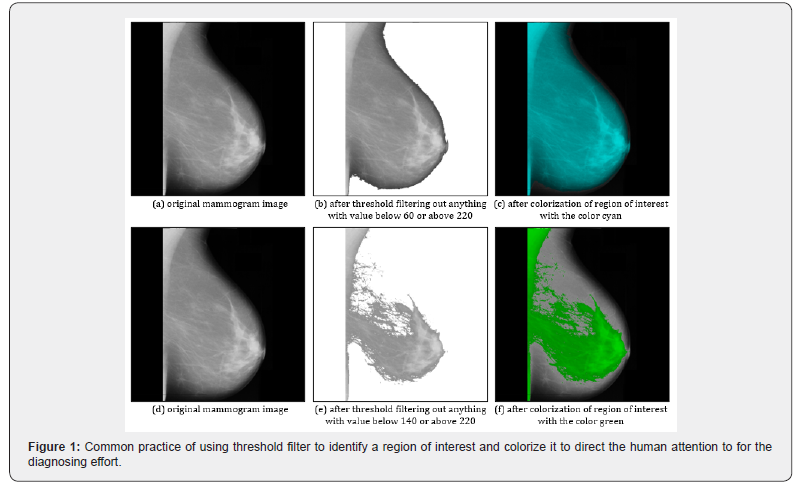
To help human experts identifying lumps in mammograms, clustering techniques [11] are used so that regions of an image with pixels of similar values can be automatically grouped together by computers to form separate regions, and their attention can be directed to the suspected area on the image. In this endeavour, there are four basic types of clustering techniques that are available: K-means, hierarchical, fuzzy C-means, and model based. The K-means technique is the grouping of data points according to the similarities of their values and some predefined reference points [12]. The hierarchical technique is the grouping of data points according to the similarities in their values [13]. The fuzzy C-mean technique is a modification of the K-means technique with additional rules on how to group data that are somewhat equally like many predefined reference points at the same time [14]. The model-based technique assumes the statistical normal distribution for each group and groups the data in the maximum likelihood manner [15] (Figure 1).
This paper proposes the use of the K-means clustering technique to automatically identify regions of interest in mammogram images, and a colorization scheme with an extended range of colors to enhance the contrast of an image at the pixel level. In this study, statistical properties of the image are not available, and therefore the model-based clustering technique is not applicable. Furthermore, it is assumed that no prior knowledge of how to treat data points that are equidistant to the reference points is available, and therefore the fuzzy C-mean clustering technique is not applicable. The hierarchical clustering technique is computationally intense for a large set of data associating with an image and therefore will not be feasible in this study. First, the segmentation of an image with the K-means clustering technique is carried out. Then the colorization of a selected region of interest is performed to enhance the contrast and visibility of features in that region of interest. The methodology is outlined in steps that can be implemented in a computer. Numerical results for this newly developed hybrid technique are shown to prove the concept and to demonstrate the workability, applicability, and practicality of the solution.
Background
Mammogram imaging is the studying of images resulted from mammogram scanning with the objective to detect early signs of breast cancer. In this context, mammogram images are black and white monochromic images with examples shown in Figures 1a & 1d. These images are analysed by human medical experts with the objective of identifying massive lumps that are signs of a cancer in development. The gray levels and the cluster of pixels with light gray levels are what medical experts are paying attention to to make the preliminary diagnostic assessment (Figure 2).
One common practice for medical experts reviewing the mammogram images is to identify a region of interest specified by the lower limit and upper limit in pixel values and highlight it with a color so that they can pay more attention to it in their attempt to make the diagnostic assessment. Figures 1b and 1e show the effect of a threshold filter that only retains pixels with values within a specific range defined by a lower threshold value and upper threshold value. Figures 1c and 1f shows the highlighting of the region of interest identified by the threshold filter so that more attention can be directed to it during the diagnosing analysis. While the practice is common with available software (in the form of a slider) or hardware (in the form of a controlling knob) to allow human to adjust the thresholds and see the corresponding results in near real time, it is still tedious to find the correct thresholds representing the region of interest that reveals potential sign of cancers. Another issue with this practice is that the highlighting is used mainly to draw attention to but without enhancing the details to make the diagnostic easier.
The objective of this work is to find a systematic method of automatically identifying the region of interest, and a colorization scheme that can enhance the details enclosed within the identified region of interest. When the mammogram image is pre-processed sequentially with these two solutions, the result will be an image with enhancement of the features in the region of interest to allow medical experts to solely focus on the diagnosing effort instead of having to divide and divert their attention to the tedious task of adjusting of the region of interest that can wear out their mental acuity very fast, leaving them with little sound state of the mind to perform their main diagnosing duties. To address this objective, a corresponding research question is formed to guide the work presented in this paper: Is it possible to pre-process mammogram images with computer and as little instruction from human as possible to identify the region of interest (representing possible signs of breast cancer) and colorize it to enhance the details for a human expert to analyse with better effectiveness?
Methodology
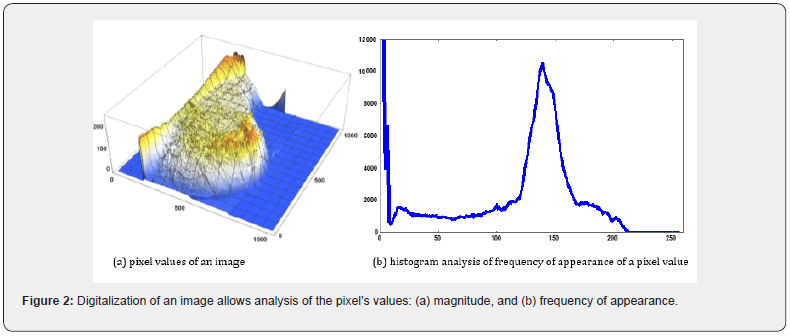
Consider a typical mammogram image shown in Figure 1(a). It consists of three main groups of pixels: (i) dark pixels representing the background, (ii) medium gray pixels representing normal tissues, and (iii) bright light gray pixels representing dense materials that require attention. With the digital imaging technology, color information of the pixels is encoded into numbers and the image can be numerically analyzed in various aspects. Figure 2(a) shows the encoding numerical values of the mammogram image in Figure 1(a), and Figure 2(b) shows the histogram analysis of how many times a pixel value appears in the image. The histogram analysis in Figure 2(b) confirms that there are three groups of pixels: (i) pixels with values from 0 to about 60 (dark pixels), (ii) pixels with values from about 60 to 160 (medium dark pixels), and (iii) pixels with values from about 160 to 255 (bright light color pixels).
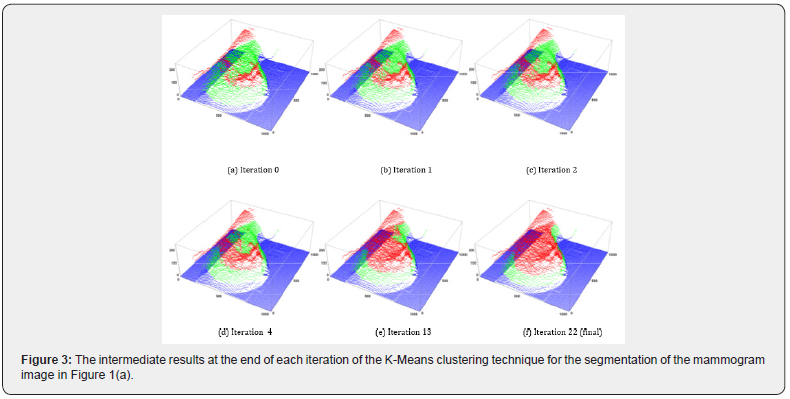
In this section, two implementable procedures are introduced and outlined to satisfy the objective mentioned in the previous section. The first procedure is the K-means clustering technique where the initial conditions are systematically specified for the purpose of segmenting mammogram images. The second procedure is the colorization where a wide range of colors in the visible spectrum is coded in a sequence of gradually changing colors so that the value of a pixel in a mammogram image can be transformed into the index of this sequence of gradually changing color to retrieve the color to assign to that pixel. The resulting image is a color image with much more contrast to show details that could not easily be seen when they are coded in a smaller range of gray levels (Figure 3).
K-Means Clustering Technique
K-means clustering technique is a method of separating a data set into smaller subsets, with each subset being called a cluster because of the similarity in the nature of the data within that subset. In general, the K-means clustering technique consists of the following algorithmic steps:
i. Initialization 1: set the number of clusters to be a constant N (the user must make an assumption of this number)
ii. Initialization 2: establish N set of coordinates for the N clusters set in the previous step. Assign some arbitrary constants to these coordinates.
iii. For each of the data point in the given data set, calculate N distances from this data point to the center of each of the N clusters.
iv. Select the cluster whose center is the closest to the data point and assign this data point to that cluster.
v. Repeat Steps (iii) and (iv) for each data point in the data set.
vi. Recalculate the center of each cluster based on the new cluster assignments of the data done in Steps (iii) through (v)
vii. Repeat Steps (iii) thourgh (vi) when there are still differences between the centers of the clusters and the recalculated centers of the clusters.
As mentioned earlier, a mammogram image has three primary groups of pixels representing the background (dark pixels), the normal tissues (medium gray pixels), and dense tissue (bright light color pixels). Thus, the number of clusters N can be set to 3 in Step (i) above. The initial centers of the clusters in Step (ii) can be assigned with pixel value 0 for the first center, pixel value 127 for the second center, and 255 for the third centers. This assignment is to ensure that there will be pixels assigned to each of the clusters in the first iteration. Figure 3 shows the first few iterations and the last few iterations in the segmentation of the image in Figure 1(a) whose pixel values are shown in Figure 2(a) (Table 1 Figures 4 & 5).


Colorization
Data in the pixels of the mammogram image have values ranging from 0 (black) to 255 (white). This small range offers very little variation in the gray color representations of two consecutive pixel values (p) and (p + 1), preventing the human eyes to see the contrasting details of black & white monochromic mammogram images. To increase the contrast between two consecutive pixel values (p) and (p + 1), it is proposed that a much larger range of gradually changing colors is used so that the consecutive values (p) and (p + 1) can be stretched to (θ)(p) and (θ)(p + 1) where q is the number of times larger the new range is when compared to the old range of 256 gray levels. Furthermore, the use of many colors in this new color range will improve the contrasting between two consecutive pixel values even more.
Consider the visible spectrum of colors shown in Table 1. This spectrum consists of 5 primary colors ranging according to the wavelengths: violet, blue, green, yellow, and red. In the RGB code representation, a gradual transitioning of 256 colors can be constructed between each consecutive pair of these colors, yielding a range of (4)(256) gradually changing colors, or θ = 4. Figure 4 shows this wider color range that is proposed for the colorization scheme in this study. This color range can be constructed as follows:
(i) Initialization 1: establish an array of (4)(256) = 1024 elements
(ii) Initialization 2: for each of the 5 primary colors mentioned earlier in the visible spectrum, define the RGB codes for it as follows:
Color(0) = (255, 0, 255) = violet,
Color(255) = (0, 0, 255) = blue,
Color(511) = (0, 255, 0) = green,
Color(767) = (255, 255, 0) = yellow,
Color(1023) = (255, 0, 0) = red.
(iii) Transitioning: for each integer index between 1 and 254, between 256 and 510, between 512 and 766, and between 768 and 1022, generate the transitioning colors as follows:
Color(i) = (255 – i, 0, 255) for 1 ≤ i ≤ 254,
Color(i) = (0, i – 255, 511c) for 256 ≤ i ≤ 510,
Color(i) = (0, i – 511, 767 – i) for 512 ≤ i ≤ 766, (Figures 6 & 7).
Color(i) = (255, 1023 – i, 0) for 768 ≤ i ≤ 1022,
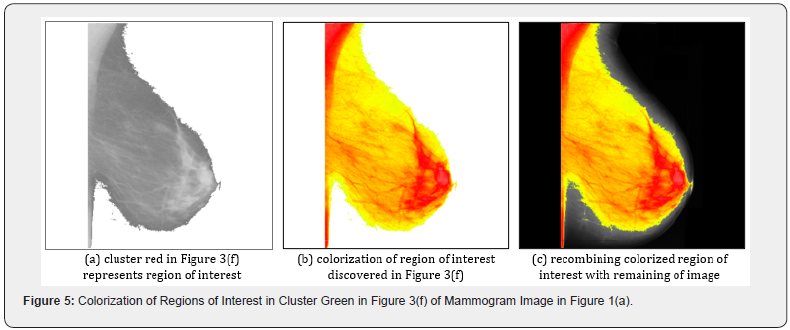
With the visible spectrum converted into a sequence of 1024 gradually changing colors, the 256 gray levels in a mammogram image are stretched to 1024 color levels that significantly increase the contrasting details due to both the stretching and the use of various colors. Figure 5 shows the colorization of the red cluster in Figure 3(f) representing the regions of interest of the original mammogram in Figure 1(a). The final colorized image in Figure 5(c) clearly shows more details to the human eyes than the original image, making it easier to analyze.
Numerical Results
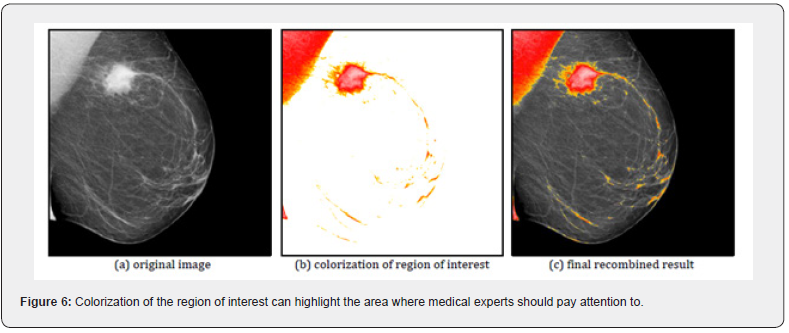
In this section, the two sequential steps of segmentation and colorization are applied to various mammogram images to show that the enhancement can be done automatically by computers. This automate process will relieve the human experts from having to perform the tedious task of looking for the region of interest that can easily wear out their mental acuity. With fresh mental acuity, the human experts can focus on making correct diagnostic assessment. It is important to note that this automate process does not create nor destroy any new information; rather, it only enhances the visibility of existing information so that the human eyes can observe and process it more effectively and efficiently. Figures 6 through 9 demonstrate the workability of the twostep procedure outlined earlier. For each of the original image shown on the left, the center image is the cluster of pixels with high values that were colorized with the simulated visible spectrum, and the right hand side image is the recombining of the center colorized cluster with the original image to show enhancement of the details necessary for the medical expert to pay attention to. In the four cases presented in these figures, the final results clearly show more details, and the colorization easily calls attention of the viewers to the specific areas that need attention (Figures 8 & 9).
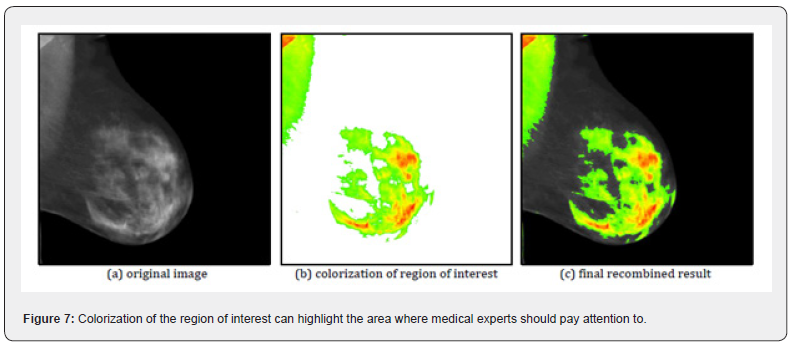
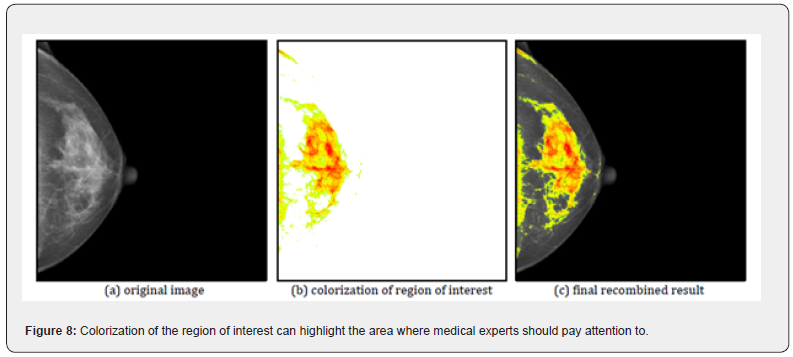
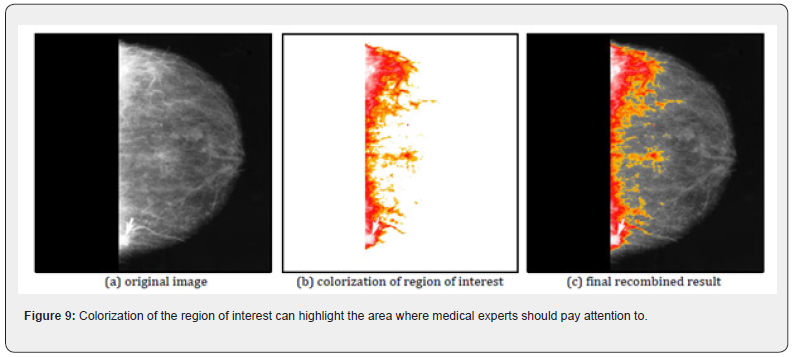
Note that the colorization in Figures 6 to 9 shows a dominance of the colors yellow and red. This dominance is due to the data values in the pixels identified for the region of interest in the high range somewhere between 200 and 255. This is to be expected. However, if the human experts prefer different color, the simulated visible spectrum shown in Figure 4 can be easily modified so a different set of colors will appear at the high end of the spectrum.
Discussion and Future Direction
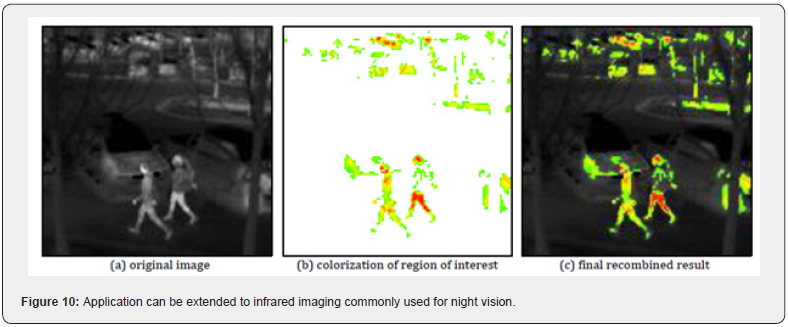
The enhancement of monochromic mammogram images presented in this paper can be easily extended to other types of monochromic images such as infrared images, x-ray images, electron microscope images, etc. The difficulty of using any type of clustering technique to segment an image is to understand the nature of the images so that correct initial conditions (the number of clusters) can be established. Depending on the specific type of application and the information that is needed, the region of interest can be specifically tuned to get the best effect. Figure 10 shows the use of thermal infrared camera in a night vision application where warm objects are highlighted.
Conclusion
A systematic procedure to segment an image, to identify the region of interest, and to colorize that region of interest with an extended range of colour has been developed to enhance the visibility of mammogram images for detection of breast cancer. The solution will relieve the medical experts from having to manually perform the pre-processing for image enhancement that can wear out their mental acuity very fast (Figure 10). Numerical results were included to demonstrate the workability, applicability, and practicality of the solution. Furthermore, the procedure can be shown to be applicable in other areas of imaging such as infrared imaging for night vision, etc.
Acknowledgment
Part of this study was done in collaboration with the Universidad Viña del Mar in Chile. Mammogram images used in this study were provided by The Cancer Imaging Archive
(https://wiki.cancerimagingarchive.net/display/Public/ CBIS-DDSM).
References
- WaksAG, Winer EP (2019)Breast Cancer Treatment - A Review. JAMA321(3): 288–300.
- American Cancer Society (2020)How Common is Breast Cancer?
- Lille S, Marshall W (2019) Mammographic Imaging. Wolters Kluwer, Philadelphia, USA.
- Alsheimer L(2017) Black and White in Photoshop CS4 and Photoshop Lightroom: A complete integrated workflow solution for creating stunning monochromatic images in Photoshop CS4, Photoshop Lightroom, and beyond. Burlington, MA: Focal Press Elsevier.
- Hayward JH, Kimberly M Ray, Dorota J Wisner, John Kornak, Weiwen Lin(2016) Improving Screening Mammography Outcomes Through Comparison with Multiple Prior Mammograms. American Journal of Roentgenology 207(4): 918-924.
- Alimirzaie S, Bagherzadeh M, Akbari MR (2019) Liquid biopsy in breast cancer: A comprehensive review. Clinical Genetics95(6): 643-660.
- Ikeda D, Miyake KK (2019)Breast Imaging: The Requisites. St. Louis, MO: Elsevier, USA.
- Russ JC, Neal FB (2017) The Image Processing Handbook. Boca Raton, CRC Press.
- Christensen H, Søgaard K, PilegaardM, Olsen, HB (2000)The importance of the work/rest pattern as a risk factor in repetitive monotonous work. International Journal of Industrial Ergonomics 25(4): 367-373.
- Björklund M, Crenshaw AG, Djupsjöbacka M, Johansson M(2000) Position sense acuity is diminished following repetitive low-intensity work to fatigue in a simulated occupational setting.Eur J ApplPhysiol81(5): 361-367.
- Aggarwal CC, Reddy CK(2013)Data Clustering: Algorithms and Applications. Boca Raton, FL Chapman and Hall/CRC, USA.
- Morissette L, Chartier S (2013)The k-means clustering technique: General considerations and implementation in Mathematica. Tutorials in Quantitative Methods for Psychology9(1): 15-24.
- Murtagh F (1983)A survey of recent advances in hierarchical clustering algorithms. The Computer Journal26(4): 354-359.
- Bezdek JC, Ehrlich R, FullW (1994) FCM: The fuzzy c-means clustering algorithm. Computers & Geosciences10(2): 191-203.
- Zhong S, Ghosh J (2003)A Unified Framework for Model-based Clustering. Journal of Machine Learning Research4(11): 1001-1037.


