


Development and Internal Validation of a Nomogram for Predicting Significant Prostate Cancer in Patients with PSA Level less than 20 Ng/Ml
Stojadinovic Miroslav1,2, Stojadinovic Dobrivoje1,3*, Pantic Damnjan1 and Stojadinovic Milorad2
1Department of Urology, Clinical Centre Kragujevac, Clinic of Urology and Nephrology, Kragujevac, Serbia
2University of Kragujevac, Faculty of Medical Sciences, Serbia
3Department of Anatomy, University of Kragujevac, Faculty of Medical Sciences, Serbia
Submission: June 28, 2019; Published: July 11, 2019
*Corresponding Address: Stojadinovic S Dobrivoje, Department of Urology, Clinic of Urology and Nephrology, Clinical Centre Kragujevac, Zmaj Jovina 30, 34 000 Kragujevac, Serbia
How to cite this article: Stojadinovic Miroslav, Stojadinovic Dobrivoje*, Pantic Damnjan and Stojadinovic Milorad. Development and Internal Validation of a Nomogram for Predicting Significant Prostate Cancer in Patients with PSA Level less than 20 Ng/Ml. Canc Therapy & Oncol Int J. 2019; 14(3): 555887. DOI:10.19080/CTOIJ.2019.14.555887
Abstract
Aim: To develop and validate internally the nomogram that allows an individual assessment of a risk of harboring significant prostate cancer (PCa) in patients with prostate-specific antigen (PSA) level less than 20 ng/ml, prior to initial and repeat biopsy in Serbian population.
Methods and Materials: All consecutive men with PSA <20 ng/mL who had undergone prostate biopsy were recruited. Variables analyzed included age, PSA, digital rectal examination (DRE) findings, prostate volume (PV) and sampling density. Logistic regression coefficients were used to construct nomogram of PCa outcomes. Predictive accuracies were assessed using area under receiver-operator characteristic curve (AUC). Bootstrap resamples were used for internal validation. Model calibration was assessed using calibration belt. We compared the specificities of nomogram at fixed sensitivities. Our nomogram was compared to a model based on PSA alone using AUC and decision curve analysis (DCA).
Results: Out of 231 men analyzed significant PCa diagnosed in 59 (25.5%) of patients. Total PSA, PV and DRE were independent predictors and used to construct nomogram. The AUC of our nomogram was 77.3% and resulted in a significant accuracy increment of 14.4% (p=0.011), compared with the serum PSA alone. In internal validation, nomogram had acceptable calibration belt. Using DCA, our nomogram had superior net benefit and net reduction in biopsy rate compared to PSA alone.
Conclusion: The nomogram configured based on routinely available clinical parameters could provide precise risk-analysis information for individual Serbian patients. However, external validation of this novel nomogram is recommended prior to its clinical routine use.
Keywords: Prostate cancer; Prostate biopsy; Nomogram; Internal validation
Abbreviations: AUC: Area under the curve; BPH: Benign Prostatic Hyperplasia; CI: Confidence Interval; DCA: Decision Curve Analyses; DRE: Digital Rectal Examination; GS: Gleason Score; HL: Hosmer-Lemeshow; IQR: Interquartile Range; MRI: Magnetic Resonance Imaging; NA: Not Applicable; OR: Odds Ratio; PA: Predictive Accuracy; PCa: Prostate Cancer; PCA3: Prostate Cancer Antigen 3; PCP: Prostate Cancer Probability; PHI: Prostate Health Index; PSA: Prostate-Specific Antigen; PSAD: Prostate-Specific Antigen Density; PV: Volume of Prostate; RP: Radical Prostatectomy; tPSA: Total Prostate-Specific Antigen; SD: Sampling Density; TRUS: Transrectal Ultrasound; χ2: Chi square; %fPSA: percentage of free PSA
Introduction
Prostate cancer (PCa) is the most common estimated cancer among men in Europe [1]. Usage of serum prostate-specific antigen (PSA) test dramatically increases in the number of men undergoing prostate biopsy over the last decades. However, serum PSA level alone lacks the specificity, and potentially causing unnecessary treatment complications with prostate biopsy. Furthermore, overdiagnosis and overtreatment of indolent PCa is a serious health issue in most developed countries [2]. In an attempt to further reduce the rate of unnecessary prostate biopsies several nomograms have been developed to predict various PCa outcomes that range from prediction of biopsy outcome in men considered at risk of PCa through prediction of Gleason sum upgrading between biopsy and radical prostatectomy pathology to prediction of side-specific extracapsular extension at radical prostatectomy (RP) and death from hormone-refractory PCa [3]. To date numerous internally and externally validated regressions-based nomogram is available to quantify the risk of PCa on biopsy, worldwide [4-10]. To our knowledge, only three studies have been done to develop nomograms or model to determine significant PCa [11-13], and only 2 studies developed nomograms at initial or repeat biopsy settings [14,15]. The predictive accuracy of the nomogram for PCa detection ranged from 73% to 88% [5,13]. Racial, clinical and biochemical differences may explain the observed discrepancy in predictive accuracy (PA) [6].
Although several nomograms for PCa detection have been developed for western and Asian populations, the model constructed on Serbian data would be more useful for the Serbian population. Studies indicated that incidence of PCa is significantly different between European country. For example, the incidence of PCa is highest in northern and Western Europe but rates in eastern and southern Europe [1]. To the best of our knowledge, such a nomogram has not yet been developed or validated in Serbian population. Recently, nomograms are being developed with the new available biomarkers, in particular prostate cancer antigen 3 (PCA3) and Prostate Health Index (PHI) [15]. On the other hand, these may diminish its ease of use and the applicability of the model in clinical practice, considering the fact that these new biomarkers are not available everywhere [15].
We hypothesized that accurate prediction of the probability of significant PCa on prostate biopsy could be done using routinely available risk factors. Based on these considerations, the aim of the study was to develop and validate internally the nomogram that allows an individual assessment of a man’s risk of harboring significant PCa in patients with PSA level 20 ng/ml or less, at the time of initial and repeat biopsy.
Materials and Methods
Patient Population
This is a retrospective study carried out using the database of 330 patients at Clinical Centre Kragujevac, Serbia, who had undergone ultrasound guided (TRUS) prostate biopsies, from September 2016 through January 2018. Patient referrals were obtained in the course of routine clinical care, regardless of PSA level or clinical findings. The study included only patients with PSA values less than 20 ng/ml. Exclusion criteria were patients with incomplete data, and medical therapy known to affect PSA levels. The study was approved by the institutional review boards (01/17/2608). The primary outcome was the detection of clinically significant PCa on biopsy. Clinically insignificant prostate cancer was defined histopathologically according to the PRIAS inclusion criteria for low-risk PCa: T1C/T2, PSA ≤ 10 ng/ml, PSAD < 0.2 ng/ml/ml, one or two positive biopsy cores, and Gleason score (GS) ≤ 6 [16]. The data were collected about clinicopathological characteristics for each patient as regards prebiopsy assessment and included following: age, total PSA, digital rectal examination (DRE), volume of prostate (PV), PSA density (PSAD), biopsy history, total number of cores taken, Gleason score, and number of positive cores biopsies. They were complemented by sampling density (SD), defined as the ratio between total gland volume and the number of cores at biopsy.
Clinical Evaluation
PSA was measured before DRE and TRUS. A member of the urology team performed a DRE or prostate biopsy on all patients. The DRE was classified as normal, or suspicious/ positive. In order to gain ultrasound data and prostate biopsy, Toshiba (Aplio 300) ultrasound device with 5-10-MHz probe was used. Prostate volumes were obtained by measuring the gland in three dimensions, and volume was estimated using the following formula: 0.52 [length (cm) × width (cm) × height (cm)]. Patients underwent TRUS-guided prostate biopsies according to a standardized extended scheme. After obtaining a median of ten core biopsies (range, 8 to 12 cores), it was assessed by local pathologists.
Statistical Analysis
Descriptive statistics was used for predictor variables. To identify and quantify the independent predictors of significant PCa, we performed univariate and multivariate logistic regression analysis with Backward–Wald stepwise. The results of regressions were expressed in odds ratios (ORs) with 95% confidential interval (CI). Multicolinearity analyses were also performed between PSAD and other clinical variables. Invariably, PSAD was not correlated to any other variable.
The new nomogram is based on logistic regression coefficients from multivariable model predicting the presence of significant PCa on extended biopsy. The prediction model was graphically presented as a nomogram for clinical use. The discrimination (the predictive accuracy) was measured by the area under the receiver operating characteristic curve (AUC). We also calculated Brier score (mean square error) for nomogram. A nomogram was compared to another logistic model using serum PSA alone. The predictive performances of nomogram were also compared when patients were stratified by total PSA and divided into two groups: PSA level <10.0 ng/mL, and 10– 20.0 ng/mL. Furthermore, we compared the differences in the PA between patients with initial and repeat biopsies. The AUCs were compared by the Hanley and McNeil test [17]. For internal validation, the newly developed extended biopsy nomogram was subjected to 200 bootstrap resamples. Model calibration was assessed using the Hosmer–Lemeshow (HL) goodness-offit statistics and plotting a calibration belt [18]. The calibration belt is a fitted polynomial logistic function curve between the logit transformation of the predicted probability and outcome with surrounding 80% and 95% CI [19]. We also compared the specificities of nomogram at fixed sensitivities using a bootstrap based method [20]. By using decision curve analyses (DCA), clinical usefulness was assessed [21]. All analyses were performed using SPSS version 23.0 (SPSS Inc., Chicago, IL) or STATA version 13.0 (STATA Corp., TX, USA). Statistical significance was set at p < 0.05.
Results
After exclusion of subjects with missing data (18, 5.4%), and 81 (24.5%) men who had PSA levels >20 ng/mL, 231 patients were included in the final analysis. Including patients undergoing primary (n=155, 67.1%) or repeat biopsy (n=76, 32.9). Prostate cancer was detected in 84 (36.4%), but significant PCa diagnosed in 59 (25.5%) of patients. All demographic and clinical data after stratification according to absence or presence of significant PCa are summarized in Table 1. Men with significant PCa at biopsy had significantly higher PSA levels, higher PSAD, higher rates of suspicious DRE. Conversely, PV and SD were significantly smaller in patients diagnosed with significant PCa relative to patients without significant PCa.

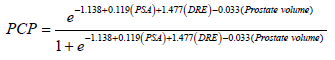
In a univariate analysis, 5 risk factors displayed significant correlation with significant PCa (Table 2). During multivariable analysis three sustained their prognostic significance. The analysis demonstrated the DRE, total PSA and PV represented independent predictors of significant PCa on extended biopsy (Table 2). The equation for prostate cancer probability (PCP) was developed based on the final logistic regression model.

The resulting new biopsy nomogram, which was built by using DRE, PV and total PSA, is shown in Figure 1. Assessment of the nomogram axes indicate that the maximum number of risk points may be contributed by low PV and it was inversely related to risk points. Total PSA represents the second most important contributor to risk points and was directly and linearly related to increasing risk. Finally, suspicious DRE moderately increased risk.


Predictive performance for the nomogram is shown in Figure 2 and Table 3. The AUC of our nomogram was 77.3% and resulted in a significant accuracy increment of 14.4% (p=0.011), compared with the serum PSA. Using a 200 bootstrap resampled dataset, the nomogram’s AUC was 77.8 (95% CI 70.2 – 85.4), actually only a slight increase (+ 0.005) in discriminative ability (p=0.926). When comparing PA of nomogram in patient’s subpopulation stratified by total PSA, no significant difference (p=0.216) was found. However, nomogram showed significantly decreased ability (p<0.001) to predict the outcome of extended biopsy in patients with inicial biopsy (69.3%) relative to patients with repeat biopsies (91.8%). All HL tests had p value greater than 0.05, indicating that there are no significant differences between the observed and expected outcomes and therefore all models imply good overall calibration. The better (lower) value of Brier score was for nomogram.

Table 4 shows the specificity of nomogram and PSA alone at set sensitivities of 80%, 90% and 95%. At any given sensitivity nomogram had a greater specificity than reference model. For example, using a nomogram predicted probability cut off 10.9% (the 90% sensitivity cut off), 10% of significant PCa would have been missed and 26% of men with benign disease or insignificant prostate cancer could have been spared a biopsy. For comparison, 18% would have been spared using reference model. Thus, an additional 8% of biopsies could be avoided using nomogram compared to PSA alone.

Calibration belt for the nomogram, shown in Figure 3, presented at two confidence level (80% light gray area and 95% dark gray boundaries). The x axis represents nomogram predictions and the y axis represents the observed rate of significant PCa on initial or repeat biopsy. The 45-degree line represents ideal predictions. Virtually ideal calibration was recorded for the development and internal validation of the new extended biopsy nomogram, with narrow bands. In the decision curve analysis, nomogram predicting significant PCa provided net benefit for threshold probabilities of approximately 10% or higher as compared with the strategy of biopsied all patients, or alternatively, biopsied no one. The nomogram was clearly superior to the PSA model with a higher net benefit for all threshold probabilities >10% (Figure 4a). The reduction in the number of unnecessary biopsies per 100 patients is net of false negatives, without a decrease in the number of patients with significant PCa who duly have PCa. Also, in this case, nomogram (blue line) outperformed PSA alone (red line) for threshold probabilities above approximately 10% (Figure 4b). For instance, if a probability threshold of 20% derived from our nomogram was used as a basis for biopsy to detect significant PCa it would result in a net reduction of about 20 unnecessary biopsies per 100 men without missing any cancers as compared to a strategy of having all the men in our study undergo prostate biopsies.


Discussion
Selective use of prostate biopsy among men with elevated PSA levels through further refinement of cancer risk is highly desirable. We developed and internally validated a nomogram predicting clinically significant PCa. The performance was assessed by studying three aspects of validity: discrimination, calibration and clinical usefulness. In the current population, our nomogram demonstrated a good accuracy and optimal calibration at internal validation in the initial and repeat biopsy settings. The nomogram significantlly outperformed serum PSA in diagnostic performance. These findings were further corroborated by DCA, which revealed that the nomogram resulted in the highest net benefit across a wide range of threshold probabilities, confirming the clinical usefulness of our prediction tool. These results suggest that developed nomogram may help physicians and patients to make more informed decisions for prostate biopsy based on patients’ individual conditions.
Previous existing nomograms have established criteria associated with higher risk of PCa in the initial and repeat biopsy setting. They included age [4,5,7-10,12,13,22,23], race [22], DRE [4,5,7,9,10-13,22], total PSA [4, 5,7-13], percentage of free PSA (%fPSA) [4,5,7-11,22], PSAD [8], PV [9,10,12,13,22], hypoechoic lesions on ultrasound [8,9], biopsy history [13,23], family history [22], PHI [15,24], PHI density [25], PCA3 [22] and magnetic resonance imaging (MRI) [13,23]. In concordance with previous studies, several of those predictors have reached statistical significance in the univariate or multivariate analysis in our study. Nevertheless, many of these parameters did not sustain their independent value. According to the analysis, encouraging prediction of significant PCa is possible on the basis of DRE, total PSA and PV. In accordance with previous reports [14, 15], PV was the most informative single predictor of significant PCa. Some other studies showed that adding percentage of free PSA (%fPSA) would add 8% accuracy to their model derived from age, PSA and DRE [4]. %fPSA was not considered in our study because not all of the assessed patients had available %fPSA information. Moreover, a lower %fPSA, especially <10%, is an important parameter when deciding whether to perform a biopsy on patients with a total PSA between 2.5 ng/mL and 10 ng/mL [26].
Our nomogram, however, are not protocol specific, and include both initial and repeat biopsy. To our knowledge, only 2 studies have been done to develop nomograms to determine PCa at initial or repeat biopsy [14,15]. Their models derived from age, DRE, PSA, PV, biopsy history and novel markers (PHI or PCA3). However, our tool relies on fewer variables and more readily available parameters. Moreover, it is important to note that within their cohort, commonly applied standard risk factors of PCa failed to achieve satisfactory PA (68%) and this finding further corroborates the need for investigation of novel markers to improve PCa prediction [14]. Including specific markers in their logistic regression model increased PA by 5-7%, but overall accuracy (73-80%) was not better compared to our findings. Comparison of our findings with those of others suggests that the contemporary biopsy outcome can be predicted accurately without using specific biomarkers.
We compared multivariable predictive models to PSA alone, and this may have been the most relevant comparison. Benefits of AUC of 2% to 26% (average of ∼10% improvement) have been reported in previous prediction models over models using PSA measurements alone. So, the predictive accuracies and the improvements in AUC of our nomogram were comparable to various other studies [27].
Others addressed the notion of SD and proposed to increase the number of biopsy cores with the intent of improving the diagnostic yield. Our results confirmed that SD represents informative predictor of significant PCa on needle biopsy in univariate analysis. However, according to our multivariable analysis, a standardized extent of gland sampling may not be ideal for all men regardless of the size of their prostate [4]. We believe that this PSA range (<20 ng/ml) is the most significant for clinical practice as above this PSA level, cancer is highly likely to be detected on biopsy. Some other studies utilized relatively narrow the PSA range [11] and its applicability to all men presenting for PCa may be questionable. Study with similar design conducted in a Singaporean population, predicted the probability of overall and clinically significant PCa, though on initial biopsy [12]. However, comparison of different decision tools can be difficult due to inherent differences of development populations that cannot all be accounted for. The incidence of significant PCa (26.5%) was significantly lower compared to incidence of PCa in other studies (38.4- 39.1%) [14,15]. The fact that our nomogram is both constructed and validated in Serbian men is strength of our analysis. The major controversy regarding our model seems to be uncertainty in diagnostic accuracy between patients with inicial and repeat biopsy. Nevertheless, in our DCA we confirmed clinical uselessness of this nomogram and we also identified range of threshold probabilities (about 10%) in which nomograms were of value. Our nomogram is associated with lower false positive predictions, and we estimated that 20% of men with benign disease or insignificant PCa could have been spared a biopsy without missing any significant cancers, if a probability threshold of 20% was used as a basis for biopsy to detect significant PCa.
Although an internal validation is not considered to be the gold standard, using bootstrap resamples indicated the robustness of our novel tool and its significant predictors. One of the great advantages of using bootstrap to validate a regression model is that the entire original dataset can be utilized to develop more robust regression equations. This appears particularly important in moderate-size databases [28]. Anyway, optimal generalization of this model must be carefully considered until adequate external validation is performed and should be revisioned with a larger population in the future [11].
The most important limitation of this study is moderately a smaller number of the population than for the previous prebiopsy nomograms, retrospective design, conducted in a single tertiary centre that restricted generalization of the rules. Furthermore, our outcomes have not been confirmed by histological reports following radical prostatectomy. Next, criteria for insignificant PCa are not generally accepted. Modern study suggests that not all Gleason 3+4 will have aggressive disease [29]. Then, pre‐biopsy MRI not only allows accurate tumour localization, but also provides an assessment of cancer suspicion and improves accuracy of existing nomograms but was not available in our cohorts of patients [11,13]. Finally, it is obvious that our nomogram needs strict external validation and findings of this study should be interpreted with caution. Despite these limitations we believe that our new nomogram represents an accurate, reliable and useful clinical aid, and we strongly encourage its routine use. To our knowledge, this study is the first that constructed and validated a predictive nomogram for patients with suspected PCa in the Southeast Europe.
Conclusion
The nomogram configured based on routinely available clinical parameters, DRE, PSA and prostate volume could provide precise risk-analysis information for individual Serbian patients with PSA levels less than 20 ng/mL and may help to identify patients who need a prostate biopsy. However, external validation of this novel nomogram is recommended prior to its clinical routine use.
Acknowledgement
The authors were financially supported through a research grant N0175014 of the Ministry of Science and Technological Development of Serbia. The authors thank the Ministry for this support.
Conflicts Interest
There are no conflicts of interest and no acknowledgements.
References
- Arnold M, Karim-Kos HE, Coebergh JW, Byrnes G, Antilla A, et al. (2015) Recent trends in incidence of five common cancers in 26 European countries since 1988: Analysis of the European Cancer Observatory. Eur J Cancer 51(9): 1164-1187.
- Mohler JL, Antonarakis ES, Armstrong AJ, D'Amico AV, Davis BJ, et al. (2019) Prostate Cancer, Version 2.2019, NCCN Clinical Practice Guidelines in Oncology. J Natl Compr Canc Netw 17(5): 479-505.
- Chun FK, Karakiewicz PI, Briganti A, Gallina A, Kattan MW, et al. (2006) Prostate cancer nomograms: an update. Eur Urol 50(5): 914-926.
- Karakiewicz PI, Benayoun S, Kattan MW, Perrotte P, Valiquette L, et al. (2005) Development and validation of a nomogram predicting the outcome of prostate biopsy based on patient age, digital rectal examination and serum prostate specific antigen. J Urol 173(6):1930-1934.
- Chun FK, Briganti A, Graefen M, Montorsi F, Porter C, et al. (2007) Development and external validation of an extended 10-core biopsy nomogram. Eur Urol 52(2): 436-44.
- Chun FK, Briganti A, Graefen M, Porter C, Montorsi F, et al. (2007) Development and external validation of an extended repeat biopsy nomogram. J Urol 177(2): 510-515.
- Kawakami S, Numao N, Okubo Y, Koga F, Yamamoto S, et al. (2008) Development, validation, and head-to-head comparison of logistic regression-based nomograms and artificial neural network models predicting prostate cancer on initial extended biopsy. Eur Urol 54(3): 601-611.
- Silva TB, Oliveira CZ, Faria EF, Mauad EC, Syrjänen KJ, Carvalho AL (2015) Development and validation of a nomogram to estimate the risk of prostate cancer in Brazil. Anticancer Res 35(5): 2881-2886.
- Nowroozi MR, Amini S, Kasaeian A, Zavarehei MJ, Eshraghian MR, Ayati M (2016) Development, validation and comparison of two nomograms predicting prostate cancer at initial 12-core biopsy. Asia Pac J Clin Oncol 12(2): e289-297.
- Kara O, Elshafei A, Nyame YA, Akdogan B, Malkoc E, et al. (2016) The nomogram conundrum: a demonstration of why a prostate cancer risk model in Turkish men underestimates prostate cancer risk in the USA. Int Urol Nephrol 48(10): 1623-1629.
- Ohigashi T, Kanao K, Mizuno R, Kikuchi E, Nakashima J, Oya M (2010) Predicting the probability of significant prostate cancer in Japanese men with serum prostate-specific antigen less than 10 ng/mL: development of a novel pre-biopsy nomogram. Int J Urol 17(3): 274-280.
- Lee A, Lim J, Gao X, Liu L, Chia SJ (2017) A nomogram for prediction of prostate cancer on multi-core biopsy using age, serum prostate-specific antigen, prostate volume and digital rectal examination in Singapore. Asia Pac J Clin Oncol 13(5): e348-e355.
- van Leeuwen PJ, Hayen A, Thompson JE, Moses D, Shnier R, et al. (2017) A multiparametric magnetic resonance imaging-based risk model to determine the risk of significant prostate cancer prior to biopsy. BJU Int 120(6): 774-781.
- Chun FK, de la Taille A, van Poppel H, Marberger M, Stenzl A, et al. (2009) Prostate cancer gene 3 (PCA3): development and internal validation of a novel biopsy nomogram. Eur Urol 56(4): 659-667.
- Lughezzani G, Lazzeri M, Larcher A, Lista G, Scattoni V, et al. (2012) Development and internal validation of a Prostate Health Index based nomogram for predicting prostate cancer at extended biopsy. J Urol 188(4): 1144-1150.
- Bul M, Zhu X, Valdagni R, Pickles T, Kakehi Y, et al. (2013) Active surveillance for low-risk prostate cancer worldwide: the PRIAS study. Eur Urol 63(4): 597-603.
- Hanley JA, McNeil BJ (1982) The meaning and use of the area under a receiver operating characteristic (ROC) curve. Radiology 143(1): 29-36.
- Finazzi S, Poole D, Luciani D, Cogo PE, Bertolini G (2011) Calibration belt for quality-of-care assessment based on dichotomous outcomes. PLoS One 6(2): e16110.
- Nattino G, Finazzi S, Bertolini G (2014) A new calibration test and a reappraisal of the calibration belt for the assessment of prediction models based on dichotomous outcomes. Stat Med 33(14): 2390-2407.
- Qin G, Hsu YS, Zhou XH (2006) New confidence intervals for the difference between two sensitivities at a fixed level of specificity. Stat Med 25(20): 3487-3502.
- Vickers AJ, Van Calster B, Steyerberg EW (2016) Net benefit approaches to the evaluation of prediction models, molecular markers, and diagnostic tests. BMJ 352: i6.
- Greene DJ, Elshafei A, Nyame YA, Kara O, Malkoc E, et al. (2016) External validation of a PCA-3-based nomogram for predicting prostate cancer and high-grade cancer on initial prostate biopsy. Prostate 76(11): 1019-1023.
- Lee SM, Liyanage SH, Wulaningsih W, Wolfe K, Carr T, et al. (2017) Toward an MRI-based nomogram for the prediction of transperineal prostate biopsy outcome: A physician and patient decision tool. Urol Oncol 35(11): 664.e11-664.e18.
- Zhu Y, Han CT, Zhang GM, Liu F, Ding Q, et al. (2015) Development and external validation of a prostate health index-based nomogram for predicting prostate cancer. Sci Rep. 5:15341.
- Tosoian JJ, Druskin SC, Andreas D, Mullane P, Chappidi M, et al. (2017) Prostate Health Index density improves detection of clinically significant prostate cancer. BJU Int 120(6): 793-798.
- Yilmaz H, Ciftci S, Yavuz U, Ustuner M, Saribacak A, et al. (2015) Percentage of free prostate-specific antigen (PSA) is a useful method in deciding to perform prostate biopsy with higher core numbers in patients with low PSA cut-off values. Kaohsiung J Med Sci 31(6): 315-319.
- Schröder F, Kattan MW (2008) The comparability of models for predicting the risk of a positive prostate biopsy with prostate-specific antigen alone: a systematic review. Eur Urol 54(2): 274-290.
- Brunelli A (2014) A synopsis of resampling techniques. J Thorac Dis 6(12): 1879-1882.
- Schiavina R, Borghesi M, Brunocilla E, Romagnoli D, Diazzi D, et al. (2015) The biopsy Gleason score 3+4 in a single core does not necessarily reflect an unfavourable pathological disease after radical prostatectomy in comparison with biopsy Gleason score 3+3: looking for larger selection criteria for active surveillance candidates. Prostate Cancer Prostatic Dis 18(3): 270-275.


