


Physical Evaluation of the Impact of Uses Computed Tomography and Positron Emission Tomography Image Fusion in Radiotherapy Treatment of Lung Cancer
AE Amin1, MS Hassan Talaat2*, SM ElSayed1and AM Hamed1
1Ain shams oncology center, Ain-shams University, Egypt.
2Physics Department, Ain-shams University, Egypt
Submission: May 01, 2016; Published: May 24, 2017
*Correspondence author: MS Hassan Talaat, Physics Department, Faculty of Science, Ain-shams University, Cairo, Egypt
How to cite this article: AE Amin, MS Hassan T, SM ElSayed1, AM Hamed. Physical Evaluation of the Impact of Uses Computed Tomography and Positron Emission Tomography Image Fusion in Radiotherapy Treatment of Lung Cancer. Canc Therapy & Oncol Int J. 2017; 5(2): 555659. DOI: 10.19080/CTOIJ.2017.05.555659
Abstract
Purpose: To validate a computed tomography (CT) and Positron Emission Tomography (PET) image fusion procedure and to evaluate its usefulness to facilitate tumor definition and physical assessment of treatment planning using dose volume histogram (DVH) in threedimensional conformal radiation therapy (3D-CRT) for lung cancer.
Methods and Materials: Eleven patients were assessed by CT and PET fusion images before radiotherapy. The patients were placed in the same position during CT and PET using TF TOF Philips 64 slices PET-CT machine. Matching was achieved by using XIO planning system software. 22 planning target volume (PTV) and plans were performed for all patients; 2 PTVs and plans for every patient. First PTV and plan were generated using CT images called PTVCT and CT plan respectively, the other PTV and plan generated using PET images called PTVPET and PET plan respectively. V20 of the lung, Esophagus mean dose, heart mean dose, conformity index (CI) and homogeneity index (HI) were calculated and compared for every patient.
Results: Fusion of anatomic and metabolic data decreased the target volume definition by exclusion of lung atelectasis or consolidation in 7 patients otherwise fusion increased the target volume by corrects staging of lymph nodes (N) for 4 patients. In these 7 patients, DVH revealed that the lung volume irradiated at 20 Gy (V ) was decreased; tumor volume irradiated at the 95% isodose (V95) was optimized. In other 4 patients V20 of the lung was increased due to target volume increased. Esophagus mean dose and heart mean dose changed according to how much target volume extended near to them. CI an HI calculated for PTVPET and exhibits very optimal results in compare with CT images.
Conclusion: We have validated CT and PET lung image fusion for accurate detection of lung cancer volumes, which improved the radiation treatment procedure of the lung.
Keywords: Positron Emission Tomography (PET); Computed Tomography (CT); Planning Target Volume of Computed Tomography (PTVCT); Planning Target Volume of Positron Emission Tomography (PTVPET); Three dimensional conformal radiation therapy (3DCRT); conformity index (CI); Homogeneity index (HI)
Introduction
3DCRT is used in many radiotherapy departments for a variety of tumor sites. Because it irradiates tumors while simultaneously sparing organs at risk (OARs) adjacent to the planning target volume (PTV) [1]. Using PET-CT image fusion rather than conventional CT images in the treatment planning of lung cancer, theatment planning system (TPS) has ability to make fusion between CT images and PET images which help us in target volume delineation as well as all (OARs). In patients with lung cancer, considered for radiation treatment, accurate assessment of hilar, mediastinal lymph node (LN) and atelectasis or consolidation involvement is of utmost importance.
The extent of the tumor will not only influence the treatment intention, i.e. curative or palliative, but also the volumes to be treated, therefore the dose to be expected. Indeed, several authors have suggested that a dose-volume effect for radio pneumonitis exists [2-5]. Different parameters, derived from dose-volume histograms (DVH's), have been correlated with the incidence of pneumonitis observed, e.g. V20 of the lung [2], and other complication of different OAR dose such as esophagus mean dose and mean heart dose. In recent years, PET-CT has been shown by several authors to improve the accuracy of mediastinal LN staging and exclusion of consolidation compared to CT alone [7-10]. In the present paper, the data from eleven patients are the basis for a theoretical study, where the impact of additional PET information on radiation treatment procedure. Vansteenkiste et al. [11] in their work had studied the exact localization of thoracic lymph nodes (LNs) on fluoro-2-deoxy-D- glucose positron emission tomography (FDG-PET). In non-small cell lung cancer (NSCLC) patients referred for loco regional LN staging, this study prospectively examined to what extent localization of LNs at PET reading could be improved by visual correlation with computed tomography (CT), or by PET+CT fusion images.
Fifty-six patients with potentially operable NSCLC underwent CT, PET and surgical staging. Prospective reading was performed for CT, PET without CT, PET+CT visual correlation (not fusion) and PET+CT fusion. Reading was blinded to surgical pathology data and note on a standard LN map. In the evaluation per individual LN station, CT was accurate in 87%, PET in 91% and visual correlation and fusion in 93%. They conclude that in the exact localization of metastatic thoracic LNs, the accuracy of reading of PET is increased if the PET images can be visually correlated with CT images. In a study of Erdi et al. [12] many patients with non-small cell lung cancer (NSCLC); Imaging with fluoro-2-deoxyglucose (FDG) PET in conjunction with CT, can improve the accuracy of lesion definition. In this study, they investigated the potential benefits of incorporating PET data into the conventional treatment planning of NSCLC. Case-by- case, they prospectively analyzed planning target volume (PTV) and lung toxicity. The PTV, along with the gross target volume (GTV) and all organs at risk, was first delineated using the CT data set.
Dose-volume histograms (DVHs) for lesion and normal organs were generated using both CT-based and PET/CT-based treatment plans. In seven out of 11 cases, they found an increase in PTV volume (average increase of 19%) to incorporate distant nodal disease. between these patients; the highest normal tissue complication probability (NTCP) for lung was 22% with combined PET/CT plan and 21% with CT plan. In other four patients PTV was decreased an average of 18%. The reduction of PTV in two of these patients was due to excluding atelectasis and removing the target volume to avoid delivering radiation doses to nearby spinal cord or heart. Jeffrey et al. [13] had performed a study to determine the impact of FDG-PET and CT on radiation therapy. Both the CT and fused PET/CT image data sets were transferred to the radiation treatment planning system for contouring. Each FDG-PET study was reviewed with the interpreting nuclear radiologist before contouring of target volume. The fused PET/CT images were used to develop the three-dimensional conformal radiation therapy (3DCRT) plan. Other physician, blinded to the results of PET, contoured the gross tumor volumes (GTV) and planning target volumes (PTV) from the CT images. The two 3DCRT plans for every patient were compared with respect to the GTV, PTV, mean lung dose, volume of health lung receiving > 20 Gy (V20), and mean esophageal dose. They conclude that increase in the target volumes led to increase in the mean lung dose, V20, and mean dose of esophageal. Decreases in the target volumes in the patients with atelectasis led to decreases in these normal-tissue toxicity parameters.
Materials and Methods

The current study included eleventh lung cancer patients. We selected patients from the treatment list of AIN SHAMS oncology center 2 year ago. In this study, patients who had lung cancer were divided into two groups according to their size of PTV in both CT images and PET images. Patients were distributed among these two groups according to the PTV-CT volume in cubic centimeter. One group has PTV-CT larger than PTV-PET in volume and represents 63.6% of all cases, the other has PTV-CT smaller than PTV-PET in volume and represents 36.4% of all cases. PET and CT images had 5 mm spacing over the entire treatment area "chest". Only two treatment volumes PTVCT, PTVPET and other OARs were defined, the PTV included ((GTV + CTV) "1 cm margin from GTV" + margin (1.5 cm whole around CTV for (PTV)). In this study, the OARs are Esophagus, Heart, both lungs minus PTV and Spinal cord, and we will perform two plans one plan focus with PTVCT as a target and called CT plan and the other plan focus with PTVPET and called PET plan. XIO® planning System (Elekta medical systems) was used in this study to perform the 3DCRT and in calculation process depends on the measurements of physical & geometrical data of ELEKTA Linear accelerator for both 6 & 15 MV photon energies. We are aiming in this study to detect the effect of change the target volume by trying 2 target volumes with the same plan. We used only the dose constrains of the QUANTIC [14]. The prescribed dose in this treatment course was 60 Gy by 2Gy/fraction, 6 weeks. Constrains of the treatment planning are shown in (Table 1) [6].
The dose volume histograms (DVHs) of both PTV and all OARs were calculated. DVH of the PTV, the D95 (the minimum absorbed dose that covers 95% of the volume of the PTV) was estimated. For Both Esophagus and Heart The mean dose were estimated. For both lungs volumes which receive less than 20 Gy was estimated. 'The concept of HI was developed as an extension of section-by section dosimetric proposed guidelines for routine evaluation of stereotactic radiotherapy (SRT) plans based on several parameters and HI was described as,
Where D2% represents the dose to 2% of PTV, D98% represents the dose to 98% of PTV and D50%represent the dose to 50% of PTV. The conformity index (CI) is defined as the ratio of the total volume receiving at least the prescription dose "Vp", to the target volume receiving at least the prescription dose "Vtp"CI=Vp/Vtp.

These dose values were used in the comparison of the two different treatment plans. In this study, the 6MV and 15MV have been used in plans. For each case, we perform 2 plans, Table 2 shows the size of target volume of these plans: As shown in Table 2 the 11 patients, which have been trials in this work, patients [1-7], have large PTVCT than PTVPET, Then the OARs in these cases are lower dose than in the last 4 cases because PET images decreases the target volume and also decrease dose to them. While plans [7-10] have small PTVCT than PTVPET, Then the OARs in these cases are larger dose than in first seven cases. These targets were performed with one treatment plan focus to cover PTVPET and called PET plan thus neglect PTVCT because PTVPET is most accurate metabolic target volume.
Results
In this study, each case has two plans, Both PTVCT and PTVPET are covered with 95% in both CT and PET plans regardless the target size. In this case PTVCT was larger than PTVPET and in case of PTVCT smaller than PTVPET. In conformal radiotherapy planning using CT plan dose distribution covered PTVCT; the un-coverage of PTVPET represents a serious issue in radiotherapy planning as we pointed out the PTVCT is fully covered by 95%, while PTVPET is not covered by that level. The un-coverage of PTVPET may lead to treatment failure.

Dose volume histograms (DVH’s) were calculated and generated based on 3D reconstructed images for PTV and all OARs in all treatment plans. All plans fulfilled dose volume constrains and verified by using DVHs according to "ICRU 83". In all PET plan, the auto contoured Lung minus PTVPET defines as (Lung PET) fulfilled constraint and the volume of lung PET received 20 Gy is less than 30% of total Lung PET volume (QUANTIC, 2010) [14] in all PET plan (Figure 1). Shows the lung V20 for all 11 cases, each case have 2 plans one “black columns" defined lung dose on CT plan and other "gray color" defined lung dose in PET plans. We notice that is the first seven cases opposite in comparison to last four cases in lung PET dose through both CT plan and PET plan. The first seven cases have PTVCT larger than PTVPET in volume therefore; CT plan will have been larger irradiation area then, lung PET in CT plan will be larger than lung PET in PET plan “gray color".
On the other hand, the last four cases have PTVCT smaller than PTVPET then, smaller irradiation area so, and lung PET in PET plan will be larger than lung PET in CT plan. The applied dose volume constrains of esophagus according to (QUANTIC, 2010) [14] were: The mean dose ≤ 30 Gy. In this work we notice that dose to esophagus may be increased in the plan based on CT images (CT plan) “black color" more than that in plans based on PET images (PET plan) “gray color". The reason of that is the dependency of the esophagus dose, the position of the “target volume" regarding to the whole volume of esophagus. If the PTV is in the peripheral side of the lung will be lower than that in cases with PTV in the middle of the lung. Usually PET plan using PET images changes the target volume to include hilar or medistineal positive lymph node (i.e. size of target volume increased), this cause the large mass of target is to be close to the esophagus, and accordingly increases of its dose.


On the other hand, the esophagus dose may be decreases by doing CT plan more than PET plan, due to the position of the PTV, which is far from esophagus. Figure 2 shows the comparison between the CT plan “Black color" and PET plan “gray color" regarding to esophagus mean dose for 11 patients. Heart dose volume constrains applied in this study are: Mean dose of heart ≤ 26 Gy (QUANTIC, 2010) [14]. Figure 3 shows a comparison between heart in CT plans and PET plans, which have been done for 11 patients. In the first 6 cases the mean heart dose in PTVCT plans "black color" is higher than that in PTVPET "gray color" and we got exactly the opposite in the other 5 cases. Now we notice that is when, PTVCT is larger than PTVPET the heart dose in CT plan “black color" will be more than in PET plan “gray color" and vice versa.
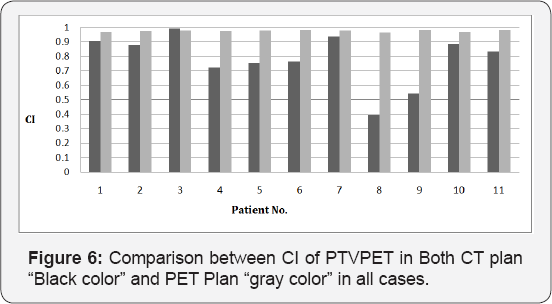
Figure 4 shows PTVPET in PET plans "gray columns" has HI values less than PTVCT in PET plan "black columns". CI generally used to indicate the portion of prescription dose that delivered inside the PTV. CI of one indicates that 100% of prescribed dose delivered to the PTV and no dose delivered to adjacent tissue, CI value is always close to value of one in most clinical cases. Lower CI values indicate poorer dose conformity to the PTV. Figure 5 represents CI of PTVPET in both CT plan "black columns" and in PET plan “gray columns". we can notice that in all plans, the CI values of PTVPET in PET plan "gray color" is almost value of one and this means that PTVPET in PET plan have good conformity. On the other hand, in all plans CI values of PTVPET in CT plan have a lower values so, PTVPET in CT plan have poor conformity than PTVPET in PET plan, which is not accepted.


Discussion
The use of FDG-PET examinations in the assessment of lung cancer is increasingly included in new research. Various studies have addressed the value of PET in change the target volume. Little is known about PET and its accuracy with respect to size and shape of the primary tumor. The literature available hints that the size may be depicted quite accurately compared to CT images, especially when using the attenuation-corrected mode of operation, as done in this study. However, due to the increased uptake of FDG the size of the tumor itself may be rather over than underestimated. For lung cancer, Erdi et al. [12] and Jeffrey et al. [13] Found The PTV, along with the gross target volume (GTV) and all organs at risk, was first delineated using the CT data set, Dose-volume histograms (DVHs) for tumor and normal organs were generated using both CT-based and PET/CT-based treatment plans. In seven out of 11 cases, they found an increase in PTV volume (average increase of 19%) to incorporate distant nodal disease. between these patients; the highest normal tissue complication probability (NTCP) for lung was 22% with combined PET/CT plan and 21% with CT plan. In other four patients PTV was decreased an average of 18% and these results agree with our results in changing in target volume. Therefore, we decided to change the concept of including the atelectasis or consolidation, lymph nodes. However, following this concept, the information given by PET still added considerably to the information provided by CT, leading to substantial changes, mainly the reduction of the size of the treatment volume and also to increase the target volume.
In the group of patients with consolidation or atelectasis, the contribution of the PET scan led to a significantly higher rate of field changes compared to the other cases. Mostly, the field sizes were reduced because PET images excluded non-metabolic active cells leading to reduce the target volume. This finding may be explained by the fact that the margins between tumor and atelectasis cannot be drawn clearly using the morphological information provided by CT alone. Due to this uncertainty, larger planning target volumes may be defined including larger volumes of healthy lung tissue, esophagus tissue and heart. In treatment with conventional fractionation, as applied in about half of the patients of the present study, a monitoring for an eventual reopening of the atelectasis with resulting changes in the target volume may be feasible, and may help in preserving healthy lung tissue. Therefore, a reduction of the volume of healthy lung irradiated from the beginning of radiotherapy appears especially important in these cases.
Otherwise PET helps patients have positive lymph nodes, the target volume were increased due to inclusion of them; thus organs at risk dose increases but with high tumor control probability than in CT planning only. It is reasonable to assume that the impact of PET in 3D treatment planning would be even greater, considering the size of the target volume in itself. The impact of PET might also be greater, if, instead of mere visual comparison, image fusion were used for matching PET and CT data. While we are currently working on these aspects, the results obtained until now show clearly that in using PET in the treatment planning for radiotherapy of lung cancer, a substantial reduction in the amount of healthy lung irradiated can be expected.
Conclusion
This study investigated the integration of CT and PET image data during curative 3D treatment planning radiotherapy for patients with lung cancer. The functional PET studies appear to complement CT information and hopefully will result in improved treatment plans by changing the tumor volume to exclude atelectasis or consolidation and include any positive lymph node and improve target coverage, TCP and keep all organs at risk away from any toxicity or complication.


