




 CTBEB Home



Abstract
Autism Spectrum Disorder (ASD), an intricate neurocognitive condition that impacts a significant number of Indians, estimated to range from 1 in every 250 to 1 in every 500 individuals, with prevalence figures subject to variations due to factors like underdiagnosis and regional differences. ASD manifests as a spectrum of presentations, encompassing a diverse range of symptoms and challenges. Individuals with autism commonly encounter difficulties in social interactions and communication, including challenges in understanding social cues and forming relationships. The classification of low-functioning and high-functioning autism faces challenges due to the dynamic nature of the spectrum, behavioural variability, and the subjective nature of clinical evaluations. This study explores the cognitive differences between low-functioning (LF) and high-functioning (HF) individuals with ASD during arithmetic tasks using EEG. Preprocessing of EEG signals involved artifact removal and band separation, focusing on the beta band associated with cognitive activities. Transfer entropy analysis was employed to investigate connectivity among different brain regions. The findings aim to contribute to a nuanced understanding of ASD, offering insights into specific aberrations in information processing. This research holds potential for the development of objective biomarkers and tailored therapeutic interventions aligned with the observed connectivity profiles in individuals on the autism spectrum. The study underscores the importance of considering neurobiological, cognitive, and social-emotional factors for designing effective interventions, particularly for those on the lower-functioning end of the autism spectrum.
Keywords:Autism, Low-functioning (LF) and High-functioning (HF) Autism Spectrum Disorder(ASD), EEG, Spectral Power, Transfer Entropy
Introduction
Autism Spectrum Disorder (ASD) is characterized by a diverse range of symptoms and challenges, forming a spectrum of presentations. Individuals with autism often face difficulties in social interactions and communication, such as challenges in understanding social cues, establishing relationships, and exhibiting atypical communication patterns [1]. Repetitive behaviors, intense interests in specific topics, and sensory sensitivities are common traits that can be observed in Autistic individuals. In addition to this, individuals with autism may struggle to cope up with changes in general or in particular routines. Autistic individuals demonstrate varying levels of intellectual capabilities, ranging from intellectual disability to exceptional intelligence. Early intervention and continuous support recognizing and addressing their unique strengths and challenges are crucial in enhancing the quality of life for autistic individuals [2].
The diagnosis of autism spectrum disorder (ASD) involves a comprehensive approach integrating various methods to capture the complexity of the condition. Standardized observational assessments, such as the Autism Diagnostic Observation Schedule [3] (ADOS), are widely employed to systematically observe and evaluate an individual’s social and communication behaviours. Additionally, structured interviews like the Autism Diagnostic Interview-Revised (ADI-R) gather information from parents or caregivers about the individual’s developmental history. Early detection is facilitated by developmental screening tools like the Modified Checklist for Autism in Toddlers (MCHAT), particularly in toddlers and young children [4]. Clinical interviews, psychological testing that assess cognitive and adaptive skills, and medical evaluations such as genetic testing and neuroimaging (MRI, CT scans), add up to a comprehensive diagnostic evaluation. However, the challenges that arise in diagnosing autism is numerous due to the heterogeneity of symptoms across the spectrum which makes it challenging to establish a one-size-fits-all diagnostic criteria [1]. Late onset of diagnosis, the presence of co-occurring conditions, cultural and linguistic variations in interpretation, gender biases, limited access to specialized services, and the evolving nature of diagnostic criteria present additional complexities. Addressing these challenges requires continual research, increased awareness, and enhanced training for healthcare professionals to ensure accurate and timely diagnoses. Such efforts are vital for facilitating access to tailored interventions and support, ultimately improving the outcomes and quality of life for individuals with autism.
Autistic children are often classified as high-functioning (HF) or low-functioning (LF) based on their intellectual and developmental abilities, with “high-functioning” typically referring to those with average or above-average cognitive skills (intelligent quotient (IQ) score is above 80), and “lowfunctioning” (IQ score is less than 80) referring to those who may have significant intellectual or developmental challenges [5]. HF and LF children are affected with disabilities related to language and intellectual skills whereas HF are with good vocabulary and better language skills [6]. The classification of low-functioning and high functioning autism within the diagnostic framework encounters inherent challenges stemming from the diverse and dynamic nature of the autism spectrum. Behavioural variability among individuals poses a substantial hurdle, as those with low functioning autism often exhibit more overt challenges in communication and social interaction, while high functioning individuals may employ coping mechanisms that mask their difficulties [1]. The reliance on traditional criteria, including intellectual functioning, becomes problematic, as some high functioning individuals may possess average or above-average intelligence but struggle with adaptive skills. Language and communication difficulties, subjectivity in clinical evaluations, and the presence of co-occurring conditions further complicate the distinction between low and high functioning. The evolving nature of autism presentations over time also undermines static categorizations. As awareness grows, there is an increasing call for a more nuanced, person-centered understanding of autism that considers individual strengths, weaknesses, and support needs rather than relying on a rigid dichotomy of functioning levels.
Electroencephalography (EEG) holds significant importance in the diagnosis of autism spectrum disorder (ASD) due to its ability to provide valuable insights into the neural activity and functioning of individuals with ASD [7]. EEG measures the electrical activity in the brain, allowing clinicians to identify patterns and abnormalities in real time. In the context of autism, EEG can detect specific neural signatures associated with the disorder, such as altered connectivity and irregularities in brain wave patterns. This non-invasive and relatively accessible neuroimaging tool aids in the early detection and characterization of neurological differences in individuals with ASD, contributing to a more comprehensive diagnostic profile. Additionally, EEG can assist in understanding the underlying neurobiological mechanisms of autism, paving the way for targeted interventions and personalized treatment approaches. While EEG alone may not serve as a definitive diagnostic tool for autism, its integration into the diagnostic process enhances the overall understanding of the neurological aspects of the disorder, facilitating more accurate and nuanced diagnoses, and informing tailored intervention strategies [8]. This study aims at bridging the gap between taskbased EEG and TE analysis of connectivity patterns in LF and HF individuals. Specifically, we examine cognitive processing under arithmetic tasks as mathematical reasoning is dependent on well-described neural networks that include occipital and frontoparietal regions. By exploring TE-based connectivity in these individuals, we expect to find new biomarkers for the enhanced classification of individuals diagnosed with ASD, hence paving the way for personalized intervention approaches.
Conducting connectivity analysis in the study of autism spectrum disorders (ASD) is imperative for delving into the complexity and variability inherent in the disorder. ASD exhibits a broad spectrum of phenotypes, and connectivity analysis aids in identifying commonalities and distinctions in neural circuitry among individuals with ASD, contributing to a more nuanced understanding of the diverse manifestations within the spectrum [9]. The dynamic nature of neural networks is particularly relevant to ASD, and advanced neuroimaging techniques like functional magnetic resonance imaging (fMRI) and electroencephalography (EEG) allow researchers to explore temporal dynamics. Uncovering atypical connectivity patterns in individuals with ASD provides insights into the neural mechanisms underlying core symptoms, including impaired social interaction and communication difficulties [10]. This knowledge is not only essential for early detection and intervention but also informs the development of targeted therapeutic strategies, paving the way for more personalized and effective interventions tailored to the specific connectivity disruptions observed in individuals with ASD. In essence, connectivity analysis serves as a crucial tool for unravelling the intricacies of neural connectivity in ASD, offering a comprehensive understanding that can guide both research and clinical approaches [11].
Several studies have explored the application of transfer entropy in connectivity analysis to unravel the neurobiological underpinnings of autism spectrum disorders (ASD). Transfer entropy, a measure derived from information theory, quantifies the directed flow of information between variables, making it particularly valuable for investigating dynamic interactions in neural networks. [12]: This early work applied transfer entropy to electroencephalography (EEG) data from individuals with ASD. The study demonstrated altered patterns of information flow in the brains of individuals with ASD, suggesting disruptions in functional connectivity.[13]: A study employing transfer entropy in functional magnetic resonance imaging (fMRI) data found differences in directed connectivity between brain regions in individuals with ASD compared to typically developing individuals. This research contributed to the understanding of information transfer abnormalities in the context of ASD. [14]: Using magnetoencephalography (MEG) data, this study investigated effective connectivity in children with ASD.
Transfer entropy analysis revealed altered directional influences between brain regions implicated in social processing, shedding light on the neural mechanisms associated with social communication deficits in ASD [15]. More recent studies utilized transfer entropy to analyze functional connectivity in a large sample of individuals [16,17]. This research embarks on a novel journey by employing Transfer Entropy (TE) as a lens to scrutinize the dynamic information flow within the brains of individuals with ASD. TE, rooted in information theory, provides a unique framework to capture directed interactions between neural elements, shedding light on the causal relationships that shape the complex dynamics of the autistic brain. The rationale behind adopting TE lies in its ability to unearth directed influences, offering insights into the temporal dynamics of information transfer between brain regions. By leveraging this approach, the details of how information is exchanged within neural networks in individuals with ASD compared to neurotypical controls is been studied. The research highlighted both global and local alterations in information transfer, emphasizing the potential of transfer entropy in uncovering specific network-level disruptions associated with ASD. These studies collectively suggest that transfer entropy is a promising tool for unravelling the intricate connectivity patterns in the brains of individuals with ASD. The application of this measure to various neuroimaging modalities has provided valuable insights into the dynamic interactions within neural networks, contributing to our understanding of the neurobiological basis of ASD. Researchers continue to refine and expand upon these methodologies to enhance the specificity and clinical relevance of connectivity analyses in the context of autism [18].
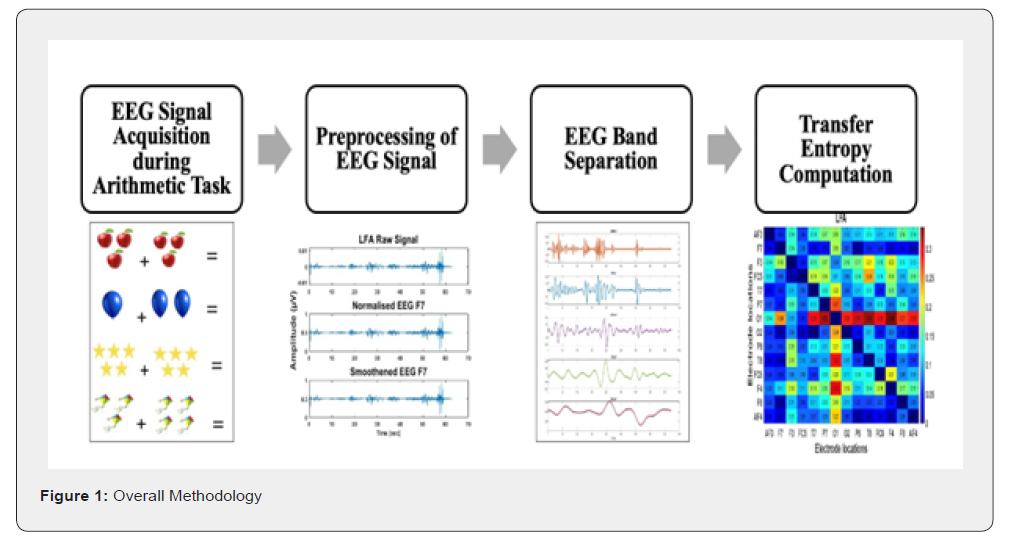
Building upon prior research that has highlighted disruptions in functional connectivity associated with ASD, our study seeks to elucidate not only the presence of alterations but also the directional patterns of information flow. This exploration is critical for advancing the understanding of the neural underpinnings of ASD, potentially paving the way for more targeted interventions and personalized treatment strategies. Current autism diagnosis is subjective and behaviour-dependent, requiring input from multiple specialists, which leads to longer decision-making times. Early diagnosis is challenging due to overlapping symptoms with other conditions and a lack of reliable, easy-to-use criteria. Behaviourindependent methods, like EEG, offer a simpler, costeffective alternative for diagnosing autism [19]. Despite existing literature on deriving EEG based quantifiable signatures and machine learning methods for differentiating HF and LF, this work aims to use task-based EEG data to explore the connectivity (information flow) between different regions of the brain while executing the task (HF and LF) as it is not explored very well by the researchers. Through a comprehensive analysis of transfer entropy in different brain regions related to ASD, this study aims to identify specific changes in how information is processed [20]. This research holds promise for not only enhancing the theoretical understanding of ASD but also focussed on the development of objective biomarkers and therapeutic interventions tailored to the unique connectivity profiles observed in individuals on the autism spectrum. Figure. 1 shows the overall methodology of the study.
Materials And Methods
Participant selection and experiment
Children from the Vidya Sudha Special School in Chennai participated in the study, which followed ethical guidelines approved by the Sri Ramachandra Institute of Higher Education and Research Ethics Committee (IEC-NI/18/SEP/66/61). An initial evaluation using standard techniques was conducted by a clinical psychologist on thirty test individuals. DSM-V and INCLENASD criteria were used for ASD diagnosis and WISC-IV/BSID-III was used to measure Intelligent quotient (IQ) and development quotient (DQ). Severity of symptoms was determined by means of Childhood Autism Rating Scale-2 (CARS-2). The key criteria for screening included the following: age, gender, handedness, language exposure, and mother tongue.
EEG Signal Acquisition
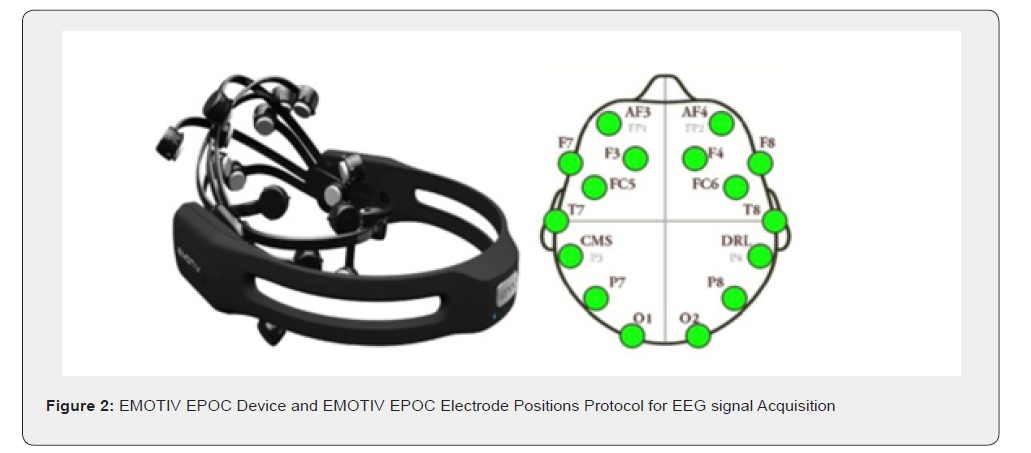
EEG data was collected from the subjects using the Emotiv Epoc, a wireless EEG device with 14 channels, following the standard 10-20 electrode placement. Electrodes chosen for recording were prefrontal regions (AF3, AF4), frontocentral regions (FC5 and FC6), frontal regions (F3, F7, F4, F8), temporal regions (T7& T8), parietal regions (P7&P8) and occipital regions (O1&O2) [21]. The Emotiv system was chosen for its child-friendly design and adaptable structure, allowing for comprehensive brain measurements. Sampling frequency of the device was set to 128 Hz. The voltage reference of the emotive recording set up was P3 and P4. Extractable frequency range set in the device was from 0.2 to 45 Hz. Figure. 2 represents the EMOTIV EPOC device and its 14-electrode placement system.
Addition and subtraction are examples of arithmetic problems that involve key cognitive functions such as fact retrieval, associative memory, attention, sequencing, memory working, and problem-making.
Hence, at the task, several cognitive functions were activated
by the participants:
• Attention – concentrating on numerical values and
proceeding with steps of problem solving.
• Working Memory – Retaining and manipulating numbers
to arrive at computation of results.
• Problem-Solving – Issue presentation, information
identification needed, and application of mathematical principles.
• Mathematical Reasoning – Using logic and deduction in
arriving at solutions.
• Metacognition – evaluating and modifying problemsolving
strategies as needed (Cowan, 2014).
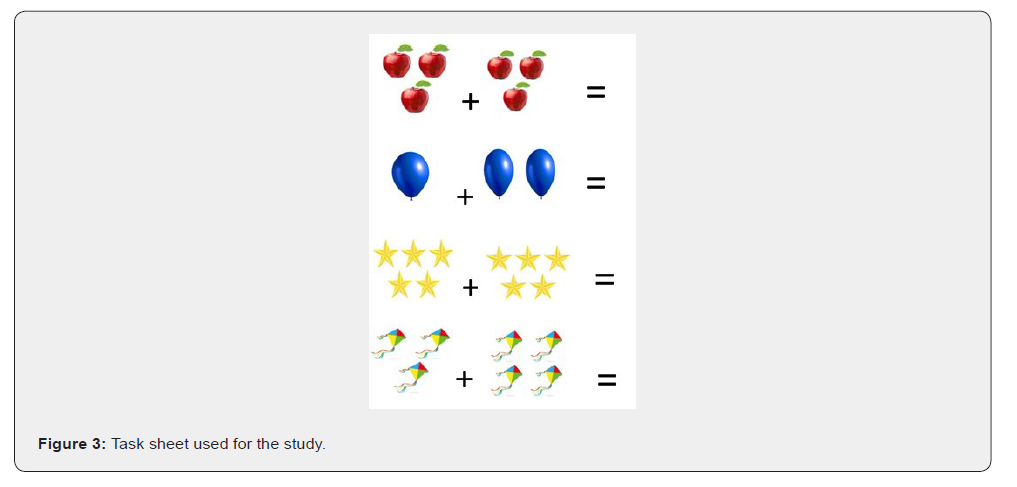
Figure. 3 shows the task sheet used for this work representing the arithmetic operations in pictorial manner (3apples+ 3apples=, 1ballon+2ballon=, 5stars+5stars=, 3kites+4kites=). Through this task sheet the above mentioned cognitive functions were activated for the participants.
Generally, attention allows individuals to focus on relevant information to execute a task. Attention is also crucially important to focus on numerical values, symbols, and the appropriate steps involved in determining the solution to a problem. Working memory indicates the space where ideas are temporarily stored and retrieved. In the context of arithmetic tasks, working memory is important in identifying and manipulating numbers, doing calculations, and arriving at intermediate results. Problemsolving skills are essential for performing arithmetic task. Participants must understand the problem, find the necessary information required, and adapt the essential steps to find the solution. Cognitive processes like logical reasoning, deduction, and induction play a role understanding the problem, applying appropriate mathematical principles, and reaching a logical solution. In arithmetic tasks, metacognitive skills which is the ability to monitor and regulate one’s cognitive processes are taken into consideration for the self-assessment part of our diagnostics, evaluating the reasonableness of results, and adjusting problemsolving strategies if required.
EEG signal preprocessing
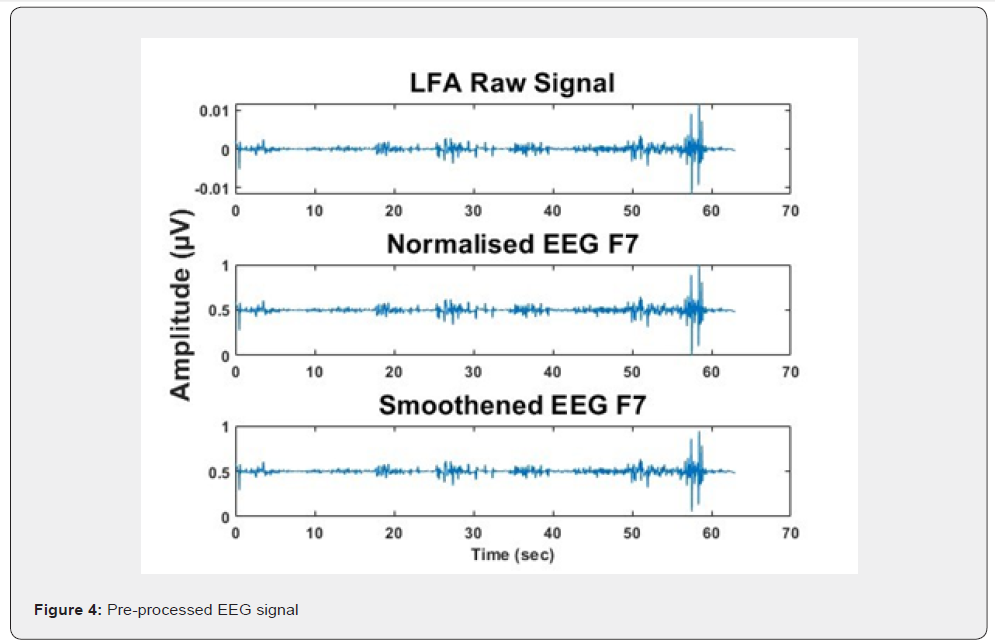
A 5th-order IIR Bandpass Chebyshev filter was used to isolate signals between 0.5 and 44 Hz. Subsequently, independent component analysis (ICA) was used to eliminate artifacts from eye blinks and movements [21]. The EEG signals were decomposed into independent components, and only those correlating with cerebral sources were retained, discarding components related to artifact sources. Independent component analysis (ICA) was included to remove the unwanted information from EEG signal which includes eye blinks and artefacts related to movements [22]. The signals were split into independent components using ICA. The components relating with brain activities were preserved and those that relates with noise (same characteristics over all the channels) were discarded. After ICA step the signals are filtered using smoothing filter with moving average technique. Figure 4 shows the normalized and smoothened EEG signal of representative F7 electrode.
Summarization of Preprocessing steps:
• DC Offset and Baseline Removal – To remove slow drift
effects.
• Frequency Band Segmentation – EEG signals were
segmented into Delta (0.5–4 Hz), Theta (4– 8 Hz), Alpha (8–13
Hz), Beta (13–30 Hz), and Gamma (30–44 Hz) bands (Sandhya et
al.2018).
Power spectrum:

Absolute spectral power:
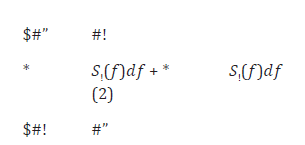
where, Sx(f) – PSD
• Normalization – Min-max normalization was used to normalize the data range [21].
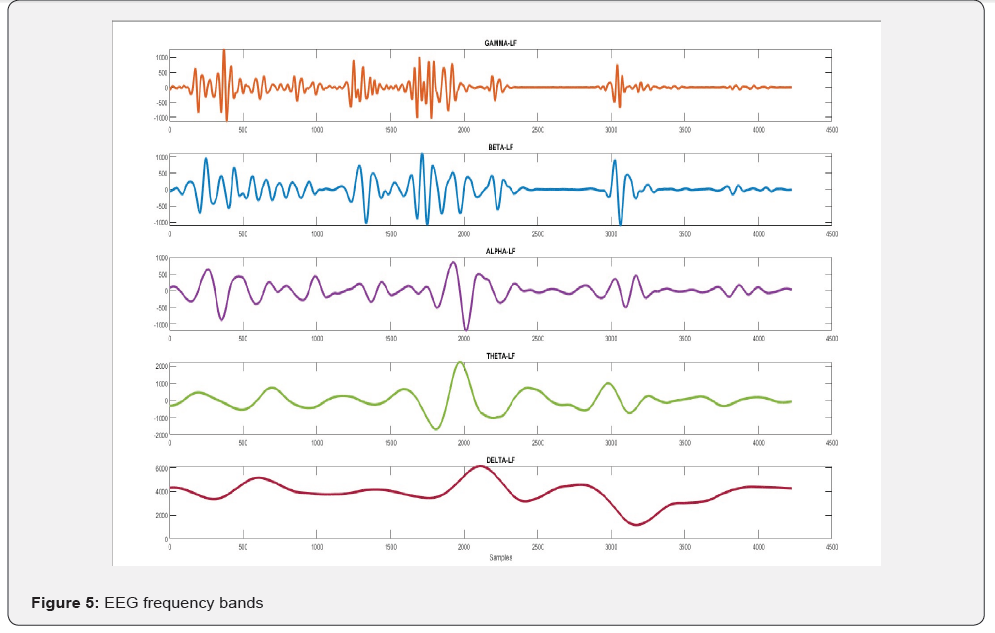
Figure. 5 shows the segmented EEG bands for the given task. Beta-band oscillations (13–30 Hz) are highly linked with working memory, decision-making, and cognitive processing. A correlation has been shown in studies between beta activity and mathematical problem-solving skills (Van Bueren et al., 2022). It has been evidenced that beta-band activity is central to numerical reasoning, neural synchronization, and attention control and, therefore, is highly pertinent for comparing ASD-related cognitive differences. For these reasons, the beta band was selected as the focus of principal connectivity analysis. The HERMES package (https://hermes.med.ucm.es/) was employed to calculate Transfer Entropy (TE) since it is particularly geared toward timeseries analysis, synchronization measures, and EEG connectivity visualization. While MATLAB and Python also provide means for alternative TE calculation, the selection was based on optimized algorithms and specifically tailored EEG analysis environment of HERMES. EEG recordings were performed in DC mode with 128 Hz sampling, using the 14-channel Emotiv Epoc system to acquire data.
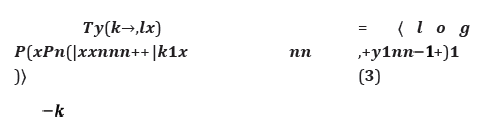
Transfer Entropy analysis Transfer Entropy (TE) is a statistic of the flow of information between time series and hence can be used to analyze functional connectivity in EEG. In simpler terms, TE measures how well the previous data from one brain region predict future states from another region and can differentiate between causal interactions and correlation.
By employing transfer entropy, researchers can discern the directionality of information exchange among EEG signals originating from different areas of the brain. This capability is pivotal in elucidating functional connectivity patterns within the brain, identifying regions responsible for guiding or modulating the activity of other brain regions. Through the calculation of transfer entropies across multiple EEG channels connecting diverse brain regions, researchers can generate maps illustrating the strength and directionality of information flow. This mapping process facilitates a clearer comprehension of brain network dynamics and aids in pinpointing key hubs within these networks [23].
Results
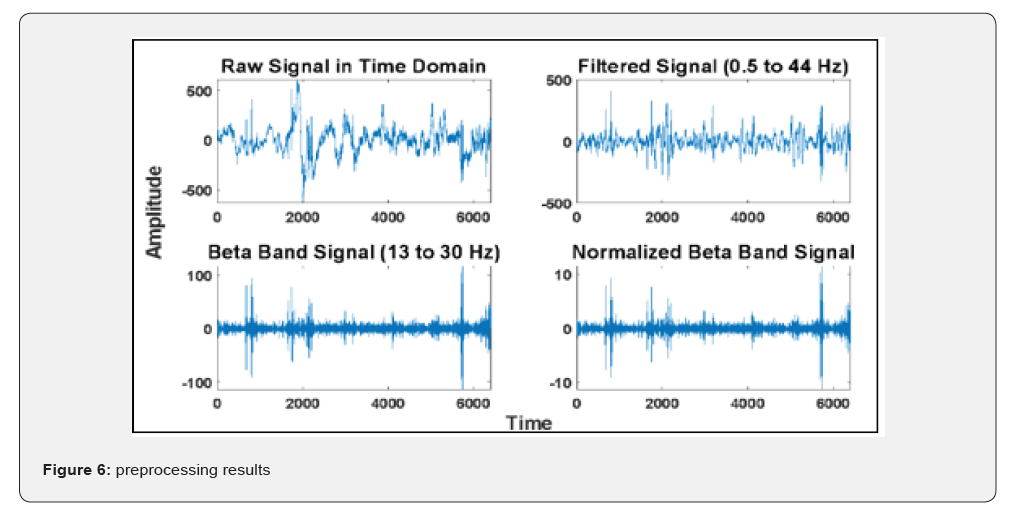
Figure. 6 represents the pre-processing steps of EEG signals. The raw EEG signal which is acquired from EMOTIV EPOC is filtered for further analysis. The acquired EEG signals were filtered between 0.5 and 44 Hz using a Chebyshev bandpass filter of order 5 to remove noise and artifacts. Since EMOTIV EPOC is a wireless device artifacts due to head and eye movements has to be removed which is also a major preprocessing step. The artifacts due to eye and head movements are removed using Independent Component Analysis (ICA). After ICA step the signals are filtered using smoothing filter. This filtered signal is further subdivided into the EEG sub frequencies into delta(0.5-3Hz), theta(4-8Hz), alpha(812Hz), beta(13-30Hz) and gamma(>30Hz) using the bandpass filter. The extracted beta band (13–30 Hz) was then further normalized for Transfer Entropy (TE) analysis as Beta-band frequencies (13–30 Hz) are highly related to working memory, decision-making, and cognitive processing.
Figure. 7 shows the Power Spectral Density (PSD) of the beta band, which reflects the distribution of power across frequencies. High PSD values are associated with increased cognitive ability, concentration, and mental alertness, whereas lower values reflect relaxed or idle conditions. PSD analysis offers insight into neural activity during arithmetic operations and assists in the validation of beta-band selection for subsequent connectivity analysis. It’s commonly used to analyse brainwave patterns during different cognitive tasks or mental states. From PSD analysis it has been observed that high PSD values were obtained for occipital electrodes for LFA children. Similarly, it has also been observed that high PSD values were obtained for frontal and temporal electrodes for HFA children.
Low-Functioning Asd Group Findings
LF individuals demonstrate several notable differences in brain connectivity and activation during numerical processing tasks:
Localized Connectivity Patterns
LF individuals show more localized and right-lateralized connectivity, a typical reverse pattern for numerical thinking. Neurotypical individuals mainly use the left hemisphere for logical and linguistic tasks; however, LF participants use more of the right hemisphere, which might be the result of a compensatory strategy because of the cognitive impairments. The study found a unique positive relationship between arithmetic skills and gray matter volume in the left inferior frontal gyrus (IFG) and middle temporal gyrus (MTG). The corresponding Brodmann region for left inferior frontal gyrus are area 44 and area 4. Similarly Brodmann region corresponding to middle temporal gyrus are area 22 and area 37.
These findings suggest that increased gray matter volume in these left fronto-temporal regions is associated with better arithmetic performance.
The study has shown that, compared with HF individuals, LF individuals more widely recruit the right hemisphere, a pattern that would seem to reflect their difficulties in these processing areas. This is indicative of an unusual lateralization such that numerical processing tasks that are usually mediated by the left hemisphere in neurotypicals are instead more rightlateralized. This lateralization may indicate that compensatory neurophysiologic mechanisms develop to allow function to bypass the damaged conventional cerebral regions.). This is also in line with previous research examining lateralization in ASD [24]. This may be due to the dependence on spatial and visual processing abilities usually more right hemisphere dominant.
Heightened Occipital Activation
LF test individuals exhibit dramatically higher occipital lobe activity mainly the secondary visual cortex is more activated during the given task, which would indicate an overdependence on visual processing strategies to solve arithmetic problems. Figure. 8 shows the Transfer entropy connectivity matrix for low functioning autistic group.
The corresponding Brodmann region to the active occipital lobe is area 18 (middle occipital gyrus-secondary visual cortex). This might be explained by cognitive impairments in executive function and working memory. [25] findings confirm the notion that ASD participants tend to compensate for impaired memory through augmentation of visual processing. Figure 8 visually supports these observations. Figure 8 shows directional connectivity for inter hemispheric electrodes which has been estimated using transfer entropy for LFA group during arithmetic task. Figure. 9 is represented in axial view of the brain. The electrodes are represented according to the Brodmann brain areas. Frontal electrodes-AF3-6L, AF4-6R, F7-47L, F8-47R, F3- 8L, F4-8R, Fronto-central electrodes-FC5-45L, FC645R, temporal electrodes -T7-22L, T8-22R, P7-37L, P8-37R, Occipital electrodes- O1-18L, O2-18R. The scale ranges from blue to maroon color. The maroon color indicates the higher connectivity from source to destination electrode whereas the blue color indicates the lesser connectivity. The brain regions with no connectivity below the threshold level will not be considered for analysis. From Figure.9 it is clearly visible that occipital lobes were active for low functioning autism group during the given arithmetic task
High-Functioning Asd Group Findings
HF individuals, while demonstrating more typical connectivity patterns for numerical cognition, also exhibited unique features that revealed both the strengths and vulnerabilities in their neural processing:
Distributed Connectivity Patterns
Unlike LF participants, HF participants have greater distributed and bilateral connectivity that indicates equitable neural involvement. This reflects greater facilitation of communication among brain regions, a characteristic most often linked with greater cognitive flexibility and improved problem-solving capacity [26]. Compared to LF participants, HF participants activate both hemispheres in a manner very similar to neurotypical functioning.
Frontal and Temporal Activation
HF individuals exhibit heightened connectivity in the frontal and temporal lobes—areas associated with executive function, problem-solving, and information integration [27]. Heightened frontal activation (e.g., FC5, F7) facilitates adaptability and cognitive control, while temporal activation (e.g., T8) specifies enhanced language processing and numerical reasoning. These results are aligned with [28], who found more typical neural activation in HF individuals. Figure10 illustrates these connectivity patterns, providing a visual representation of the neural dynamics in HF individuals.
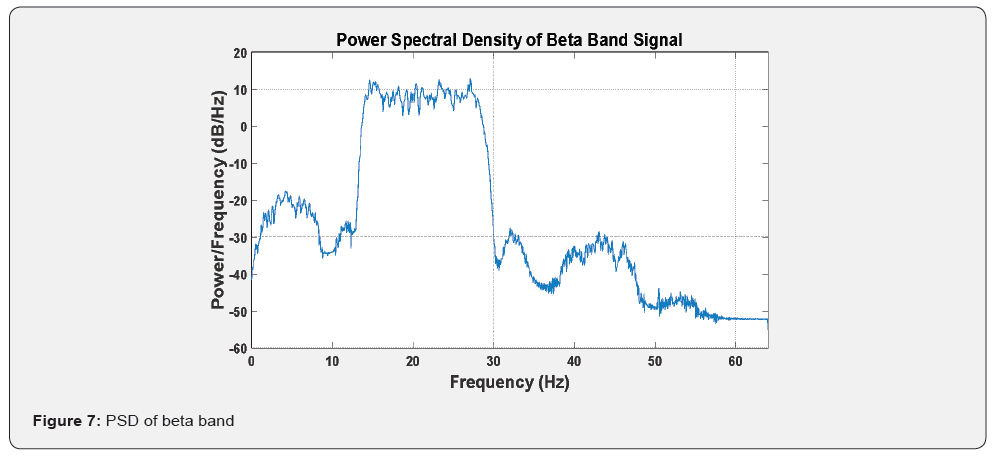
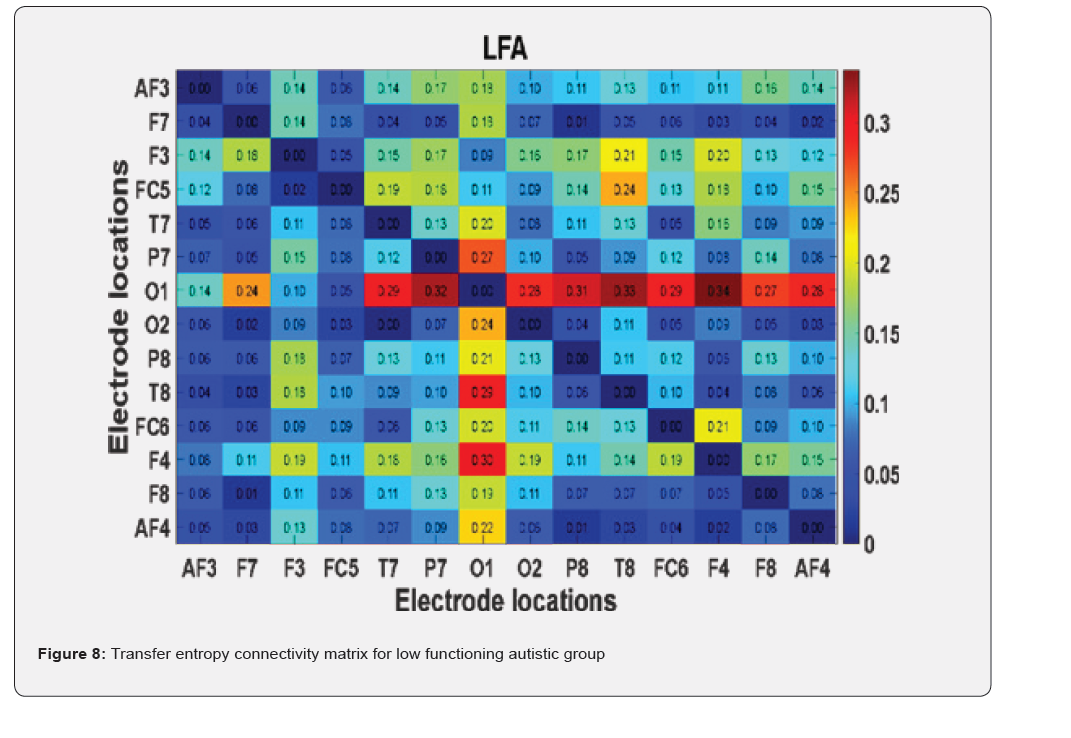
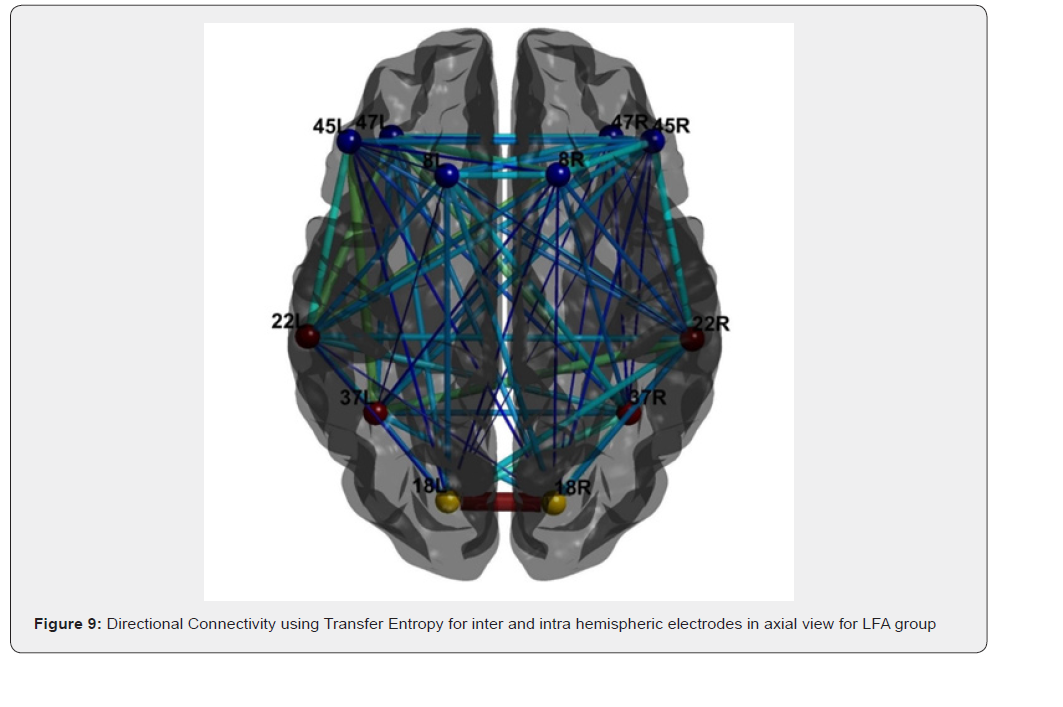

Figure10 shows directional connectivity for inter hemispheric electrodes which has been estimated using transfer entropy for HFA group during arithmetic task. Figure. 11 is represented in axial view of the brain. The electrodes are represented according to the Brodmann brain areas. Frontal electrodes- AF3-6L, AF4- 6R, F7-47L, F8-47R, F3-8L, F4-8R, Fronto-central electrodes- FC5-45L, FC645R, temporal electrodes -T7-22L, T8-22R, P7-37L, P8-37R, occipital electrodes- O1-18L, O2-18R. The scale ranges from blue to maroon color. The maroon color indicates the higher connectivity from source to destination electrode whereas the blue color indicates the lesser connectivity. The brain regions with no connectivity below the threshold level will not be considered for analysis. From Figure.11 it is clearly visible that frontal and temporal lobes were active for high functioning autism group during the given arithmetic task.
Autism Spectrum Disorder (ASD) individuals display unique brain activation patterns for solving arithmetic problems, with significant differences between low-functioning (LF) and highfunctioning (HF) individuals. Heterogeneity of ASD is the reason behind cognitive differences, with LF individuals having more difficulties in attention, memory, and executive function, and resulting in compensatory neural processing strategies.
Atypical lateralization
Lateralization is defined as the brain hemisphere functional specialization. Numerical processing in neurotypical persons is mostly a left-hemisphere activation process, especially within areas associated with language and reasoning. Evidence has indicated that LF persons show increased right-hemispheric involvement, suggesting that numerical processing in these individuals has atypical lateralization.
This deviation can be due to compensatory processes because of difficulties in left-hemisphere functioning, so LF individuals tend to use spatial and visual processing skills-usually controlled by the right hemisphere. Research like [24] has already reported such compensatory changes in ASD individuals. Variability in neurobiological factors, sensory sensitivities, and executive function deficits can also affect these abnormal processing patterns. More research is needed to identify whether rightlateralized numerical calculation in LF individuals is an enduring feature or an adaptive mechanism that develops over time and with intervention. Identification of these mechanisms could inform the development of targeted treatments that strengthen left-hemispheric activity for enhanced arithmetic ability.
Sensory Sensitivities and Cognitive Load
LF participants showed heightened sensitivity to visual information, which can be a source of distraction and cognitive overload. Greater attention to visual information makes it difficult to filter out irrelevant information, leading to slower problemsolving and higher rates of error on arithmetic problems. This over-visual focus is a known characteristic of ASD and may be the reason why LF individuals favor visual processing approaches over verbal or logical reasoning approaches. While this reliance on visual processing may be a compensatory process, it may also be a source of challenge in maintaining task attention and performing multi-step mathematical processes. Delineation of these attentional biases is critical in formulating specialized learning interventions. Personalized strategies such as systematic visual guidance, controlled stimulus presentation, and adaptive training of cognitive functions could be used to alleviate cognitive overload while leveraging the LF individuals’ visual processing abilities.
Functional Connectivity
Compared to HF participants, LF participants exhibited lower functional connectivity within and between the brain areas required for numerical cognition, specifically the frontoparietal network. Functional connectivity is the level of synchronized communication among various brain areas, and dysfunction of this network can lead to impaired numerical reasoning and problem-solving ability. The diminished frontoparietal connectivity described among LF participants aligns with findings asserting ineffective neural information sharing in ASD, contributing to the piecemeal processing of information. More reduced inter-regional interactions account for LF participants’ difficulty in carrying out complex cognitive operations involving integration between centres of memory, attention, and rational thinking. These findings highlight the importance of studying the dynamics of neural connectivity in ASD, since increased functional connectivity is perhaps the gateway to developing directed cognitive training protocols. Future research should explore the use of neurofeedback training, transcranial stimulation, or task-based cognitive therapies to facilitate inter-regional communication for more effective arithmetic functioning.
Conclusion
Overall, individuals with Autism Spectrum Disorder (ASD) demonstrate varied patterns of brain activity and mechanisms of information processing on arithmetic tasks, with significant differences between low-functioning (LF) and high-functioning (HF) individuals. The cognitive heterogeneity associated with ASD leads to different processing strategies, with LF individuals tending to experience more difficulties in attention, memory, executive function, and sensory integration, especially increased sensitivity to visual stimuli.
The atypical lateralization of LF individuals, with more reliance on the right hemisphere, lends support to the alternative neural circuits these individuals utilize to compute numerical calculations. The departure from typical left-hemisphere dominance in computation indicates a multidimensional interplay of neurobiological processes, potentially as compensatory mechanisms. Furthermore, the weaker functional connectivity within the frontoparietal network observed in LF individuals sheds light on the intricate neural dynamics underlying arithmetic processing deficits. The reduced efficiency in communication among crucial brain regions implicated in arithmetic tasks highlights the complexity of neural network dysfunction in ASD. Understanding these nuanced neurobiological underpinnings is paramount for developing effective interventions tailored to address the specific needs of individuals across the ASD spectrum. An appreciation of the contribution of sensory sensitivities and executive function deficits is an additional argument in support of the need for intensive individualised intervention strategies based on neurocognitive profiles. Individualised programmes involving cognitive training, adaptive learning techniques, and interventions of sensory management have the potential to increase educational attainment and accommodation of daily living in ASD adults. [29-31]
Competing Interests
The authors declare no competing interests.
Funding
No funding was received for conducting this study.
Author Note
Data collected for this work will be made available upon request to the corresponding author.
Corresponding Author
Correspondence should be addressed to divyab@ssn.edu.
References
- Divya B, Udayakumar N, Yuvaraj R, Kavitha A (2023) Classification of low-functioning and high-functioning autism using task-based EEG signals. Biomedical Signal Processing and Control 85.
- Okoye C, Obialo-Ibeawuchi CM, Obajeun OA, Sarwar S, Tawfik C, et al. (2023) Early diagnosis of autism spectrum disorder: a review and analysis of the risks and benefits. Cureus 15(8).
- Le Couteur A, Haden G, Hammal D, McConachie H (2008) Diagnosing autism spectrum disorders in pre-school children using two standardised assessment instruments: the ADI-R and the ADOS. Journal of autism and developmental disorders 38(2): 362-372.
- Kleinman JM, Robins DL, Ventola PE, Pandey J, Boorstein HC, et al. (2008) The modified checklist for autism in toddlers: a follow-up study investigating the early detection of autism spectrum disorders. Journal of autism and developmental disorders 38(5): 827839.
- Hassan A, Pinkwart N (2020) On the adaptability and applicability of multi-touch user interfaces addressing behavioral interventions for children with autism. IETE Technical Review 37(2): 180-195.
- Srinivasan V, Udayakumar N, Anandan K (2020) Influence of primary auditory cortex in the characterization of autism Spectrum in young adults using brain connectivity parameters and deep belief networks: An fMRI study. Current Medical Imaging Reviews 16(9): 1059-1073.
- Milovanovic M, Grujicic R (2021) Electroencephalography in assessment of autism spectrum disorders: a review. Frontiers in psychiatry 12: 686021.
- Hankus M, Ochman-Pasierbek P, Brzozowska M, Striano P, Paprocka J (2025) Electroencephalography in autism spectrum disorder. Journal of Clinical Medicine 14(6): 1882.
- Sandhya C, Vidhusha S, Gayathri RS, Sneha Priya B, Kavitha A (2015) Assessment of functional connectivity in autistic brain fMRI. In 2015 IEEE 14th International Conference on Cognitive Informatics & Cognitive Computing (ICCI* CC) (pp. 169-174). IEEE.
- Sun S, Wang F, Xu F, Deng Y, Ma J, et al. (2025) Atypical hierarchical brain connectivity in autism: insights from stepwise causal analysis using Liang information flow. NeuroImage 310: 121107.
- Wismüller A, Vosoughi A, Kasturi A (2025) Analysis of brain connectivity in autism spectrum disorder using large-scale non-linear Granger causality (lsNGC). In Medical Imaging 2025: Clinical and Biomedical Imaging 13410: 180-188.
- Bosl W, Tierney A, Tager-Flusberg H, Nelson C (2011) EEG complexity as a biomarker for autism spectrum disorder risk. BMC medicine 9(1): 18.
- Loth E, Spooren W, Ham LM, Isaac MB, Auriche-Benichou C, et al. (2016) Identification and validation of biomarkers for autism spectrum disorders. Nature reviews Drug discovery 15(1): 70-70.
- Lai MC, Kassee C, Besney R, Bonato S, Hull L, et al. (2019) Prevalence of co-occurring mental health diagnoses in the autism population: a systematic review and meta-analysis. The Lancet Psychiatry 6(10): 819-829.
- Bi F, Jia Z, Lv L, Zhang Y, Zhu C, et al. (2025) Analysis of brain functional connectivity in children with autism spectrum disorder and sleep disorders: a fNIRS observational study. Frontiers in Psychology 16: 1544798.
- Chengaiyan S, Anandhan K (2015) Analysis of speech imagery using functional and effective EEG based brain connectivity parameters. International Journal of Cognitive Informatics and Natural Intelligence (IJCINI) 9(4): 33-48.
- Chengaiyan S, Anandan K (2022) Effect of functional and effective brain connectivity in identifying vowels from articulation imagery procedures. Cognitive Processing 23(4): 593-618.
- Li WX, Lin QH, Zhang CY, Han Y, Calhoun VD (2024) A new transfer entropy method for measuring directed connectivity from complex-valued fMRI data. Frontiers in Neuroscience 18: 1423014.
- Xu Y, Yu Z, Li Y, Liu Y, et al. (2024) Autism spectrum disorder diagnosis with EEG signals using time series maps of brain functional connectivity and a combined CNN–LSTM model. Computer methods and programs in biomedicine 250: 108196.
- Grossi E, Olivieri C, Buscema M (2017) Diagnosis of autism through EEG processed by advanced computational algorithms: A pilot study. Computer methods and programs in biomedicine 142: 73-79.
- Balathay D, Narasimhan U, Belo D, Anandan K (2023) Quantitative assessment of cognitive profile and brain asymmetry in the characterization of autism spectrum in children: A task-based EEG study. Proceedings of the Institution of Mechanical Engineers, Part H: Journal of Engineering in Medicine 237(5): 653-665.
- Jiangn X, Bian GB, Tian Z (2019) Removal of artifacts from EEG signals: a review. Sensors 19(5): 987.
- Vicente R, Wibral M, Lindner M, Pipa G (2011) Transfer entropy-a model-free measure of effective connectivity for the neurosciences. Journal of computational neuroscience 30(1): 45-67.
- Rizzolatti G, Fabbri-Destro M, Cattaneo L (2009) Mirror neurons and their clinical relevance. Nature clinical practice neurology 5(1): 24-34.
- Williams DL, Goldstein G, Minshew NJ (2006) Neuropsychologic functioning in children with autism: Further evidence for disordered complex information-processing. Child Neuropsychology 12(4-5): 279-298.
- Courchesne E, Pierce K (2005) Brain overgrowth in autism during a critical time in development: implications for frontal pyramidal neuron and interneuron development and connectivity. International journal of developmental neuroscience 23(2-3): 153-170.
- Hill EL (2004) Evaluating the theory of executive dysfunction in autism. Developmental review 24(2): 189-233.
- Happe F, Ehlers S, Fletcher P, Frith U, Johansson M, et al. (1996) ‘Theory of mind’in the brain. Evidence from a PET scan study of Asperger syndrome. Neuroreport 8(1): 197-201.
- Justb MA, Cherkassky VL, Keller TA, Minshew NJ (2004) Cortical activation and synchronization during sentence comprehension in high-functioning autism: evidence of underconnectivity. Brain 127(8): 1811-1821.
- Sandhya C, Divya B, Kavitha A, Bobby TC (2018) Influence of relative power in multi-trial speech imagery. In 2018 IEEE 17th International Conference on Cognitive Informatics & Cognitive Computing (ICCI* CC) (pp. 431-439). IEEE.
- Viesel-Nordmeyer N, Prado J (2023) Arithmetic skills are associated with left fronto-temporal gray matter volume in 536 children and adolescents. npj Science of Learning 8(1): 56.

























