


Abstract
There is a dire need for new antimicrobial compounds to combat the growing threat of widespread antibiotic resistance. Metal complex has played an important role in the development of new metal-based drugs. Metal complexes are currently in clinical development for the treatment of diseases .Only , little attention has been paid to their application as potential antimicrobial compounds .Metal complexes of penicillin dehydroacetic acid Schiff-bases with Mn(II) , Co(II) , Ni(II) , Pb(II) , Cu(II) and Cd(II) metal ions were prepared and characterized by elemental and spectroscopic techniques as IR , UV-VIS , Mass , 1H-NMR and ESR as well as magnetic moments , conductivity , thermal analyses and electron microscope.
Element and spectral analysis confirmed octahedral structure. The ESR spectra of solid Cu (II), Mn (II) and Co (II) at room temperature showed anisotropic and isotropic type with covalent bond character. The antimicrobial activity of the prepared compounds was screened against several microbes’ strains namely Bacillus subtilis and streptococcus pneumoniae (+Ve), Escherichia coli and pseudomonas coli (-Ve) and Aspergillus fumigates and candida albicans (Fungi), The antimicrobial screening tests elicit that some compounds exhibited promising antimicrobial activity against these microorganisms compared with parent ligands and standard drugs.
Keywords: Complexes; Spectra; ESR; Magnetism; Conductivity; Cytotoxicity
Abbreviations: DMF: Dimethylformamide; DMSO: Dimethyl Sulfoxide; ESR: Electron Spin Resonance; PCN: Penicillin
Introduction
Penicillin (PCN) refers to a group of -lactam antibiotics used in the treatment of bacterial infections caused by susceptible, usually gram-positive, organisms [1]. All penicillins possess the basic Penam skeleton which has the molecular formula R-C9H11N2O4S, where R is a variable side chain. The chemical structure of penicillin was determined by Dorothy Crowfoot Hodgkin in the early 1940s, enabling synthetic production. Research scientists led by Australian Howard Walter Florey and including Ernst Boris Chain and Norman Healthy discovered a method of mass producing the drug. Penicillin has since become the most widely used antibiotic to date and is still used for many gram-positive bacterial infections [2].
Ampicillin is a β-lactam antibiotic that has been used extensively to treat bacterial infections since 1961[3]. It can sometimes result in allergic reactions that range in severity from a rash (i.e.patients with mononucleosis) to potentially lethal anaphylaxis. Belonging to the group of β-lactam antibiotics, ampicillin can penetrate gram-positive and some gram-negative bacteria. It inhibits the third and final stage of bacterial cell wall synthesis, which ultimately leads to cell lysis [4]. Ampicillin is one of the most widely prescribed antibiotics. It is considered a penicillin and is a close relative of another amoxicillin [5].
Unlike penicillin, ampicillin and amoxicillin can penetrate and prevent the growth of certain types of bacteria, called gram-negative bacteria [6]. Ampicillin is used mainly to treat infections of the middle ear, sinuses, bladder, kidney, and uncomplicated gonorrhea. It is also used intravenously to treat meningitis and other serious infections [7]. A semisynthetic penicillin having a broader antibacterial spectrum of action than that of penicillin G. It is effective against gram-negative and gram-positive bacteria and used to treat gonorrhea and infections of the intestinal, urinary, and respiratory tracts [8-10].
Amoxicillin (INN) or amoxycillin (former BAN) is a moderate- spectrum -lactam antibiotic used to treat bacterial infections caused by susceptible microorganisms [11]. It is usually the drug of choice within the class because it is better absorbed following oral administration than other β-lactam antibiotics. Amoxicillin is susceptible to degradation by -lactamase-producing bacteria and so may be given with clavulanic acid to decrease its susceptibility. Amoxicillin acts by inhibiting the synthesis of bacterial cell walls. It inhibits cross-linkage between the linear peptidoglycan polymer chains that make up a major component of the cell wall of gram-positive bacteria [12].
Cloxacillin is a semisynthetic antibiotic in the same class as penicillin [13]. Cloxacillin is used against staphylococci that produce β-lactamase [14]. This drug has a weaker antibacterial activity than benzyl penicillin and is devoid of serious toxicity except for allergic reactions [15]. Ampicillin is a bactericidal antibiotic; it penetrates the bacterial wall better than penicillin G and is active against gram-negative bacteria that are resistant to penicillin G [16]. Ampicillin has a broad-spectrum antimicrobial activity and is the most widely used antibiotic for treating infections caused by Listeria, Beta-lactamase-negative Haemophiles, enterococci, Shigella, streptococci, Escherichia coli, Klebsiella pneumoniae, Proteus mirabilis, Neisseria gonorrhea, Neisseria meningitis and many coliform organisms [17].
This manuscript describes preparation, characterization and antimicrobial studies of new metal complexes of penicillin dehydroacetic acid Schiff-bases. Schiff-base represents an important class of pharmacologically active molecules so that have engaged a great concern by medicinal chemist as they possess a variety of pharmacological properties. Several Schiff-bases have been reported to exercise notably antibacterial, antifungal, anti-tuber, antitumor, antileishmanial and DNA-binding activities.
Experimental
Instrumentation and Measurements
The ligand and its metal complexes were analyzed for C, H, N and Cl at the Microanalytical center, Cairo University, Egypt. Standard analytical methods were used to determine the metal ion content [18].1H-NMR spectra were obtained on BRUKER 400 MHz spectrometers. Chemical shifts (ppm) are reported relative to TMS. IR spectra of the ligand and its metal complexes were measured using KBr discs by a Jasco FT/IR 300E Fourier transform infrared spectrophotometer covering the range 400-4000 cm1.
Electronic spectra in the 200-900 nm regions were recorded on a PerkinElmer 550 spectrophotometer. Mass spectra were recorded using JEULJMS-AX500 mass spectrometer provided with data system. The thermal analyses (DTA and TGA) were carried out on a Shimadzu DT-30 thermal analyzer from room temperature to 800 ºC at a heating rate of 10 ºC/min. Magnetic susceptibilities were measured at 25oC by the Gouy method using mercuric tetrathiocyanatocobaltate (II) as the magnetic susceptibility standard. Diamagnetic corrections were estimated from Pascal’s constant.
The magnetic moments were calculated from the equation:

The molar conductance of 10-3 M solution of the complexes in DMSO was measured at 25 ºC with a Bibby conductometer type MCl. The resistance measured in ohms and the molar conductivities were calculated according to the equation:
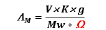
Where: AM = molar conductivity / Ω-1cm2 mol-1, V = volume of the complex solution/ mL, K = cell constant (0.92/ cm-1), Mw = molecular weight of the complex, g = weight of the complex/g, Ω = resistance/Ω. ESR spectra were recorded using the Avarian E-109 spectrophotometer. DPPH was used as a standard material. TLC confirmed the purity of the prepared compounds.
Synthesis of Ligand (1)
The ligand, (H3L) was prepared by dropwise addition ampicillin (20.0 g, 0.13 mol) dissolved in (30 cm3) of distilled water with five drops of conc H2SO4 to ethanolic solution of dehydroacetic acid (14.5 g, 0.13 mol). The mixture was refluxed with stirring for two hours and then cooled at room temperature. filtered off the formed precipitates. and leave it to dmry under vacuum over anhydrous CaCl2 to give the ligand. Analytical data of the ligand are given in Table 1. Synthesis of the ligand is shown in scheme (1).
Synthesis of Metal Complexes Preparation of Metal Complexes, (2-9)
Synthesis of complexes (2-9) using (1L:1M) molar ratio. Complexes were carried out by refluxing a hot ethanolic solution of the ligand (1.0 g, 0.002 mol) with a hot ethanolic solution (30 cm3) of the metal salts of (0.99 g, 0.002 mol) of Mn (OAc)2.4H2O, complex (2), (1.0 g, 0.002 mol) of Cu (OAc)2. H2O, complex (3) , (0.08 g, 00.002 mol) of Pb(OAc)2.4H2O, complex (4) , (0.89 g, 0.002 mol) of Co(SO4)2.7H2O, complex (5) , (1.1g , 0.002 mol ) of Ni(SO4)2.4H2O, complex (6) , (1.54 g, 0.004 mol) of Cu(SO4)2.5H2O, complex (7) , (0.64 g, 0.002 mol)of Cd(NO3)2.5H2O, complex (8) , (1.01g, 0.002 mol ) CuCl2.2H2O, complex (9) , The reaction mixtures were refluxed with stirring for 1–3 hrs. range, depending on the nature of the metal ion and the anion used.
The precipitates formed were filtrated off, washed with ethanol, and dried in desiccators over anhydrous (CaCl2). The analytical data are shown in table (1). Synthesis of ligand (2): The ligand, (HL2), (10) was prepared by dropwise addition amoxicillin (30.0 g, 0.13 mol) dissolved in 30 cm3 of distilled water with five drops of conc H2SO4 to ethanolic solution (30 cm3) of dehydrocafestol acid (17.5 g , 0.13 mol). The mixture was refluxed with stirring for two hours and then cooled at room temperature. Filtered off the formed precipitates and leave it dry under vacuum over anhydrous CaCl2 to give the ligand. Analytical data of the ligand are given in Table 1. Synthesis of the ligand (HL2), (10) is shown in scheme (1).


Synthesis of Metal Complexes Preparation Of Metal Complexes, (11-9)
Synthesis of complexes (11-19) using (1L:1M) molar ratio. Complexes were carried out by refluxing a hot ethanolic solution of the ligand (1.0 g, 0.002 mol) with a hot ethanolic solution (30 cm3) of the metal salts of (0.99 g, 0.002 mol) of Mn (OAc)2.4H2O, complex (11), (1.0 g, 0.002 mol) of Ni (OAc)2. H2O, complex (12), (0.08 g, 00.002 mol) of Cu (OAc)2.H2O, complex (13), (0.89 g, 0.002 mol) of Pb (OAc)2.4H2O, complex (14), (1.1, 0.002 mol) of Co (SO4)2.2H2O, complex (15), (1.54 g, 0.004 mol) of Ni(SO4)2.4H2O, complex (16) , (0.64 g, 0.002 mol)of Ni(NO3)2.4H2O, complex (17) , (1.01g, 0.002 mol ) Cd(NO3)2.5H2O complex (18) and (1.01g, 0.002 mol ) CuCl2 2H2O complex (19) The reaction mixtures were refluxed with stirring for 1-3 hrs range, depending on the nature of the metal ion and the anion used. The precipitates so formed were filtrated off, washed with ethanol, and dried in desiccators over anhydrous CaCl2. The analytical data are shown in table (1).
Biological Activity
The antibacterial activities of the ligand and its metal complexes were carried out in the Botany Department, Lab. of microbiology, Faculty of Science, El-Menoufia University, Egypt. Antimicrobial activity was assessed against gram positive bacteria “Staphylococcus aureus” and gram-negative bacteria “Escherichia coli” by well diffusion method. Phamox was used as positive control for each bacterium. The test compounds were dissolved in injection water to concentration 9%. The bacteria were subculture in nutrient agar medium which, was prepared using peptone, beef extract, agar, NaCl and distilled water. The Petri dishes were incubated for 48 hrs at 37 0C. The standard antibacterial drug was also screened under similar conditions for comparison. The zone of inhibition was measured in centimeters carefully. All determinations were made in triplicate for each of the compounds. An average of the three independent readings for each compound was recorded.
Results and Discussion
All metal complexes are colored, crystalline solids, non-hygroscopic, and air stable solids at room temperature without decomposition for a long time. The complexes are insoluble in water, ethanol, methanol, benzene, toluene, acetonitrile and chloroform, but appreciably soluble in both dimethylformamide (DMF) and dimethyl sulfoxide (DMSO). Electron microscope data show that some of the complexes are found in nanoform and the sizes in < 26.1-14% >. The analytical and physical data (table 1) and spectral data (tables 2-4) agree well with the proposed structures (Figure 1). The elemental analyses indicated that all complexes were found to (1L: 1M) molar ratio.

Electron microscopic pictures of complex [5].

*Lm(Ω-1cm2mo-1)

Conductance Measurements
The molar conductivities of the complexes were measured in DMSO with 1.0×10⁻³ M. The low magnitudes of molar conductivities Ω-1cm2mol-1 (listed in Table 1) indicated that all the complexes possessed non-electrolytic nature [19]. These values agree well with the analytical data confirmed the involvement of the anion groups in the metal coordination.
Mass Spectra
Mass spectrometry was used to confirm the molecular ion peaks of Schiff- base ligand and their metal complexes and to investigate the fragment species [20]. The recorded mass spectrum of (H1L1) ligand revealed molecular ion peak strongly confirms the proposed formula. It showed a molecular ion 499 amu peak at m/z, confirming its formula weight (F.W. 499.54) and the purity of the ligand prepared. The prominent mass fragmentation peaks observed at m/z = 48, 83, 166, 242, 325, 385,455 and 499, amu corresponding to C3H12, C6H11, C12H22, C12H20NO2S, C16H- 23NO4S, C21H23NO4S, C23H23N2O6S and C24H253N3O7S moieties respectively supported the suggested structure of the ligand (Table 2, 9).

The mass spectrum of the [(H3L1)(Cu) (SO4) (H2O)2].H2O complex (7) showed the molecular ion peak at m/z 719 amu, confirming its formula weight (F.W. 719.The mass fragmentation patterns observed at m/z = 49, 85 123, 149, 215, 239, 318, 411, 452,513,624 and 719.13 amu correspond to C3H13 , C6H11 , C9H15 , C11H17 , C14H17NO , C16H17NO , C17H20NO5 , C17H- 17NO9S , C18H16N2O10S , C20H21N2O12S , C22H30N3O14S2 and C24H31N3O14S2Cu moieties, respectively, strongly supported the suggested structure of the complex (Table 2, 6).
However, the mass spectrum of the [(H1L1)(Cd) (NO3)2(H2O)].H2O complex (8) showed the molecular ion peak at m/z 772 amu, confirming its formula weight (F.W. 772).The mass fragmentation patterns observed at m/z = 55 , 70 , 91, 106, 130, 200, 256, 400 421 467, 539,623 and 772 amu correspond to C4H7 , C5H10 , C7H7 , C8H10 , C10H10 , C12H10NO2 , C14H10NO4 , C18H18NO8S , C19H19NO8S , C20H19NO10S , C22H23N2O12S , C25H25N3O14S and C24H29CdN5O15S moieties, respectively, supported the suggested structure of the complex.
The recorded mass spectrum of (HL2) ligand to reveal its molecular ion peak strongly confirmed the proposed formula. It showed a molecular ion peak at m/z 515amu, confirming its formula weight (F.W. 515) and the purity of the ligand prepared. The prominent mass fragmentation peaks observed at m/z = 65, 98, 143, 203, 258, 372,435,456 and 515 amu corresponding to C5H5, C7H14, C8H17NO, C13H17NO, C13H17NO2S, C19H20N2O4S, C20H25N3O6S, C22H22N3O6S and C24H25N3O8S moieties respectively supported the suggested structure of the ligand (Table 2, 4).


However, the mass spectrum of the [HL2) (Cu)(OAc)2(H2O)]. H2O complex (13) showed the molecular ion peak at m/z 773 amu, confirming its formula weight (F.W. 773). The mass fragmentation patterns observed at m/z = 55, 69, 85, 129, 153, 256, 514, 608 and 773 amu correspond to C4H7, C4H7N, C4H7NO, C6H7NO2, C7H7NO3, C10H10NO5S, C22H30N2O10S, C26H30N3O12S and C22H30N3O14S2 moieties, respectively, strongly supported the suggested structure of the complex. (Table 2, e).

The mass spectrum of the [(HL2)(Cu) (OAc)2 (H2O)].H2O complex (19) showed the molecular ion peak at m/z 686 amu, confirming its formula weight (F.W. 686).The mass fragmentation patterns observed at m/z = 55 , 69 , 99, 129, 155, 215, 239, 285 397 465, 490,549 and 686 amu correspond to C4H7 , C4H9 , C6H11O , C7H13O2 , C9H15O2 , C14H15O2 , C16H13O2 , C16H- 15NO4 , C17H21N2O7S , C20H24N3O8S , C22H24N3O8S , C24H- 27N3O10S , C24H29N3O10SCl2,and C22H30N3O14S2 moieties, respectively, strongly supported the suggested structure of the complex (Table 2, f).

Proton Nuclear Magnetic Resonance Spectra (1H-NMR)
The 1H-NMR spectra of ligand (1) and (10) and their complexes Pb (II) complex (4), Cd (II) complex (8) and Pb (II) complex (14) in deuterated DMSO showed peaks consistent with the proposed structures. The 1H-NMR spectrum of the ligand (1) shows chemical shift observed as singlet at 12.7 ppm (s, H, OH) which is assigned to proton of aromatic hydroxyl group [21]. The chemical shifts which appeared at 8.1-8.5 ppm range are attributed to the azomethine protons (H-C=N). However, the chemical shifts that appeared as a singlet at 9.3 ppm is attributed to the proton of NH group.
A set of signals appeared as multiples in the 6.1-7.7 ppm range, corresponding to protons of aromatic rings [21]. The 1H-NMR spectrum of the ligand (10) shows chemical shift observed as singlet at 9.7 ppm (s, H, OH) which is assigned to proton of aromatic hydroxyl group. The chemical shifts which appeared at 8.1- 8.5 ppm range are attributed to the azomethine protons (H-C=N). However, the chemical shifts that appeared as a singlet at 9.1 ppm is attributed to the proton of NH group. A set of signals appeared as multiples in the 6.1-7.7 ppm range, corresponding to protons of aromatic rings [21].
By comparison, the 1H- NMR of the ligands and the spectra of Pb (II) complex (4) Cd (II) complex (8), and Pb (II) complex (14) showed OH signal shifted to downfield shift characteristic to the OH group indicating that, the ligands bonded with the metal ions in their protonated form. In addition, there is a significant downfield shift of the azomethine proton signal and one from NH groups relative to the free ligands clarified that, the metal ions are coordinated to the azomethine nitrogen atom and NH nitrogen atom. This shift may be due to the formation of a coordination bond (N→M) [29]. Also, the appearance of new signal at 1.3 ppm is due to proton acetate group. The protons of aromatic rings appeared at 6.1-7.7.
IR Spectra
The mode of bonding between the ligand and the metal ion revealed by comparing the IR spectra of the ligands (1), and their metal complexes (2-9) and (11-19). The ligand (1) showed bands in the 3660-3345 and 3340-2880 cm-1 ranges, commensurate the presence of two types of intra- and intermolecular hydrogen bonds of OH and NH groups. Strong bands appeared in 1717, and 1610 cm-1 related to v (C=O) and (C=N) respectively. The medium band appeared at 3200 cm-1 is assigned to υ (N-H) group [22]. The υ (NH) group in the complexes was shifted from the region of the free ligand indicating that, the NH group is involved in the coordination to the metal ion. The bands appeared 1555 and 772 cm-1, were assigned to υ (Ar) vibration [23-25].
However, the ligand (10) showed bands in the 3550-3320 and 3310-2650 cm-1 ranges, confirmed the presence of two types of intra- and intermolecular hydrogen bonds of OH and NH groups [26]. Strong bands appeared in 1714 and 1668 cm-1 related to υ (C=O) and (C=N) respectively. The medium band that appeared at 3185 cm-1 is assigned to υ (N-H) group [27]. The υ (NH) group in the complexes was shifted from the region of the free ligand indicating that, the NH group is involved in the coordination to the metal ion [32]. The bands appeared 1540 and 776cm-1, were assigned to υ (Ar) vibration [23-25].
By comparing the IR spectra of the complexes (2) (9) and (11) (19). with that of the free ligands. It was found that the IR spectra of the metal complexes. Showed bands in the 3665-3550 cm-1, 3350-3180 cm-1, 3320-3180 cm-1 and 2875-2550 cm-1 ranges, commensurate the presence of two types of intra-and intermolecular hydrogen bonds and, hydrated or coordinated water molecules. Also, the position of the υ (C=N) bands of imines were shifted by 2-72 cm-1 range towards lower wave number in the complexes indicating coordination through nitrogen of azomethine group (CH=N) [28]. This is confirmed by the appearance of new bands that appeared in the 558-548 cm-1 range, this has been assigned to the υ (M-N) [29].
Complexes (2)(19) showed υ (C=O) band at 1715-1700 range, However, complexes (2)(19) show lower shift, indicating coordination to the metal ion and lowering the value of this group [40]. The aromatic ring vibrations appeared in the 1548-1521 cm-1 and 752-730 cm-1 ranges [30]. In acetate complexes, the acetate ion may be coordinated to the metal ion in unidentate manner [31]. As in the case of acetate complexes (2)(4) and (11)(14) showed bands in the 1480-1345 and 1430-1330 cm-1 range, assigned to the asymmetric and symmetric stretches of the COO- group. The mode of coordination of acetate group has often been deduced from the magnitude of the observed separation between the υ asym.
COO-) and υ sym. (COO-). The separation value (Δ) between υ asym (COO-) and υ sym. (COO-) in these complexes was in the 105-100 cm-1 range suggesting the coordination of acetate group as a monodentate fashion [32]. The sulphatic complexes (5) (7) and (15)(16) showed bands at 1285-1230,1180-1140, and 750-667 ranges, which were assigned to monodentate sulphate group [33]. The nitrate complexes (8)(17) and (18) showed bands at 1380,1160,1074,820 cm-1, 1330,1165,1073,789 cm-1 and 1386,1167,1070,800 cm-1 respectively which assigned to monodentate nitrate group (). Complexes (9) and (19) showed bands in the (430-435 cm-1) is assigned to υ (M-Cl). Complexes (2) and (19) showed bands in the 564-537 cm-1 range were assigned to υ (M-N) and bands appeared in the 640-615 cm-1 range were due to u (M-O) respectively [34]. The IR data are shown in table (3).


Electron Spin Resonance (ESR)
To obtain further information about stereochemistry and the nature of metal ligand bonding, ESR spectra of solid complexes (Table 5) have been carried out. The spectra of Cu (II) complexes (3)(9)(13) and (19) showed that, the complexes exhibited anisotropic signals with g values g|| = 2.15, 2.16, 2.12 and 2.21, g⊥ = 2.02, 2.02, 2.02 and 2.10 respectively. These values are characteristic for a species d9 configuration with an axial symmetry type of d(x2-y2) ground state. The values of g|| and g⊥ are closer to 2.00 and g|| > g⊥ > ge (2.0023) indicating that, the complexes possessed a hederal distortion copper (II) geometry corresponding to an elongation along the four-fold symmetry z-axis [196].
Also, the value of g|| /A|| may be considered as a diagnostic of stereochemistry. It has been suggested that, this quotient may be used as an empirical index of geometry [197]. The range reported for square-planar complexes are 105-135 cm-1 and for tetrahedrally distorted complexes are 150-250 cm-1 range. The g|| /A|| values for the complexes under consideration lie just in the range which expected for a tetrahedral distorted octahedral copper (II) complex.
In addition, the exchange coupling interaction between copper (II) ions is explained by Hathaway expression which stated that G = (g|| -2)/ (g⊥-2). If the value of G is greater than four, the exchange interaction is negligible whereas when the value of G is less than four a considerable interaction is present in solid complexes. The G values of the copper (II) complexes are 6.0-10.5 range [Table 5] since the interaction between copper (II) ions is present. Kivelson and Neiman noted that, for an ionic environment, g|| is normally 2.3 or larger but for covalent environment g|| is less than 2.3. The values of the absent complexes are less than 2.3, so there is a significant degree of covalency in the metal-ligand bonding [198].
The σ – parameter (α2) was calculated from the following equations:

Where P is the free ion dipolar term, which is equal 0.036, A|| is the parallel coupling constant expressed in cm-1. The α2values of the copper (II) complexes lie in 0.48 and 0.62 range (Table 5), these values indicate the presence of a significant degree in-plane σ covalency.

a) giso = (2g┴ + gǁǁ)/3, b) Aiso = (2A┴ + Aǁǁ)/3, c) G= (gǁǁ- 2)/ (g┴ - 2).
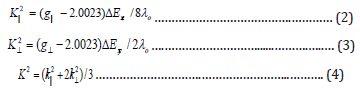
Where λo is the spine orbit coupling of free copper ion (-828 cm-1) and ΔExy and ΔExz are the electronic transition energies of 2B1→2B2 and 2B1→2E, respectively. To calculation, it was assumed that the maximum in the band corresponds to ΔExy and ΔExz can be taken from the wavelength of these bands. From the above relations, the orbital reduction factors (K||, K┴ and K) which are a measure of covalency can be calculated. For an ionic environment, K=1 and for a covalent environment K < 1; the lower the value of K, the greater is the covalent character. The values of K for copper (II) complexes are less than one which inductive to considerable covalent bond character. The plane and out-of-plane π-bonding coefficients β12 andβ2 ) respectively are dependent upon to values of ΔExy and ΔExz in the following equations: -
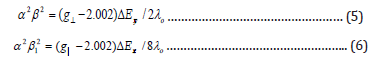
The copper (II) complexes showed values 0.86-0.89 range indicating a moderate degree of covalent character in the in-plane π-bonding, while β2 are 0.37-0.5 range indicating ionic character in the out - of-plane π-bonding. However, manganese (II) complexes (2) and (11) showed isotropic type with giso = 2.01 and 2.0 indicating octahedral structure around manganese (II) ions. However, Co (II) complexes (5) and (15) showed giso = 2.04 and 2.0, respectively indicating distorted octahedral structure (). It is possible to calculate approximate d orbital population using the following equation.

Where 2Bo is the calculated dipolar coupling for unit occupancy of d orbital .When the data are analyzsed using the Cu63 hyperfine coupling and considered all the sign combinations. The orbital populations for complexes (3),(9),(13) and (19) are 90.2%,72.86%, ,95.74% and 76.83% respectively, indicating a d(x2-y2) ground state [200].
Thermal Analyses (DTA and TGA)
The thermal data of the complexes are given in Table 6. Such data corroborate the stoichiometric formula, number of water molecules, and end products [50-53]. Thermogravic curves of complexes (3)(4)(5)(7)(9)(11)(12)(13) and (14) were introduced as representative examples. Thermogram of complex (3) [(HL1) (Cu)(OAc)2(2H2O) H2O exhibited five-steps decomposition, the first step involving breaking of H-bondings accompanied with endothermic peak at 45 oC. In the second step, one molecule of hydrated water molecule was lost endothermically with appearance of a peak at 75 oC accompanied by 2.9 Calc, (2.5%) weight loss. Then, one molecule of coordinated water was lost endothermically with appearance of a peak at 130 oC accompanied by 2.2 Calc, (2.57%) weight loss.

The weight loss of 17.2% (Calc 17.3%) accompanied by an endothermic peak appearing at 260 oC was assigned to loss of two acetate groups (OAc). The endothermic peak observed at 360oC refered to the melting point of the complex. The final step was observed as exothermic peaks in the 400-660 oC range with 14.2% weight loss (Calc 14.03%), refered to complete oxidative decomposition of the complex which ended up with the formation of (CuO). Complex (4) [(HL1) ((Pb) (OAc)2(H2O)]. H2Oexhibited multiple decomposition steps, the first step involving breaking of H-bondings accompanied with endothermic peak at 50 oC. In the second step, one molecule of hydrated water was lost endothermically with a peak at 90oC accompanied by 2.35% (Calc 2.09%) weight loss, then one molecule of coordinated water was lost endothermically with a peak at 120 oC accompanied by 2.35% (Calc 2.13%) weight loss.

14.8% (Calc 14.3%) weight loss accompanied by an endothermic peak at 320 oC was assigned to loss of coordinated two acetate group (OAc). The endothermic peak appeared at 370 oC refers to the melting point of the complex. The final step was observed as exothermic peaks at 440-630 oC range with 30.9% weight loss (Calc 31.58%), refers to complete oxidative decomposition of the complex which ended up with the formation of (PbO). Complex (5) [H3L) (Co) (SO4) (H2O)2]. H2O.exhibited multiple decomposition steps, the first step involving breaking of H-bondings accompanied with endothermic peak at 40 oC.
In the second step 2.32% (Calc 2.5%) weight loss accompanied by endothermic peak appeared at 90oC due to one molecule of hydrated water, then two molecules of coordinated water were lost endothermically with a peak at 1600 oC accompanied by 5.3% (Calc %.5.2) assigned to weight loss and another endothermic peak at, 310 oC was accompanied by 14.6% (Calc %14.67) weight loss, one coordinated sulphate groups (SO4). The endothermic peak observed at 350 oC refered to the melting point of the complex. The final step observed as exothermic peaks at 440-600 oC range with 13.2 weight loss (Calc 13.26%), refers to complete oxidative decomposition of the complex which ended up with the formation of (CoO).
Complex (7) [(H3L) (Cu) (SO4) (H2O)2]. H2O exhibited multiple decomposition steps, the first step involving breaking of H-bondings accompanied with endothermic peak at 45 oC. In the second step, one molecule of hydrated water was lost endothermically with a peak at 75 oC accompanied by 2.53% (Calc 2.5%). weight loss. 4.9% (Calc 5.13%) weight loss accompanied by an endothermic peak observed at 130 oC was assigned to loss of two coordinated water molecules. Weight loss. 14.2% (Calc 14.4%) weight loss accompanied by an endothermic peak appeared at 260 oC was assigned to loss of one coordinated sulphate group (SO4). The endothermic peak observed at 360oC refered to the melting point of the complex.
The final step observed as exothermic peaks at 450-600 oC range with 13.85% weight loss (Calc 13.88%), refered to complete oxidative decomposition of the complex which ended up with the formation of (CuO). Complex (9) [H3L) (Cu) (Cl)2 (H2O)]. H2O exhibited multiple decomposition steps, the first step involving breaking of H-bondings accompanied with endothermic peak at 50 oC. In the second step, one molecule of hydrated water was lost endothermically with a peak at 80 oC accompanied by 2.3% (Calc 2.36%) weight loss, one molecule of coordinated water was lost endothermically with a peak at 140 oC accompanied by 2.7% (Calc % 2.76) weight loss. 11.05% (Calc 11.04%) weight loss accompanied by an endothermic peak observed at 320 oC was assigned to loss of one coordinated sulphate group (SO4) [65].
The endothermic peak observed at 370oC refered to the melting point of the complex. The final step a exothermic peaks observed at 470-620 oC range with 14.3% weight loss (Calc 14.0%), refered to complete oxidative decomposition of the complex which ended up with the formation of (CuO). Thermogram of complex (11) [(H3L) (Mn)(OAc)2(H2O) H2O exhibited five-steps decomposition, the first step involving breaking of H-bondings accompanied with endothermic peak at 45 Co. In the second step, one molecule of hydrated water molecule was lost endothermically with appearance of a peak at 90 Co accompanied by 2.42% (Calc 2.48%) weight loss.
Then, one molecule of coordinate water was lost endothermically with appearance of a peak at 150 Co accompanied by 2.2% (Calc. 2.5%) weight loss. The weight loss 17.10 (Calc 17.15%) accompanied by an endothermic peak at 300 Co was assigned to loss of two acetate groups (OAc). The endothermic peak observed at 370 Co refered to the melting point of the complex. The final step was observed as exothermic peaks in the 430-650 Co range with 12.8% weight loss (Calc 12.98%), refered to complete oxidative decomposition of the complex which ended up with the formation of (MnO). Complex (12) [H1L2) ((Ni) (OAc)2(H2O)].
2H2Oexhibited multiple decomposition steps, the first step involving breaking of H-bondings accompanied with endothermic peak at 45 Co. In the second step, two molecules of hydrated water molecules were lost endothermically with a peak at 75 Co accompanied by 2.53% (Calc 2.5%) weight loss, then one molecule of coordinated water was lost endothermically with a peak ob served at 130 Co accompanied by 2.1% (Calc 2.47%) weight loss. 17.2% (Calc 17.4%) weight loss accompanied by an endothermic peak appear at 260 Co was assigned to loss of coordinated two acetate group (OAc).
The endothermic peak appeared at 360 Co refered to the melting point of the complex. The final step was observed as exothermic peaks at 450-600 Co range with 13.1% weight loss (Calc 13.3%), refered to complete oxidative decomposition of the complex which ended up with the formation of (NiO). Complexes (13) [(H1L2) (Cu) (OAc)2 2(H2O)]. H2O.exhibited multiple decomposition steps, the first step involving breaking of H-bondings accompanied with endothermic peak appeared at 50 Co. In the second step 2.35% (Calc 2.4%) weight loss accompanied by endothermic peak appeared at 80 Co was due to loss of one molecule of hydrated water, then one molecule of coordinated water was lost endothermically with a peak observed at 140 Co accompanied by 2.1% (Calc %.2.5) weight loss and a peak observed at 320 Co was assigned 16.83% (Calc %16.9) weight loss of was assigned two coordinated acetate group (OAC).
The endothermic peak observed at 350 Co referred to the melting point of the complex. The final step observed as exothermic peaks at 470-620 0C range with 13.3 weight loss (Calc 13.7%), refered to complete oxidative decomposition of the complex which ended up with the formation of (CuO). Complex (14) [(HL2) (Pb) (OAc)2 (H2O)]. H2O exhibited multiple decomposition steps, the first step involving breaking of H-bondings accompanied with endothermic peak at 45 oC. In the second step, one molecule of hydrated water was lost endothermically with a peak at 90 oC accompanied by 2.12% (Calc 2.05%).
weight loss. 2.2% (Calc 2.09%) weight loss accompanied by an endothermic peak observed at 150 oC was assigned to loss of one coordinated water molecule. Weight loss. 14.08% (Calc 14.04%) weight loss accompanied by an endothermic peak at 300 oC was assigned to loss of two coordinated acetate groups (OAc). The endothermic peak observed at 370oC refered to the melting point of the complex. The final step observed as exothermic peaks at 430- 650 oC range with 31.80 % weight loss (Calc 31.88%), refered to complete oxidative decomposition of the complex which ended up with the formation of (PbO).
Antimicrobial activity
The antimicrobial activity of some compounds was examined against the results were shown in figures (2) and (3). All the tests were performed in triplicate and the diameters of the inhibition zones were measured in millimeters, [54-57] The drugs ampicillin and amphotericin B are taken as standard to compare the effectiveness of the test compounds. The effectiveness of the compound can be predicated by knowing the zone of inhibition value in mm [58-63]. The antibacterial activity was then interpreted as follows: The diameter of inhibition zone > 15.0 mm was considered as strong; 10.0 to 14.5 mm as moderate and <10.0 as weak. It was found that metal complexes showed the highest antimicrobial activity against the four types of microbes: The orders of the antimicrobial activity were as follows.


References
- Brogden RN, Heel RC, Speight TM, Avery GS (1979) Amoxicillin injectable: a review of its antibacterial spectrum, pharmacokinetics and therapeutic use. Drugs 18(3): 169‐
- Bush K (2003) β‐lactam antibiotics: Penicillin, and other β‐lactam antibiotics. In: Finch RG, Greenwood D, Norry SR., and WhitleyRJ. Antibiotic and chemotherapy: anti‐infective agents and their use in therapy. 8th ed. Philadelphia (USA): Churchill Livingstone, an imprint of Elsevier Science Limited p: 224‐2
- El‐Sooud KA, Al‐Tarazi YH, Al‐Bataineh MM (2004) Comparative pharmacokinetics and bioavailability in chickns after intravenous, intramuscular and oral administration. Veter Res Comm 28(7): 599‐
- Gordon RC, Regamey C, Kirby WMM (1972) Comparative clinical pharmacology of amoxicillin and ampicillin administered orally. Antimicrob Agents Chemotherapy 1(6): 504‐
- Nolan CM, Chalhub EG, Nash DG, Yamauchi T (1979) Treatment of bacterial meningitis with intravenous amoxicillin. Antimicrob Agents Chemotherapy 16(2): 171‐
- Neu HC (2007) Antimicrobial activity and human pharmacology of amoxicillin. J Infect Diseases 129(0Suppl): S123‐ United States Pharmacopoeia‐30 and National Formulary‐25: The Official Compendia of Standards. Rockvile (US): United Stats Pharmacopoeial Convention p: 1402‐1407.
- British Pharmacopoeia (2009) ed. Vol I & II. London: British Pharmacopoeia Commission p: 353‐
- Indian Pharmacopoeia (2007) 5th ed. Vol 2. Ghaziabad (INDIA): Indian Pharmacopoeia Commission p: 100‐
- Amin AS, El‐Ansary AL, Issa YM (1994) Colorimetric determination of amoxicillin in pure form and in pharmaceutical preparations. Talanta 41(5): 691‐
- Nagaralli BS, Seetharamappa J, Melwanki MB (2002) Sensitive spectrophotometric methods for the determination of amoxicillin, ciprofloxacin and piroxicam in pure and pharmaceutical formulations. J Pharm Biod Anal 29(5): 859‐
- Dousa M, Hosmanova R (2005) Rapid determination of amoxicillin in premixes by HPLC. J Pharm Biomed Anal 37(2): 373‐
- Torres RF, Consentino MO, Lopez MAB, Mochon MC (2010) Simultaneous determination of 11 antibiotics and their main metabolites from four different groups by reversed‐phase high‐performance liquid chromatography–diode array–fluorescence (HPLC–DAD–FLD) in human urine samples. Talanta 81(3): 871‐
- Penta J, Jannu KK, Musthyala R (2010) Antimicrobial studies of selected antibiotics and their combination with enzymes. InterJ of pharmacy and pharmaceutical sciences 2(3): 43‐
- Brunton LL, Parker KL, Blumenthal DK, Buxton ILO (2008) Goodman & Gilman’s manual of pharmacology and therapeutics. USA: The McGraw‐Hill Companies p: 728‐
- Neu HC (1982) Penicillins ‐ New insights into their mechanisms of activity and clinical use. Bull NY Acad Med 58(8): 681‐
- Mendam J, Vogel A, Vogel S (2000) Textbook of Quantitative chemical Analysis, Harlow: prentice Hall.
- Curtin‐Wirt C, Casey JR, Murray PC, Cleary CT, Hoeger WJ, et al. (2003) Efficacy of penicillin vs. amoxicillin in children with group a beta‐hemolytic streptococcal tonsillopharyngitis. Clinical Pediatris (Phila) 42(3): 219‐
- Lennon DR, Farrell E, Martin DR, Stewart JM (2008) Once‐daily amoxicillin versus twice‐daily Penicillin V in group a {beta}‐ hemolytic Streprococcus pharyngitis. Arch Dis Child 93(6): 474‐
- Jacobson GF, Autry AM, Kirby RS, Liverman EM, Motley RU (2001) A randomized controlled trial comparing amoxicillin and azithromycin for the treatment of Chlamydia trachomatis in pregnancy. Am J Obstet Gyneol 184(7): 1352‐
- Luft BJ, Dattwyler RJ, Johnson RC, Luger SW, Bosler EM, et al. (1996) Azithromycin compared with amoxicillin in the treatment of erythema migrans. A double‐blind, randomized, controlled trial. Ann Intern Med 124(9): 785‐
- Calhoun KH, Hokanson JA (1993) Multi-center comparison of clarithromycin and amoxicillin in the treatmet of acute maxillary sinusitis. Arch Fam Med 2(8): 837‐
- Acred P, Hunter A, Mizen L, Rolinson GN (1970) α-Amino-p-hydroxybenzylpenicillin (BRL 2333), a new broad-spectrum semisynthetic penicillin: in vivo evaluation. Antimicrobial Agents and Chemotherapy 10: 416-422.
- Adam G, Roberts S (2006) Report 1541N-03-04-164. Depletion of milk residues following i.m. administration of clamoxyl RTU (amoxicillin) to sheep. Unpublished report submitted to FAO by Pfizer Animal Health.
- Adam G, Roberts S (2007a) Report No. 1541N-03-04-165. Depletion of tissue residues following i.m. administration of clamoxyl RTU (amoxicillin) to sheep. Unpublished report submitted to FAO by Pfizer Animal Health.
- Adam G, Roberts S (2007b) Report No. 1820N-03-04-219. Development and validation of an analytical method for the determination of amoxicillin in swine liver, kidney, muscle and skin with fat. Unpublished report submitted to FAO by Pfizer Animal Health.
- Adam G, Roberts S (2008) Report 1521N-03-05-242. Depletion of tissue residues following i.m. administration of clamoxyl RTU (amoxicillin) to swine. Unpublished report submitted to F by Pfizer Animal Health.
- Agerso H, Friis C (1998) Bio-availability of amoxicillin in pigs. Journal of Veterinary Pharmacology and Therapeutics 21(1): 41-46.
- Anadón A, Martinez-Larranaga MR, Diaz MJ, Bringas P, Fernandez MC, Martinez MA, Fernandez-Cruz ML (1996) Pharmacokinetics of amoxicillin in broiler chickens. Avian Pathology 25(3): 449-458.
- Anderson KL, Moats WA, Rushing JE, Wesen DP, Papich MG (1996) Ampicillin and amoxicillin residue detection in milk, using microbial receptor assay (Charm II) and liquid chromatography methods, after extra-label administration of the drugs to lactating cows. American Journal of Veterinary Research 57(1): 73-78. Ang CYW, Luo W, Call V, Righter HF (1997) Comparison of liquid chromatography with microbial inhibition assay for determination of incurred amoxicillin and ampicillin residues in milk. Journal of Agricultural and Food Chemistry 45(11): 4351-4356.
- Ang CYW, Liu FF, Lay JO Jr, Luo W, McKim K, et al. (2000) Liquid chromatography analysis of incurred amoxicillin residues in catfish muscle following oral administration of the drug, Journal of Agricultural and Food Chemistry 48(5): 1673-1677.
- Baggot JD () Undated. Pharmacokinetics of amoxicillin in dairy goats. Veterinary Pharmacology and Toxicology, School of Veterinary Medicine, University of California, Davis, California, USA.
- Barr FS (1977) Intramuscular infusion protocol. Trial 110. Milk levels of amoxicillin following intramuscular injection. Beecham Research Laboratories, Surrey, England. Unpublished report submitted to FAO by the U.S. Food and Drug Administration, Center for Veterinary Medicine.
- Becker M, Zittlau E, Petz M (2004) Residue analysis of 15 penicillins and cephalosporins in bovine muscle, kidney and milk by liquid chromatography-tandem mass spectrometry. Analytica Chimica Acta 520: 3286-3291.
- Bogialli S, Capitolino V, Curini R, di Corcia A, Nazzari M, Sergi M (2004) Simple and rapid liquid chromatography-tandem mass spectrometry confirmatory assay for determining amoxicillin and ampicillin in bovine tissues and milk. Journal of Agricultural and Food Chemistry 52(11): 3286-3291.
- Boison JO, Keng LJY (1998) Multiresidue liquid chromatographic method for determining residues of mono- and dibasic penicillins in bovine muscle tissues. Journal of AOAC International 81(6): 1113-1120.
- Bruno F, Curini R, Di Corcia A, Nazzari M, Samperi R (2001) Solid-phase extraction followed by liquid chromatography-mass spectrometry for trace determination of β-lactam antibiotics in bovine milk. Journal of Agricultural and Food Chemistry 49(7): 3463-3470. 29
- Buswell J, Barber DM (1989) Antibiotic persistence and tolerance in the lactating sheep following a course of intramammary therapy. British Veterinary Journal 145(6): 552-557.
- Buswell J, Knight CH, Barber DM (1989) Antibiotic persistence and tolerance in the lactating goat following intramammary therapy. Veterinary Record 125(11): 301-303.
- Buswell JF, Lay SJ (1974) Amoxicillin blood and milk level study in the lactating bovine following parenteral intramuscular injection. Beecham Research Laboratories, Surrey, England. Unpublished report submitted to FAO by the U.S. Food and Drug Administration, Center for Veterinary Medicine.
- Connolly P, Prough MJ, Lesman SP (2006a) Report 1531N-60-04-453. Determination of amoxicillin residues in bovine tissues after 5 i.m. injections of clamoxyl RTU (amoxicillin) at 7 mg/kg at 24-hour intervals. Unpublished report submitted to FAO by Pfizer Animal Health.
- Connolly P, Prough MJ, Lesman SP (2006b) Report 1531N-60-04-455. Depletion of tissue and milk residues following i.m. administration of clamoxyl RTU (amoxicillin) to cattle. Unpublished report submitted to FAO by Pfizer Animal Health.
- Craigmill AL, Pass MA, Wetzlich S (1992) Comparative pharmacokinetics of amoxicillin administered intravenously to sheep and goats. Journal of Veterinary Pharmacology and Therapeutics 15(1): 72-77.
- De Baere S, Cherlet M, Baert K, De Backer P (2002) Quantitative analysis of amoxycillin and its major metabolites in animal tissues by liquid chromatography combined with electrospray ionization tandem mass spectrometry. Analytical Chemistry 74(6): 1393-1401.
- De Baere S, Wassink P, Croubels S, De Boever S, Baert K, De Backer P (2005) Quantitative liquid chromatographic-mass spectrometric analysis of amoxycillin in broiler edible tissues. Analytica Chimica Acta 529: 221-227.
- Doran A, Adam G (2005) Report No. 1840N-03-03-154. Development and validation of an analytical method for the determination of amoxicillin in ovine liver, kidney, muscle, fat and milk. Unpublished report submitted to FAO by Pfizer Animal Health.
- Elsheikh HA, Taha AA, Khalafalla AE, Osman IA, Wasfi IA (1999) Pharmacokinetics of amoxicillin trihydrate in desert sheep and Nubian goats. V Veterinary Research Communications 23(8): 507-514.
- Escudero E, Carceles CM, Vicente S (1996) Pharmacokinetics of amoxicillin/clavulanic acid combination and both drugs alone after intravenous administration to goats, British Veterinary Journal 152(5): 551-559.
- European Commission (2002) Commission Decision 2002/657/EC of 12 August 2002, Implementing Council directive 96/23/EC concerning the performance of analytical methods and the interpretation of results. Official Journal of the European Union L221: 8-36.
- Fagerquist CK, Lightfield AR, Lehotay SJ (2005) Confirmatory and quantitative analysis of betalactam antibiotics in bovine kidney tissue by dispersive solid-phase extraction and liquid chromatographytandem mass spectrometry. Analytical Chemistry 77(5): 1473-1482.
- FDA (1999) Amoxicillin Injection for Sheep.
- FDA (2011) US CFR, Title 21 Sections 520 and 522, 2010.
- Fernandez C, Modamio P, Mestorino N, Errecalde JO, Mariño EL (2007) Pharmacokinetics of sodium and trihydrate amoxicillin in sheep after intravenous and intramuscular administration. Journal of Veterinary Pharmacology and Therapeutics 30(3): 263-266.
- Freitas A, Barbosa J, Ramos F (2011) In press. Determination of amoxicillin stability in chicken meat by liquid chromatography-tandem mass spectrometry. Food Analytical Methods, in press 5(3).
- Fujiwara K, Shin M, Miyazaki T, Maruta Y (2011) Immunocytochemistry for amoxicillin and its use for studying uptake of the drug in the intestine, liver, and kidney of rats. Antimicrobial Agents and Chemotherapy 55(1): 62-71.
- Granelli K, Branzel C (2007) Rapid multi-residue screening of antibiotics in muscle and kidney by liquid chromatography-electrospray ionization-tandem mass spectrometry. Analytica Chimica Acta, 586(1-2): 289-295.
- Haginaka J, Wakai J (1987) Liquid chromatographic determination of amoxicillin and its metabolites in human urine by post-column degradation with sodium hypochlorite. Journal of Chromatography 413: 219-226.
- Hernandez E, Rey R, Puig M, Garcia MA, Solans C, et al. (2005) Pharmacokinetics and residues of a new oral amoxicillin formulation in piglets: preliminary study. Veterinary Journal 170(2): 237-242.
- Hong CC, Lin, CL, Tsai CE, Kondo F (1995) Simultaneous identification and determination of residual penicillins by use of high-performance liquid chromatography with spectrophotometric or fluorometric detectors. American Journal of Veterinary Research 56(3): 297-303.
- Keefe TJ (1976a) Tissue protocol. Trial 100. Non-ruminating calves. Beecham Research Laboratories, Surrey, England. Unpublished report submitted to FAO by the U.S. Food and Drug Administration, Center for Veterinary Medicine.
- Keefe TJ (1976b) Tissue protocol. Trial 103. Non-ruminating calves. Beecham Research Laboratories, Surrey, England. Unpublished report submitted to FAO by the U.S. Food and Drug Administration, Center for Veterinary Medicine.
- Keefe TJ (1976c) Tissue residue protocol. Trial 105. Non-ruminating calves. Beecham Research Laboratories, Surrey, England. Unpublished report submitted to FAO by the U.S. Food and Drug Administration, Center for Veterinary Medicine.
- Keefe TJ (1976d) Intramuscular infusion protocol. Trial 111. Normal lactating cows. Beecham Research Laboratories, Surrey, England. Unpublished report submitted to FAO by the U.S. Food and Drug Administration, Center for Veterinary Medicine.
- El-Tabl, AS Abdelwahed, MM, Mohamed Medhat Gharieb, Hagar Said Hemida, Shaimaa Mohamed Faheem (2020) Synthesis, Structural Characterization and Antimicrobial Study on Metal Complexes of New Bioactive Ligand with Terminal Wings, Journal of Chemistry and Chemical Sciences 10(2): 65-85.


