Computational Methods for Volumetric Image Analysis in the Study of Cardiac Arrhythmias
D V Zatsarinny1,2, V N Belyaev1 and AY Popov2
1NRNU MEPhI, Moscow, Russia
2MeditekLTD, Moscow, Russia
Submission:January 25, 2025; Published: January 31, 2025
*Corresponding author:D V Zatsarinny, NRNU MEPhI, Moscow, Russia. Curr Trends
How to cite this article:D V Zatsarinny, V N Belyaev, AY Popov. Computational Methods for Volumetric Image Analysis in the Study of Cardiac Arrhythmias. Curr Trends Biomedical Eng & Biosci. 2025; 23(2): 556110.DOI:10.19080/CTBEB.2025.23.556110
Abstract
This study explores the application of automated algorithms for the precise segmentation of cardiac chambers from chest CT imagery. The resulting segmented volumes are converted to surface representations suitable for import into intracardiac analysis systems, supporting the overlay of electroanatomical information and ablation targets. Our investigations demonstrate that these algorithms reduce procedure duration through automated tomogram processing, while simultaneously improving surgical visualization of the relevant cardiac anatomy.
Keywords: arrhythmology, electrophysiologic study (EP), cardiac mapping, computer tomogram (CT) processing, Hounsfield scale.
Introduction
The role of visualization in medicine is a critical component of accurate and timely patient treatment. Within the field of modern arrhythmology, visualization techniques are not only beneficial but considered essential for complex intracardiac interventions, particularly for minimally invasive procedures focused on treating complex rhythm disorders, including atrial fibrillation (AF). It’s important to note that AF is the most common arrhythmia in the adult population [1]. This rhythm disturbance can lead to several life-threatening complications such as embolisms in both the central and systemic circulation, heart failure, a reduction in quality of life, and dementia [2-3]. These conditions emerge when myocardial cells undergo asynchronous excitation, disrupting the normal sinus rhythm of the heart. The diagnosis and treatment of AF and other arrhythmias frequently utilize electrophysiological studies (EP) followed by radiofrequency ablation (RFA). During these procedures, an electrophysiologist employs catheters with navigation systems to construct electroanatomical maps. Analyzing the propagation of electrical impulses allows for targeted ablation of the localized arrhythmia sites [4,5].
Existing intracardiac mapping techniques, relying on indirect data sources like electroimpedance and magnetic navigation, often produce inaccurate cardiac chamber models. This leads to significant procedural recurrence rates—approximately 12% of patients require repeat radiofrequency ablation (RFA) due to atrial fibrillation (AF) relapse [6]. To address this, we present algorithms that process computed tomography (CT) images to generate precise cardiac chamber surface models. This approach improves the accuracy of endocardial mapping by synchronizing CT-derived anatomical information with intraprocedural data, reducing the need for repeat RFAs [7-10]. Since pre- and post-RFA CT scans are standard practice [11], this method can be readily integrated into clinical workflows.
Conducting intracardiac studies across diverse medical equipment platforms presents integration hurdles. While closed system integration is generally infeasible, the Astrocard-CardioEfi2 system (JSC Meditek, Russia) provided a unique opportunity due to developer collaboration, and being the only Russian-made complex suitable for such research. Therefore, our algorithms were integrated into this specific system. Patient tomographic data obtained from the JSC Meditek archive were used for this research.
Materials and methods
The study’s initial dataset comprised patient CT scans, stored in DICOM format. Each scan’s volumetric data was represented by a 512x512x512 array of voxels, with values ranging from 0 to 2000 units. These values are a linear transformation of Hounsfield units (HU), shifted by +1000 HU [12]. Density distributions are visualized using histograms, in which the horizontal axis represents the HU scale (from -1000 to +1000) and the vertical axis shows the number of voxels at each density. Such histograms for each patient show multiple peaks corresponding to distinct tissue types (Figure1)
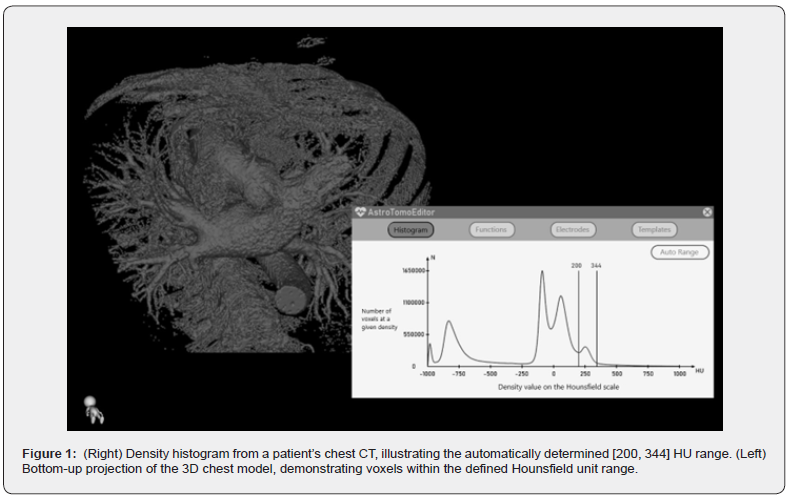
The generation of the heart’s volumetric model starts with analyzing the outermost peak on the CT density histogram. In contrast-enhanced CT, the region representing iodine uptake will lead to a peak located on the right; in non-contrast CT, the appropriate peak reflecting the density of muscle and blood will be on the left. Iodine-containing contrast agents are commonly used due to the enhanced photoelectric and Compton effects in areas of accumulation, arising from the high atomic number of iodine during CT imaging [13].
Analysis of CT density histograms from over 300 patients revealed variability in peak positions across a certain range. The inherent differences in peak height, width, and position across patients rendered static visualization thresholds ineffective for accurate results. Interpolation and statistical analysis, using cubic spline methods, indicated that the right flank of the target peak could be well approximated by a Gaussian function. The left flank, conversely, exhibited alignment with the preceding peak and broadened with increasing overall graph values. The Gaussian nature of these peaks is attributed to the contrast agent’s initial, near-delta function-like distribution of density within the body, which expands to take on a Gaussian distribution during CT imaging.
Statistical analysis, using standard deviation, defined peak position boundaries as 168 HU ± 36 HU (left) and 430 HU ± 73 HU (right). Individual patient visualization ranges were subsequently obtained by fitting Gaussian functions to these ranges.
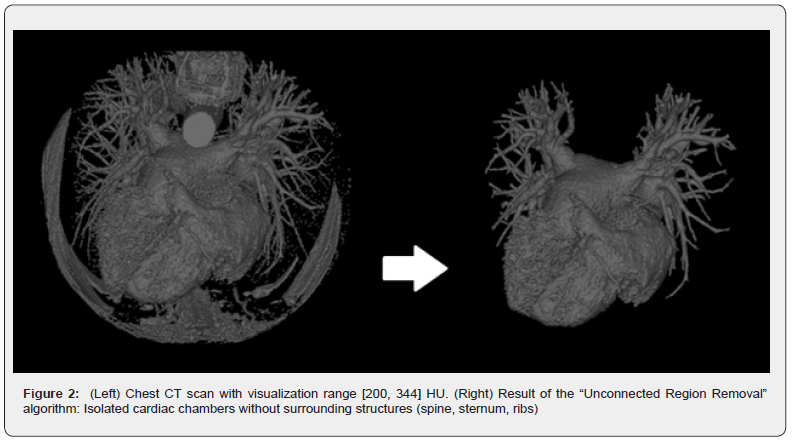
Having automatically selected the density range, further processing is necessary to isolate the 3D surface of the desired cardiac chamber. This involves using algorithms such as the ‘Removing Unconnected Regions’ algorithm, which functions by separating discrete volumes from each other using a single surface point. Starting from an input point on the target surface, the algorithm identifies all connected voxels and returns that volume for visualization, discarding remaining regions (Figure 2).
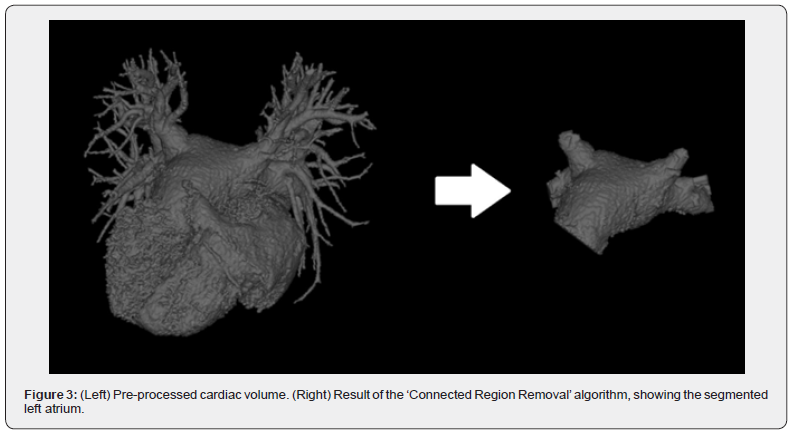
The ‘Connected Region Removal’ algorithm, an essential component of tomographic processing, initiates with a point on the surface of the desired heart chamber. This algorithm begins by counting all voxels, then it identifies and removes surface voxels, after which the ‘Unconnected Region Removal’ algorithm is applied. Subsequently, the algorithm performs a count of the remaining voxels, repeating this sequence until a single nonempty voxel is left. The core functionality involves analyzing the voxel count at each iterative step. A significant reduction signals the detachment of a connected region, which is then reconstructed around the central point based on the number of iterations. This iterative strategy results in the automated elimination of neighboring heart chambers.
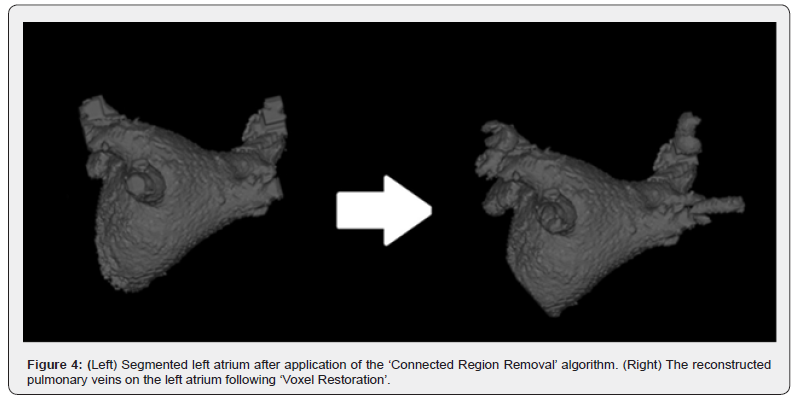
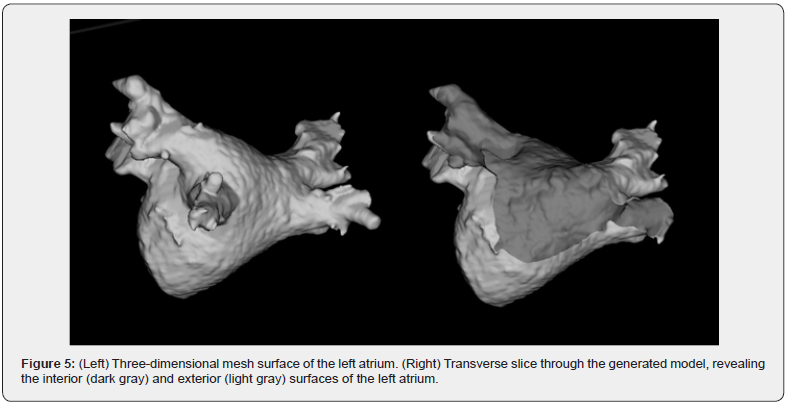
‘Voxel Restoration’ represents a crucial subsequent algorithm for working with the models obtained in the previous step. When this algorithm is initiated, a backup copy of the input file is created. ‘Voxel Restoration’ permits the selective reconstruction of removed, connected elements within a user-defined radius. This is facilitated by accessing the saved copy. For instance, it can reinstate the pulmonary veins on the anatomical model of the left atrium, parts of which could have been eliminated by the ‘Connected Region Removal’ algorithm.
“The image is exported as an STL surface mesh.” (This option implies the conversion is implicit in the export process).
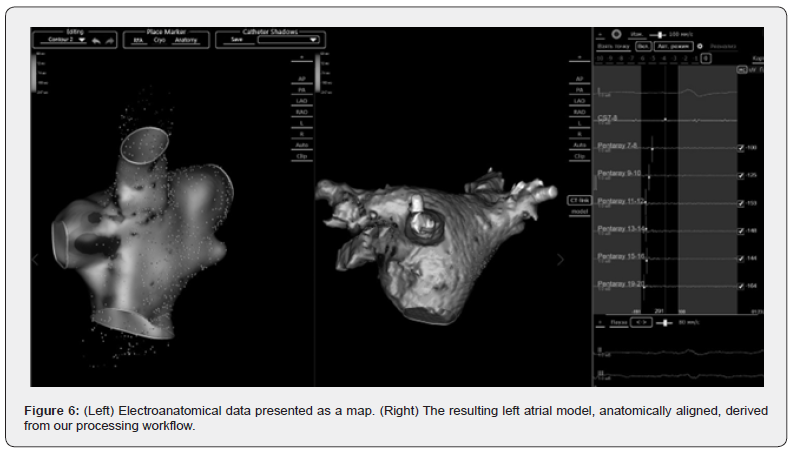
CT-derived segmentation results are synchronized with electroanatomical maps to enhance mapping accuracy. This synchronization is achieved by selecting at least four corresponding points on both the electroimpedance-based map and the processed surface model. These four point-pairs define a transformation matrix that maps one coordinate system to the other, ensuring proper spatial registration and scaling. The electrical data are then projected onto the more accurate CTbased anatomical model during EPS and before RFA treatment.
Results
The developed automated image processing algorithms were deployed at the arrhythmia center of the A.V. Vishnevsky National Medical Research Center of Surgery during surgical treatment of complex cardiac arrhythmias. This method has been successfully implemented in over 300 operations, significantly reducing the time required for tomographic image processing during procedures without compromising image quality. The system supports both contrast-enhanced and non-contrast CT images. The improved accuracy of the surgical procedures due to visualization of the precise anatomical model during the operation enables more precise ablation.
References
- Wolf PA, Abbott RD, Kannel WB (1991) Atrial fibrillation as an independent risk factor for stroke: the framingham study // Stroke Journal 22(8): 983-988.
- Joglar JA, Chung MK, Armbruster AL, Emelia BJ, Janice YC, et al.(2023) ACC/AHA/ACCP/HRS Guideline for the Diagnosis and Management of Atrial Fibrillation: A Report of the American College of Cardiology/American Heart Association Joint Committee on Clinical Practice Guidelines // Circulation p149.
- Kimura K, Minematsu K, Yamaguchi T (2005) Atrial fibrillation as a predictive factor for severe stroke and early death in 15,831 patients with acute ischaemic stroke // Journal of Neurology, Neurosurgery and Psychiatry 76(5): 679.
- Malakhov AI, Tikhomirov AN, Shchukin SI, Kudashov IA, Kobelev AV, et al.(2016) Electroimpedance Methods of Investigation of Cardiac Activity // Kardiologiia 56(12): 33-39.
- Beloborodov VV, Shabanov VV, Elemesov NA et al. (2022) Robotizirovannaya magnitnaya navigaciya pri lechenii pacientov s fibrillyaciej predserdij // Patologiya krovoobrashcheniya i kardiohirurgiya 26(1): 24.
- Selyuckij SI, Savina NM, Chapurnyh AV (2020) Ocenka effektivnosti radiochastotnoj ablacii i povtornoj kardioversii v sochetanii s antiaritmicheskoj terapiej v podderzhanii ustojchivogo sinusovogo ritma u pacientov s fibrillyaciej predserdij i serdechnoj nedostatochnost'yu // Kardiologiya 60(8): 90.
- Shenasa M, Razavi S, Shenasa H,Al-Ahmad A (2019) The Ideal Cardiac Mapping System // Cardiac Epidemiology Clinics 11(4): 739.
- Zou S, Jia R, Zhou X, Hao Y, LuS, et al.(2020) Merging three-dimensional CT with electroanatomic mapping facilitates ablation of ventricular arrhythmias originating from aortic root and great cardiac vein // Journal of Interventional Cardiac Electrophysiology 60(1): 101-108.
- Fritz D, Rinck D, Unterhinninghofen R, Dillmann R, Scheuering M (2005) Automatic segmentation of the left ventricle and computation of diagnostic parameters using region growing and a statistical model // SPIE Medical Imaging 5747: 1844.
- Friberg J, Buch P, Scharling H, Gadsbphioll N, Jensen GB (2003) Rising rates of hospital admissions for atrial fibrillation // Epidemiology 14(6): 666-672.
- Kolandaivelu A (2012) Role of cardiac imaging (CT/MR) before and after RF catheter ablation in patients with atrial fibrillation // Journal of Atrial Fibrillation 5(2): 523.
- Hounsfield G(1973) Computerized transverse axial scanning (tomography): Part I. Description of system // British Journal of Radiology 46(552): 1016-1022.
- Esquivel A, Ferrero A, Mileto A, Baffour F, Horst K, et al.(2022) Photon-Counting Detector CT: Key Points Radiologists Should Know // Korean Journal of Radiology 23(9): 854-865.


