Development and Validation of RP-HPLC Method for the Quantitative Analysis of Bempedoic acid in Bulk and Pharmaceutical Dosage form Using Surface Response Methodology
Sai Datri A1*, Nataraj KS2 and Lakshmana Rao A3
1Research Scholar, University College of Pharmaceutical Sciences, Andhra University, India
2Professor and Principal, Shri Vishnu College of Pharmacy, India
3Professor and Principal, V V Institute of Pharmaceutical Sciences, India
Submission:June 02, 2023; Published:June 15, 2023
*Corresponding author:Sai Datri A, Research Scholar, University College of Pharmaceutical Sciences, Andhra University, Visakhapatnam, Indias
How to cite this article:Sai Datri A, Nataraj KS, Lakshmana Rao A. Development and Validation of RP-HPLC Method for the Quantitative Analysis of Bempedoic acid in Bulk and Pharmaceutical Dosage form Using Surface Response Methodology. Curr Trends Biomedical Eng & Biosci. 2023; 21(4): 556066 DOI:10.19080/CTBEB.2023.21.556066
Abstract
Objectives: A specific and novel RP-HPLC method has been optimized for the quantitative analysis of bempedoic acid using response surface methodology.
Method: Response surface methodology (RSM) helps in studying the empirical relationship between one or more measured responses and many independent variables in the form of a polynomial equation. Mapping of those responses related to the experimental domain helps in generating an optimized method. In this present study, the empirical relationship between measured responses like % organic phase, column temperature, and flow rate and independent variables like retention time and theoretical plates are drawn in the form of a polynomial equation and an optimized method was developed from that using Box-Behnken Design (BBD).
Results: The analytes chromatogram was run through SB C18 100x1.8mm, 2μm. The optimized data from Design Expert software consists of 0.01% OPA: Acetonitrile (56.05:43.95%, v/v) as mobile phase pumped through column with 1.02ml/min flow rate at 30.09°C gave highest desirable function of 1. The retention times of the drug were found to be 2.231 min. The optimized method was validated as per instructions given in ICH Q2 (R1) guidelines.
Conclusion: Based on the results of the analysis of variance, the selected model for the responses like retention time and tailing factor were found to be significant with p=0.05. 2D contour plots were inured to visualize the effect of factors and their interactions on the response. Validation of design was done using actual plots vs. predicted values for responses. All the validation parameter results were within limit.c
Introduction
Bempedoic Acid [1] is marked under the brand name Nexletol, which is a prodrug approved for the treatment of hypercholestrerolemia. Generally, this drug requires activation in the liver, the very long chain acyl-CoA Synthetase-1 enzyme helps for the activation of the drug as BETC-1002-CoA, the active metabolite of the drug. ATP synthase (properly known as ATP lyase) is responsible for the synthesis of cholesterol. The active metabolite of the drug i.e., BETC-1002-CoA directly inhibits the activity of ATP synthase which leads to up-regulation of the LDL cholesterol receptor and that reduces serum LDL-C through increased uptake and clearance of LDL in the liver. The IUPAC name of the drug is 8-hydroxy-2,214,14-tetra methyl pentadecanedoic acid and the chemical structure of the drug is shown in (Figure1). Since this drug was approved by FDA in February 2020, till this time no analytical method was reported for the estimation of bempedoic acid alone, even though the methods are available for combination of drug. Only phase studies [2] were done to know the safety and efficacy of the drug. Hence the present work was focused on the development and validation of determination of bempedoic acid by using RSM with the help of Design Expert software [3]. This approach helps in good experimental designs, risk assessment, ruggedness, and robustness testing in much more dynamic when compared with the general approach. For the assortment of initial chromatographic conditions, a 23 factorial design [4] was selected with three factors at two levels in RSM [5]. RSM helps in studying the empirical relationship between one or more measured responses and several independent variables in the form of a polynomial equation. Mapping of those responses related to the experimental domain helps in generating an optimized method. Optimization of the method for the present study was done with the help of the Box-Behnken design [6], which is the most popular statistical experimental design used in RSM.

Materials And Methods
Bempedoic acid is gifted from Spectrum Labs. Acetonitrile, phosphate buffer, methanol, potassium dihydrogen orthophosphate buffer, and orthophosphoric acid are purchased from Rankem. The formulation Nexletol (Bempedoic acid 180mg) was brought from the local market. Water HPLC 2695 system with photodiode array detector integrated with Empower 2 software is used for HPLC study. Design Expert® (13.0.5.0x64) modeling software (Stat-Ease Inc., Minneapolis, MN, USA) was worn for the production of 2D contour plots and 3D surface plots.
0.1%OPA Buffer: Take 1 ml of orthophosphoric acid and diluted it to 1000 ml with HPLC grade water.
Preparation of Mobile Phase: The mobile phase was ready by adding HPLC grade acetonitrile and 0.1% OPA in the ratio of 50:50.
Preparation of Diluent: HPLC grade acetonitrile and water in the ratio of 50:50 is used as diluent.
Preparation of Standard Stock Solutions: The standard stock solution of bempedoic acid was prepared by accurately weighing 180mg of bempedoic acid and transferred to 200ml volumetric flasks and add 3/4th of diluents to this flask and sonicate the solution for 10 minutes. Final volume was made up of diluents. One milliliter of the above prepared solution was transferred to a 10-ml volumetric flask, and then final volume was made with a diluent (standard solution). The stock solution was diluted as per the requirement.
Preparation of Sample Solution: Five tablets (Nexletol) were weighed and crushed. Quantity of powder equivalent to 180mg of bempedoic acid was taken in a 200ml volumetric flask, and 3/4th of diluents was added to this flask, sonicated it for 10 min and the final volume was made up with diluent. The prepared solution was filtered through a 0.45μm membrane filter and further diluted as per requirement.
Optimized Chromatographic Conditions: The initial trials are required to optimize the final method. Chromatographic separation was accomplished on SB C18 100x1.8mm, 2μm column at 30.09°C. A mixture 0.01% OPA: Acetonitrile (56.05:43.95%, v/v) was used a mobile phase with a flow rate of 1.02ml/min. The detection of chromatogram was done at 220nm of UV.
Experimental Design: The method was optimized using Box- Behnken design. Total 3 factors i.e., % organic content, temperature of the column and flow rate were optimized. Hence, Box-Behnken design was used to optimize these parameters at three levels (high, mid, and low). Different ranges of three parameters 40- 60% acetonitrile, column temperature 27-33°C and flow rate of 0.9-1.1ml/min were considered as shown in (Table 1).

Method Validation: The validation of the optimized analytical method was done as per the guidelines of International Conference on Harmonization Q2(R1) [7].
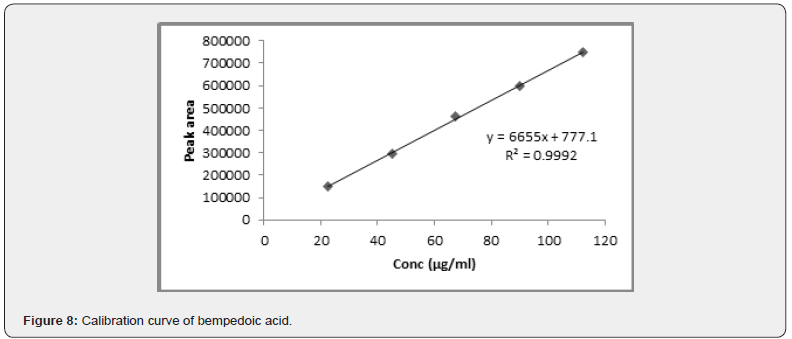
Linearity: Standard calibration curve was prepared with five different concentrations over the range of 22.5-112.5μg/ ml. Linear calibration curve was generated between peak area and drug concentration. The linearity was examined using linear regression, which was calculated by the least square regression method shown in the (Figure 8).
Accuracy: Accuracy was performed by adding known amount of sample to the 0.5ml, 1.0ml and 1.5ml of 900μg/ml standard solution of the drug which gives 50%, 100%, and 150% levels. The assessment is performed in triplicate by the optimized method. Percentage recovery was measured.
Precision: Precision of the optimized method was measured by studying the system, method, and intermediate precision. Six 67.5μg/ml standard solutions of pharmaceutical formulation were injected on the same day and next day of the preparation of samples and the % RSD of the peak area was calculated.
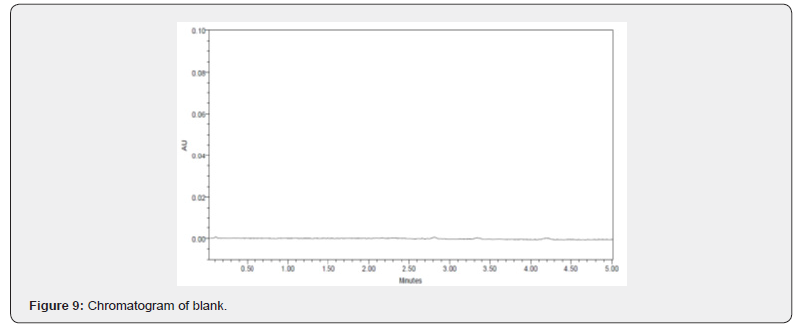
Specificity: The specificity was deliberate by injecting the blank, placebo, and pharmaceutical preparation of drug, several times on several days. It was revealed that there was no interference of peak in the region of Bempadoic Acid in chromatogram for the blank, and placebo. Representative chromatograms of blank, placebo, and drug standard are shown in (Figures 9&10).
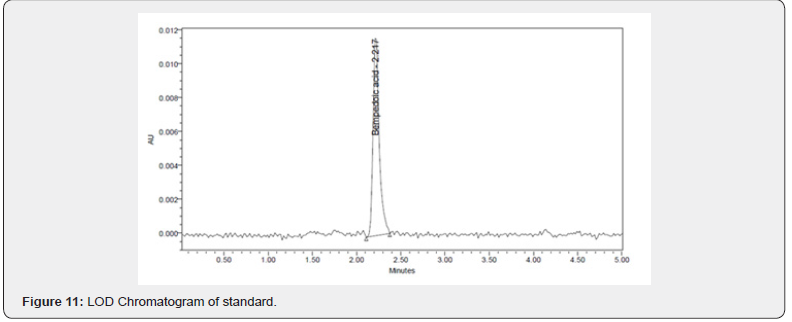
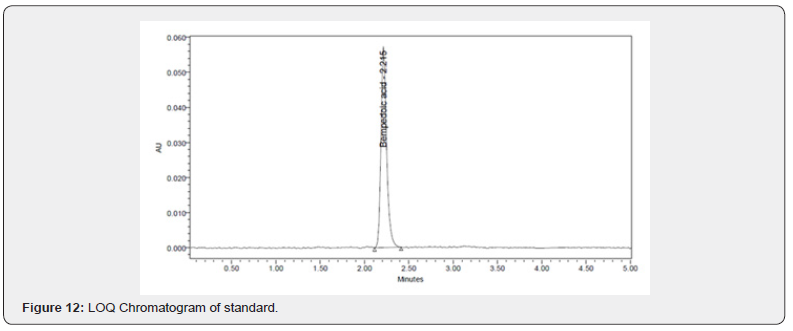
Limits of detection (LOD) and limits of quantitation (LOQ): LOD and LOQ values were calculated from the signal-tonoise ratio method and the chromatograms are shown in (Figure 11&12).
Robustness: To verify the method effectiveness when minor changes occurred in optimized method parameters made such as proportion of organic concentration in the mobile phase (40- 60%), flow rate (0.9-1.1ml/min), and temperature of the column (25-35°C). %RSD of the mentioned conditions was calculated.
System suitability: The system suitability was measured by taking six replicates of the drug at same concentration i.e.,67.5μg/ ml. The acceptance criteria were ± 2% for all the components such as the percent coefficient of variation (% CV) for the peak area, retention time of drug, USP theoretical plate number, and tailing factor.
Forced degradation studies [8]
Acid hydrolysis: To 1ml of stock solution of the pharmaceutical formulation add 1ml of 2N HCl. The resulting solution was placed in radley apparatus for reflux with constant stirring at 70°C for 60 min. The refluxed solution was neutralized with 2N NaOH and diluted up to 10ml with mobile phase.
Base hydrolysis: To 1ml of stock solution of the pharmaceutical formulation add 1ml of 2N NaOH solution. The degradation solution was placed in radley apparatus for reflux with constant stirring at 70°C for 60 min. The refluxed solution was neutralized with 2N HCl and diluted up to 10ml with mobile phase.
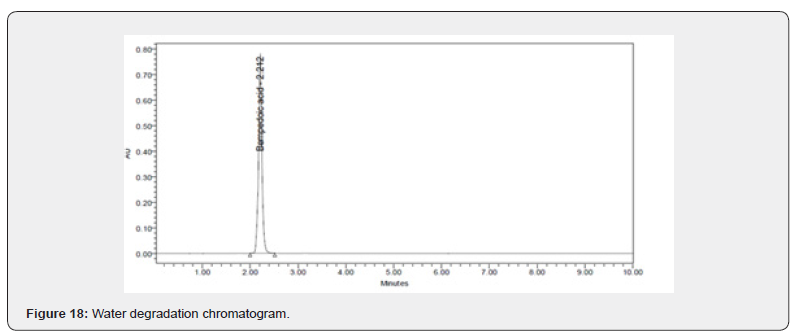
Neutral hydrolysis: Dilute 1ml of stock solution of the pharmaceutical formulation to 10ml with HPLC grade water. The degradation solution was placed in radley apparatus for reflux with constant stirring at 70°C for 4h.
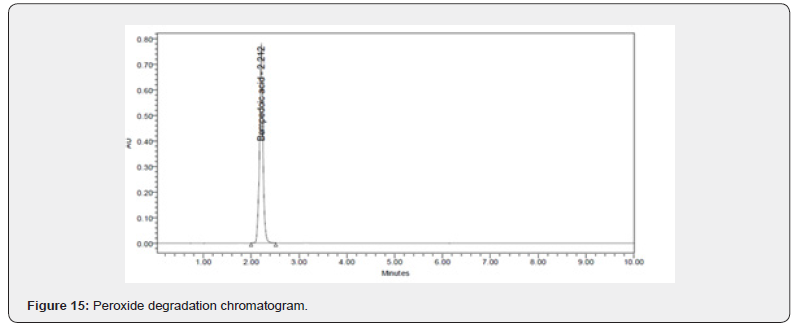
Oxidative study: To 1ml of stock solution of the pharmaceutical formulation add 1ml of 20% H2O2 solution. Then the degradation sample was set aside in dark area without interruption at room temperature for 4h and dilutes the solution up to 10ml with mobile phase.
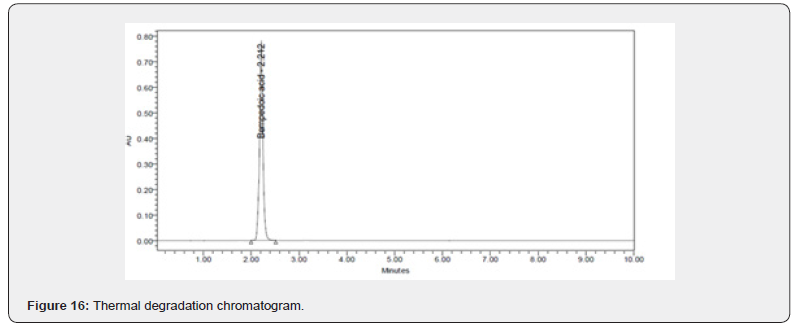
Thermal degradation: The powdered form of pharmaceutical formulation was place in hot air oven at 70°C for 60 min. The dilution of the pharmaceutical formulation was done with mobile phase and analyzed that using the HPLC system.

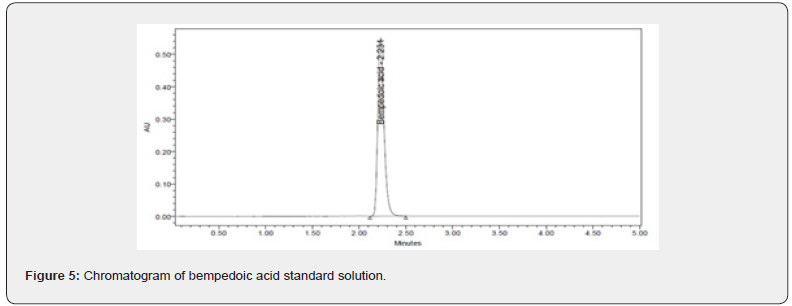
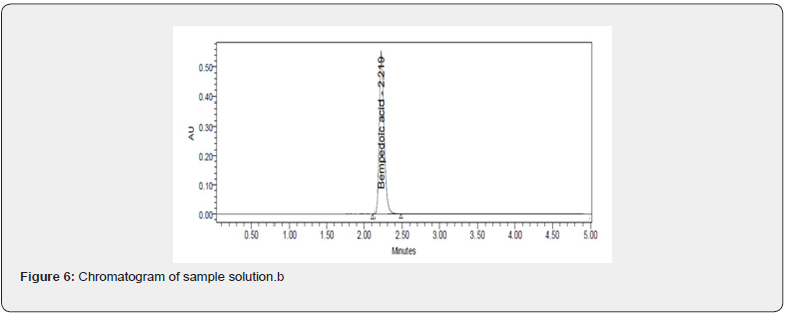
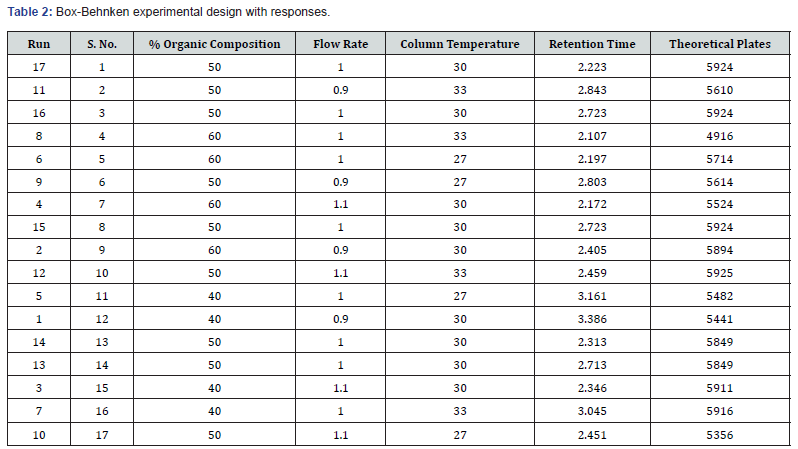
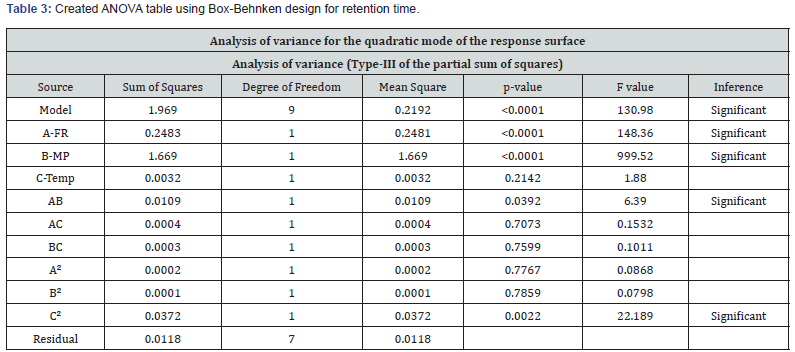

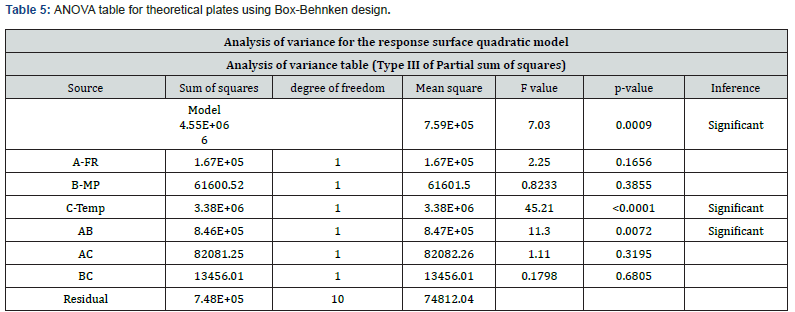
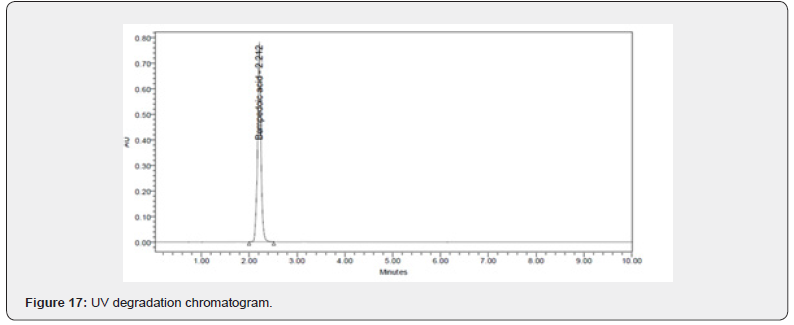
Photo degradation: The powdered form of pharmaceutical formulation was evenly spread in a petri dish and was exposed to UV light with NLT 2000 lux power intensity for 24h. The dilution of the powdered form of pharmaceutical formulation was done with mobile phase and analyzed that using the HPLC system.


Results
Statistical analysis of experimental data by designexpert software
ANOVA was used to study the significance level of the model. The Model F-value of 130.98 implies the model is significant for the responses retention time and theoretical plates given in the (Tables 3-5). There is only a 0.01% possibility that an F-value this large could occur due to noise. p<0.0500 shows that model terms are significant. In this case, A, B, AB and C² are significant model terms.
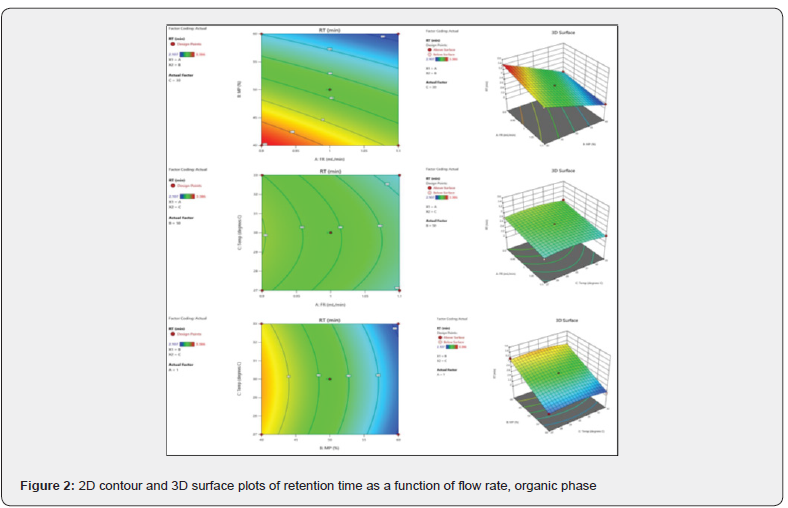
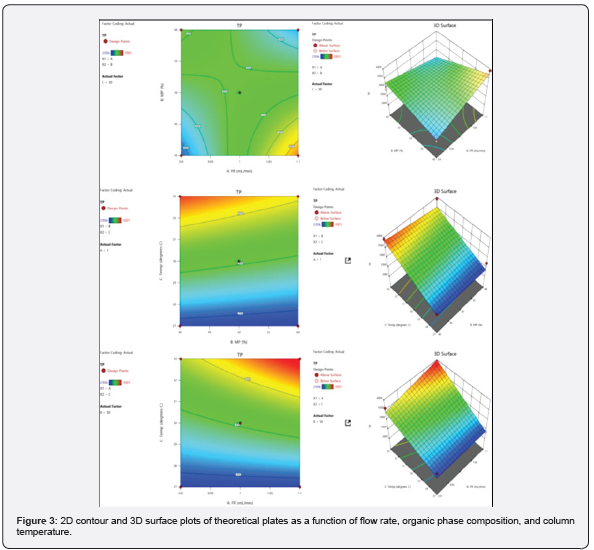
The predicted R² of 0.9089 is in reasonable harmony with the adjusted R² of 0.9869; that is, the variation is less than 0.2. Adequate precision determines the signal-to-noise ratio. A ratio more than 4 is desirable. S/N ratio of 60.55 indicates an adequate signal presented in the (Table 4). This model can be helped to navigate the design space. 2D contour and 3D surface plots were studied to visualize the effect of factors and their effects on the responses using the Design Expert® software. The region in dark blue represents lower values and with dark red represents higher values. The regions in light blue, green, and yellow represent intermediary values.
By considering the above 2D Contour and 3D surface plots of retention time shown in (Figure 2), it was established that at a higher flow rate, higher temperature, and higher organic phase composition lower will be the value of retention time.
The Model F-value of 7.03 implies the model is significant. There is only a 0.09% chance that an F-value this large could occur due to noise. p<0.0500 indicates that model terms are significant. In this case, C and AB are significant model terms.
The predicted R² of 0.9275 is in sensible agreement with the adjusted R² of 0.9012; that is, the variation is less than 0.2. Adequate precision determines the signal-to-noise ratio. A ratio more than 4 is desirable. S/N ratio of 9.67 indicates an adequate signal. This model can be used to plot a route to the design space given in the (Table 6).
By considering the above 2D contour and 3D surface plots of theoretical plates shown in (Figure 3), it was found that at a higher temperature, higher flow rate, and lower the organic phase composition higher will be the value of theoretical plates.
Design validation
From the normal plot of studentized residuals for the two responses represented in (Figure 4), it was observed that the selected models for the respective responses were fit for the selected design as these plots represents straight line. It was further concluded from the (Tables 3&4) that the selected models were significant with p<0.05. Hence, the selected models were fit for the design engaged in this work.
Optimization by desirability function
Desirability was applied to get an optimum set of conditions based on the particular goals and limitations for each response. This desirability function relays on a scale of desirability function ranges between d = 0 for a totally undesirable response, to d = 1 for a completely desirable response. Based on the particular goals and limitations for the retention time (minimum) and theoretical plates (maximum) a composite desirability (D) was obtained at 1. To validate these optimum set of conditions given in the (Table 7), three replicate injections of drug were analyzed to measure if their experimental retention time and theoretical plates were within the predicted ranges shown in the (Table 8) and the corresponding optimized standard and sample chromatograms were shown in the (Figures 5 & 6) respectively.
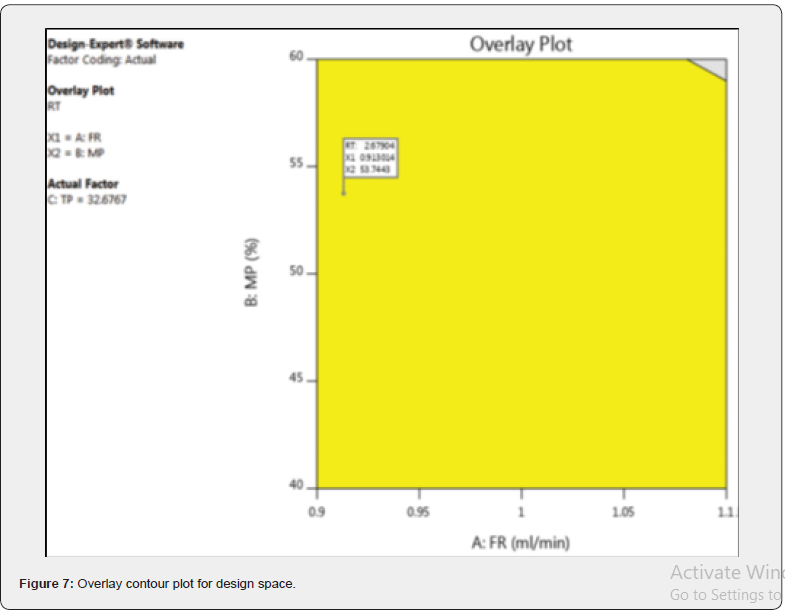
Over lay plot
The overlay counter plot presents the QbD design space where the method obeys the mean performance goals and robustness criteria shown in (Figure 7). The flag represents optimized permutation of the three selected independent factors, which helps to set desirability of minimum retention time and maximum theoretical plates.
Method validation
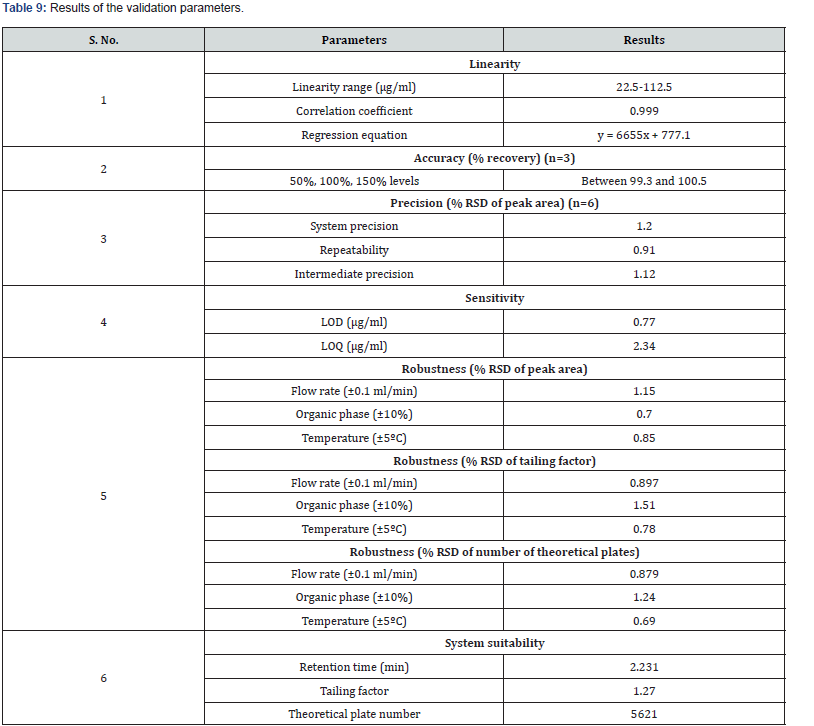
The method was linear over the concentration range of 22.5- 112.5μg/ml with correlation coefficient of 0.999. For the accuracy studies was performed at 50, 100, and 150% levels and the % drug recovery was noted to be within 99.3-100.5%. Intermediate precision and repeatability were performed, and the % RSD values were less than 2%. LOD and LOQ values were found to be 0.77μg/ ml and 2.34μg/ml. Robustness of the method was done by making slight changes in the experimental conditions such as % organic composition, flow rate, and temperature and % RSD values were observed at less than 2%. The summary data of the method validation parameters is shown in (Table 9).
Forced degradation studies
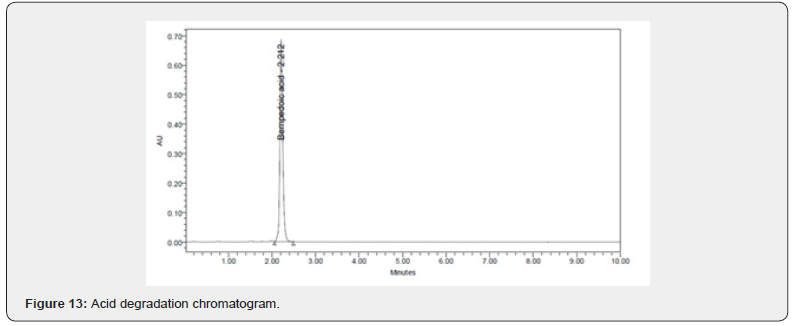
Forced degradation studies were done at various conditions such as acidic, basic, peroxide, thermal, photolytic, and hydrolytic. Results of forced degradation studies are given in Table 10 and the chromatograms are shown in (Figures 13-18).


Discussion
A simple, sensitive, robust, accurate, and precise RP-HPLC method was developed for the determination of bempedoic acid using the Response Surface Methodology. The % of organic content in the mobile phase, Column temperature, and flow rate were selected as Critical Method Parameters for Critical Quality Attributes i.e., retention time and theoretical plates. The Critical Method Parameters were analytically optimized using the Box- Behnken design. Mobile phase 0.1 % OPA (46.3%): Acetonitrile (53.7%), pumped at a flow rate of 1.02ml / min is finalized as optimized chromatographic conditions. The significant factors impacting each response were identified using 2D contour and 3D surface plot. The ANOVA test was applied to acquire the p value, R2, and the equations for each response by including only significant terms. Utilization of RSM delivers a better awareness of method development. The retention time of the drug for the developed method was found to be 2.231 min. Theoretical plates and tailing factor was found to be within the limits. The validation of the developed method was done as per the ICH Q2 (R1) guidelines Degradation studies for the developed method were performed in various stress conditions, which was started with a shorter duration of exposure (in case of acidic, basic, and oxidative stress), but the drug did not exhibit much deterioration; therefore, the duration of the exposure was extended to produce a significant level of degradation. Here, comparatively more degradation was observed under acidic conditions due to hydrolysis of the drug. Under long-wavelength UV exposure (photolysis 24 h) and moist heat at 70 °C (thermal degradation 24 h), the drug has shown less degradation. Our approach has shown better quantification of the drug in different stress conditions due to the improved peak shape and absence of interference at the retention time of the drug. The Bempadoic Acid showed minimum degradation in all stress conditions except with acid-induced hydrolysis.

Conclusion
Based on the results of the Analysis of variance, the selected model for the responses like retention time and tailing factor were found to be significant with p=0.05. 2D contour plots were inured to visualize the effect of factors and their interactions on the response. Validation of design was done using actual plots vs. predicted values for responses. All the validation parameter results were within limit.
Acknowledgement
The authors are grateful to Spectrum Pharma Research Solutions., Hyderabad for providing gift samples, and the authors are also obliged to V. V. Institute of Pharmaceutical Science, Gudlavalleru for providing the necessary facilities to carry out the research work.


