


Importance of Considering the Isotonic System Hypothesis When Modelling the Self-Control of Gene Expression Regulatory Modules in Living Cells
Gheorghe Maria1*, Cristiana Luminita Gijiu1, Cristina Maria2, Carmen Tociu2 and Marina Mihalachi1
1Department of Chemical & Biochemical Engineering, University Politehnica of Bucharest, Romania
2National Institute for Research and Development in Environmental Protection, Romania
Submission: February 12, 2017; Published: February 16, 2018
*Corresponding author: Gheorghe Maria, Department of Chemical and Biochemical Engineering, University Politehnica of Bucharest, Polizu Str. 1-7, 011061, Bucharest, Romania, Email: gmaria99m@hotmail.com
How to cite this article: Maria G., Gijiu L.C., Maria C., Tociu C., Mihalachi M. Importance of Considering the Isotonic System Hypothesis When Modelling the Self-Control of Gene Expression Regulatory Modules in Living Cells. Curr Trends Biomedical Eng & Biosci. 2018; 12(2): 555833. DOI: 10.19080/CTBEB.2018.12.555833.
Abstract
Systems Biology is one of the modern tools, which uses advanced mathematical simulation models for in-silico design microorganisms that possess desired characteristics. The deterministic models developed to simulate the cell metabolism biochemistry, are based on a hypothetical (reduced) reaction mechanism, of known kinetics and stoichiometry. A central part of such models concerns the adequate simulation of the protein synthesis homeostatic self-regulation present in any gene expression regulatory module (GERM) that produces enzymes controlling the whole cell metabolism with negative feedback loops and rapid adjustments of the enzymatic activity. However, classical formulations by using the default Constant Volume Whole-Cell (CVWC) continuous variable ordinary differential (ODE) dynamic models do not explicitly consider the cell volume exponential increase during the cell growth leading to biased and distorted conclusions on GERM regulatory performances. This paper exemplifies the overwhelming importance of using a holistic variable-volume whole-cell (VVWC) modelling framework with explicitly including constraints accounting for the cell-volume growth while preserving a constant osmotic pressure and membrane integrity. To point-out the discrepancy between the two simulation approaches, the comparison is made in the case of a simple generic GERM from the E. coli cell, by mimicking the cell homeostasis and its response to dynamic perturbations.
Keywords: kinetic modelling; Cell protein synthesis control; Homeostatic regulation; Gene expression regulatory modules (GERM); Variable cell-volume approach
Introduction
Living cells are evolutionary, auto-catalytic, self-adjustable structures able to convert raw materials from environment into additional copies of themselves. Living cells are organized, self-replicating, evolvable, and responsive biological systems to environmental stimuli. The structural and functional cell organization, including components and reactions, is extremely complex, involving 0(103-4) components, 0(103-4) transcription factors (TF-s), activators, inhibitors, and at least one order of magnitude higher number of (bio)chemical reactions, all ensuring a fast adaptation of the cell to the changing environment [1]. Relationships between structure, function and regulation in complex cellular networks are better understood at a low (component) level rather than at the highest-level [2].
Cell regulatory and adaptive properties are based on homeostatic mechanisms, which maintain quasi-constant key- species concentrations and output levels, by adjusting the synthesis rates, by switching between alternative substrates, or development pathways. Cell regulatory mechanisms include allosteric enzymatic interactions and feedback in gene transcription networks, metabolic pathways, signal transduction and other species interactions [3]. In particular, protein synthesis homeostatic regulation includes a multi-cascade control of the gene expression with negative feedback loops and allosteric adjustment of the enzymatic activity [1,4].
The in-silico re-design of the cell metabolism is an up-to-date subject in Synthetic Biology. But in this effort, Synthetic Biology is closely assisted by the Systems Biology and by the Process Biochemistry focus on the cell organization and component interactions, the formers being one of the main tools in the in- silico design of genetically modified micro-organisms (GMO) with desired characteristics, with applications in medicine, industrial biosynthesis, production of biosensors, etc. According to Hood [5], Systems Biology is defined as "the science of discovering, modelling, understanding and ultimately engineering at the molecular level the dynamic relationships between the biological molecules that define living organisms". In other words, Systems Biology "aims at understanding the dynamic interaction between components of a living system or between living systems." (http://www.erasysbio.net/). To realize these ambitious objectives, Systems Biology uses a wide range of tools, but mainly complex mathematical simulation models linked to -omics databanks [1].
In this context, the adequate modelling of the genetic regulatory circuits (GRC), made from linked GERMs, together with modelling the cell central carbon metabolism (CCM) remain subjects of tremendous importance on which researches have been focus over the last decades [6,7], as long as GRCs are the essential metabolic components used to re-design the whole cell metabolism [1].
To model complex GERMs, intensive efforts have been invested over the last decades, and various types of dynamic models have been proposed, both in a deterministic [8-16], or stochastic approach [15-19]. See also the reviews [1,14,20,21] concerning structured deterministic models with using continuous variables, built-up from time-series experiments [22]. However, to not complicate the resulted simulation model when coupling GERM chains in complex GRC-s, simple GERM dynamic models have been proposed and investigated by [912,20,23], etc., with Hill-type [24], or pseudo-Hill-type [25] activation.
A central part of any CCM model concerns self-regulation of the metabolic processes via protein (enzymes) synthesis in GERMs. Consequently, one particular application of the dynamic deterministic cell models is the study of GRC-, in order to predict ways by which biological systems respond to signals, or environmental perturbations. The emergent field of such efforts is the so-called ‘gene circuit engineering’ and a large number of examples have been reported with in-silico re-creation / design of GRC-s conferring new properties/functions to the mutant cells (i.e. desired 'motifs' in response to external stimuli) [1,21]. Such an effort is facilitated by the use of GERM simulation models.
As mentioned by the pioneers of this field, "with the aid of recombinant DNA technology, it has become possible to introduce specific changes in the cellular genome. This enables the directed improvement of certain properties of microorganisms, such as the productivity, which is referred to as Metabolic Engineering [26-28]. This is potentially a great improvement compared to earlier random mutagenesis techniques, but requires that the targets for modification are known. The complexity of pathway interaction and allosteric regulation limits the success of intuition-based approaches, which often only take an isolated part of the complete system into account. Mathematical models are required to evaluate the effects of changed enzyme levels or properties on the system as a whole, using metabolic control analysis or a dynamic sensitivity analysis" [29]. In this context,GERM and GRC dynamic models are powerful tools in developing re-design strategies of modifying genome and gene expression seeking for new properties of the mutant cells in response to external stimuli [1]. Examples of such GRC modulated functions include [30]: toggle-switches, hysteretic GRC behaviour, GRC oscillator, specific treatment of external signals, GRC signalling circuits and cell-cell communicators. The development of dynamic models on a deterministic basis to adequately simulate in detail the cell metabolism self-regulation, cell growth, and replication for such an astronomical cell metabolism complexity is practical impossible due to lack of structured information and computational limitations. A review of some trials was presented by [31]. In spite of such tremendous modelling difficulties, development of reduced dynamic models to adequately reproduce the cell complex syntheses related to the CCM [29,31,32], but also the GRC[30] tightly controlling the metabolic processes reported significant progresses over the last decades in spite of the lack of structured experimental kinetic information. Even of being rather based on sparse information from various sources, and on unconventional identification lumping algorithms [1,20], such structured deterministic kinetic models have been proved to be extremely useful for in-silico design of novel GRC-s [1,21].
As discussed by Maria [1], the classical (default) modelling tools use Constant Volume Whole-Cell (CVWC) continuous variable ODE dynamic models which, do not explicitly consider the cell volume exponential increase during the cell growth. Such an approach may lead to biased and distorted conclusions on the GERM's performances, thus making difficult the modular constructions of GRCs by linking GERM-s. By contrast, the holistic variable-volume whole-cell (VVWC) modelling framework promoted by Maria [1,20] has been proved to be more realistic and robust, by explicitly including in the model relationships the cell-volume growth, with preserving the cell-osmotic pressure. The added isotonicity constraint by Maria [1,20] was proved to be essential for predicting more adequate performance regulatory indices of GERM and GRC.
The scope of this paper is to exemplify, in a simple way, the importance of using a VVWC modelling framework compared to the classical CVWC models when simulating some regulatory properties of GERM-s by explicitly accounting for the cell-volume growth, and system thermodynamic isotonicity (constant osmotic pressure). Exemplification is made for the case of a simple generic GERM model with characteristics taken form E. coli cells [20,25,33-35], by mimicking the cell homeostasis and its response to dynamic perturbations. The paper subject importance is very high, as long as a large number of cell simulators are developed and used for practical applications in the biosynthesis industry, and in medicine. The isotonicity constraint is proving to be a natural way to preserve the homeostatic properties of the cell system [1,20,36], instead of imposing others constraints, such as "the total enzyme activity" and "total enzyme concentration" constraints [37].
Finally, it is to underline the tremendous importance of such structured (i.e. including individual or lumped cellular species), but reduced (lumped) deterministic dynamic models in the Synthetic Biology, Bioinformatics, and Bioengineering. Such deterministic (mechanistic) models are proved to be powerful tools to adequatelly represent essential metabolic processes in the living cells. In particular, kinetic models with continuous variables related to the CCM [13,29,31,32], or to the GRC [1,8,12,14-16] are to be mentioned. In fact, all these deterministic models (constructed to match the experimental kinetic data) allow in-silico estimating the metabolic fluxes into the cell (that is the stationary reaction rates under a balanced cell growth, that is the so-called cell homeostasis) [28,38]. These fluxes, expressed in relative terms, indicate how the substrate/nutrients are used into the cell. Such a cell metabolism rough (but quick) evaluation offers the possibility to eventually in-silico re-programming the cell metabolism, by removing or amplifying some reactions, { via acting on their associated enzymes, i.e. the so-called "gene knockout strategy"; see [7,38,42-44], or by cloning cells with plasmids [39,40]}. In such a manner, new microorganisms with desirable properties/functions ('motifs') are design, of practical applications in the biosynthesis industry, environmental engineering, and medicine [1,21,36]. At this point, it is to mention that dynamic cell models using continuous variables, in spite of some disadvantages, they present a large number of advantages (see the discussion of [20,31,36,41]).
The CVWC vs. VVWC Modelling Framework CVWC formulation
CVWC formulation
For a system of chemical or biochemical reactions conducted in a (cell) closed volume V (assumed an open system of uniform content), the classical (default) formulation of the corresponding (bio)chemical kinetic model based on continuous variables (concentration vector C, or number of moles vector n) implies writing an ODE mass balance including the considered system states (biological/chemical species), in the following CVWC formulation (with referring to the whole system volume):

The above formulation assumes a homogeneous constant volume with no inner gradients or species diffusion resistance into the cell. When continuous variable ODE dynamic models are used to model cell enzymatic/metabolic processes, the default-modelling framework Eq. (1) is that of a constant volume and, implicitly, of a constant osmotic pressure (p) in isothermal systems, according to the assumed fulfilled Pfeffer's law in diluted solutions (i.e. the cytosol system) [20,45]:

Eventually some CVWC models, accounts for the cell-growing rate as a pseudo-'decay' rate of key-species (often lumped with the degrading rate) in a so-called 'diluting' rate (denoted here by an average Ds see below for its significance). In fact, by ignoring the direct influence of the cell volume increase, the CVWC dynamic model cannot ensure the system isotonicity constraint fulfilment because the sum of species number of moles doubles over the cell cycle. Such a CVWC dynamic model might be satisfactory for modelling many cell subsystems, but not for an accurate modelling of cell regulatory / metabolic processes under perturbed conditions, or for division of cells [46], distorting the prediction quality, as reviewed by Maria [1]. Other researchers [37] tried to preserve the homeostatic properties of the cell system, not by imposing the isotonic constraint Eq. (2), but "the total enzyme activity" and "total enzyme concentration" constraints.
VVWC formulation
At this point, it is to strongly emphasize that living cells are systems of variable volume. They double their volume during the cell cycle. For chemical or biochemical systems of variable-volume, another formulation is more appropriate, being given by Aris [47] and later promoted by Maria [1,20] in modelling cell subsystems by also including the cell isotonicity constraint in the so-called VVWC modelling framework. In mathematical terms, the species mass balance Eq. (1) should be re-written in the form of:

At this point, it is to remark two possibilities to calculate the cell dilution D necessary for solving the model Eq. (3). The simplest, but not the accurate one, is to use a value averaged over the cell cycle, that is:

By accounting the cell double volume at the end of the cell-cycle, then Ds can be a-priori evaluated by using the following relationship (for cells of known cell cycle):

The second alternative to evaluate the cell dilution D is those to impose a constraint accounting for the cell-volume growth while preserving a constant osmotic pressure and membrane integrity. Thus, by derivation of the Pfeffer’s law Eq. (2) in respect to V, and by division to V, one obtains the "isotonic" dilution rate Di [20]:?

It is to observe in Eq. (5) that the cell content dilution rate Di is linked to the all species (taken individually or lumped) reaction rates via the isotonicity constraint. As species reaction rates varies during the cell cycle, it clearly results that formulation Eq. (5) offers a more accurate estimation of the (variable) cell dilution at any time. Such a system isotonicity constraint is more natural and eventually includes "the total enzyme activity" and "total enzyme concentration" constraints suggested by Komasilovs et al. [37].

The basic hypotheses of the VVWC dynamic models of type Eqs. (3-5) are briefly presented in the Table 1. These formulations are valid over ca. 80% of the cell cycle representing the balanced cell growth before its division [46].
GERM Lumped Models
As pointed-out in the literature [1], the genetic regulatory systems (GRC), that control the synthesis of all proteins (enzymes) in the cell, present a modular construction, every operon (a cluster of genes under the control of a single promoter) including a variable number of interacting GERM-s. However, it is well-known that one GERM interacts with no more than other 23-25 GERM-s [48], while most of GERM structures are repeatable. Consequently, in developing the GRC analysis, the modular approach is preferred due to several advantages: a separate analysis of the constitutive GERM-s in conditions that mimic the stationary or perturbed cell growth. The modules are then linked to construct GRC of an optimized regulatory efficiency that ensures key-species homeostasis and network holistic properties. Investigation of GERM and GRC characteristics is focus on the tight control of gene expression, the quick dynamic response, the high sensitivity to specific inducers, and the GRC robustness (i.e. a low sensitivity vs. undesired inducers). Such advanced regulatory structures must ensure the homeostasis (quasi-stationarity) of the regulated key-species, and quick recovery (with a trajectory of minimum amplitude) after a dynamic (impulse-like) or stationary (step-like) perturbation of one of the involved metabolites or nutrients [1].

In order to not complicate the deterministic models, lumped GERM and GRC structures have been adopted in the literature. Some of them are presented in the Figure 1. The simplest GERM structure with one regulatory element is those denoted by G(P)1, also approached in this paper. The generic G(P)1 regulatory module (also represented schematically in Figure 2), refers to the synthesis of a generic protein P and the simultaneous replication of its encoding gene G. The lumped G(P)1 model includes only one regulatory element, that is a fast "buffer" reversible reaction G + P <===> GP(inactive) (Figure 2), aiming at controlling the P synthesis rate and its homeostatic (quasi-stationary, QSS) level. In such a generic lumped construction, the protein P and its encoding gene G mutually catalyses the synthesis of each other. The protein P is the "control node" playing multiple roles in such a simplified lumped representation. Thus, P is a permease leading to the import of nutrients NutG, NutP in the cell, but also a metabolase converting the nutrients into precursors MetG and MetP of the G and P respectively. Protein P is also a polymerase catalysing the gene replication. And, finally, the protein P is also a transcriptional factor by dynamically adjusting the catalytic activity of the G by means of a very rapid "buffer" regulatory reaction G + P <===> GP(inactive). When P is produced in excess, it reversible inactivates more amount of G, which in turn, will slow-down the P synthesis. When P is produced in too low amounts, the regulatory process goes backwards. As proved in previous works [1], when acting as a transcriptional factor, P is a better effector if it is present in a dimeric form acting at both G and M levels of the expression (middle and down-rows of Figure 1), thus developing a cascade control scheme of the expression where transcription and translation regulatory steps are separately considered [1].
Estimate the Rate Constants and Simulate A G(P)1 Module Dynamics and its Self-Regulation after A Dynamic Perturbation using the VVWC Approach
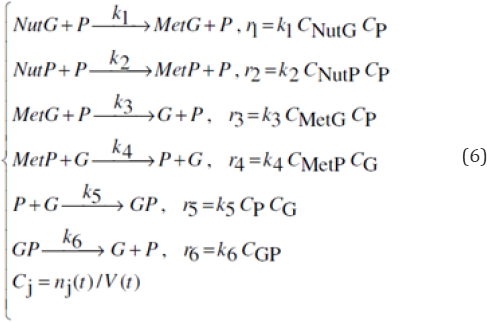
In order to simply illustrate the predictive capabilities of VVWC dynamic models, one considers a generic GERM of G(P)1 type (with the lumped reaction scheme given in Figure 2). The reaction rate expressions for the G(P)1 model are given in Eq. (6). The species mass balance can be formulated in both number of moles (copynumbers) by using the notation nj = [n-moles] of species j, and concentrations C = nj (t)/ Vcyt (t), [nM], where V = Vcyt .

The formulated CVWC model in Eq. (7-left) does not explicitly includes the dilution term D. However, to ensure a certain model consistency of the CVWC when it is necessary to evaluate the cell volume V(t), e.g. when the model Eq. (7-left) is solved in terms of the number of moles nj , or when nj (t) are required, an average dilution Ds Eq. (4a-b) is assumed. By comparison, in the below VVWC dynamic model formulation Eq. (7-right) the cell content dilution rate Di is computed during the cell cycle by using Eq. (5) and the isotonicity constraint related to the all species reaction rates (taken individually or lumped):

(b) Adopted to ensure the maximum responsiveness of the GERM steady-state (see the discussion of Maria [1,20,25,30,49].
Footnotes: Max(Re(ip) <0 indicates a stable cell quasi-stady-state (QSS, homeostasis), where l are the Jacobian eigenvalues of the VVWC kinetic model of GERM. Lumps NutP and NutG denote substrates used in the synthesis of metabolites MetP and MetG respectively, former being further used for the P and G synthesis. Notations: G= a generic gene (DNA) from E. coli cell; P= the protein encoding G; M= mRNA; GP= the inactive complex of G with the transcription factor P; Cj = species “j” concentration; Indices cyt= cytoplasma; “0”= initial; ‘s' refers to the QSS; NG = negligible.
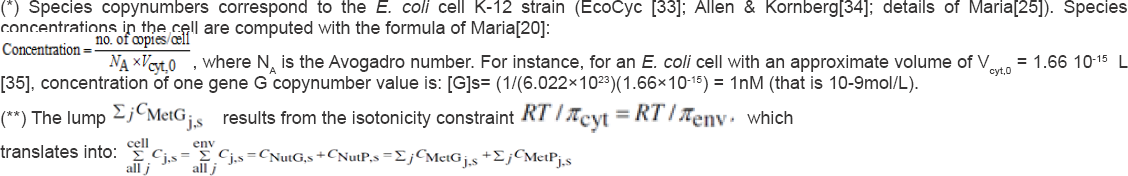
(*) Species copynumbers correspond to the E. coli cell K-12 strain (EcoCyc [33]; Allen & Kornberg[34]; details of Maria[25]). Species concentrations in the cell are computed with the formula of Maria[20]
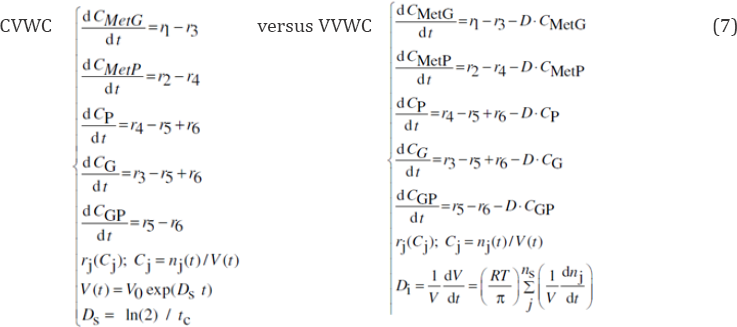
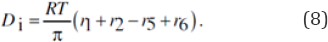
By contrast, the VVWC model Eq. (7-right) explicitly includes the cell dilution term D, accurately evaluated any time as Di with the Eq. (5) which, in the present case study, translates in:
The term (RT/ p) is evaluated from the cell initial state, by using the Pfeffer�s law Eq. (2):
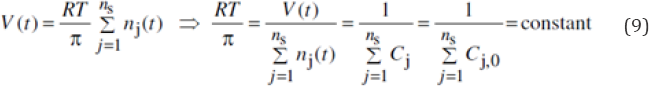

At this point, it is to observe that, in a VVWC model formulation, all cell species should be considered (individually or lumped), because all species net reaction rates contribute to the cell volume increase Eq. (9). In the present case, the rest of the cell content was mimicked by adopting large concentrations for the lumped NutP and NutG (Table 2). Solving the models Eq. (7) is made with using a stiff integrator ("ODE15s") of Matlab™ package due to the very fast buffering reactions no. 5-6 in Eq. (6) compared to the rest of reactions (see the discrepancy in the rate constants in the Table 3). The number of moles nj (t) can be calculated at any time with nj(t)= Cj(t) V(t) , by using the species concentrations Cj(t) derived from solving the ODE model.
The rate constants of the dynamic VVWC model Eq. (7-right) have been estimated from the steady-state (homeostatic) initial condition of the cell (dCj/dt)s = gj(Cs,k)= 0, that is:
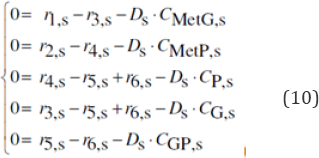
The numerical values of the rate constants for the initial cell condition, and an average Ds are given in the Table 3. For the rapid buffer reaction G + P <===> GP, the reverse reaction rate constant k6 (not estimable) was adopted at a value much larger than Ds (see the discussion of [49]). The rate constants of the CVWC model Eq. (7-left) cannot be estimated on the same way because of singularities of the resulting nonlinear algebraic set. Consequently, the same rate constants of VVWC model were used instead.
Here it is to observe that the values of the lump ZjtMetc;.s results from the isotonicity constraint (ensuring the membrane integrity] (RT/ ncvt) = fRT/nenv] which, using Eq. (9), indicates that the sum of cell species concentrations must equal those of the environment, i.e. j |< i ] -j|q) . Otherwise, the osmosis will eventually lead to an equal osmotic pressure jicyt = jienv. Even if, in a real cell, such equality is approximately fulfilled due to perturbations and transport gradients, and in spite of migrating nutrients from environment into the cell, the overall environment concentration is considered to remain unchanged. On the other hand, species inside the cell transform the nutrients into metabolites and react to make more cell components. In turn, increased amounts of polymerases are then used to import increasing amounts of nutrients. The net result is an exponential increase of cellular components in time, which translates, through isotonic osmolarity assumption, into an exponential increase in volume with time [see Eq. (4a)]. The environment volume hypothetical variable Venv necessary to evaluate environment species concentrations when solving the cell model of Table 3, is evaluated from the same isotonicity constraint at the initial state, that is: v^o/v^o=i I'c,) 7I ?ci j ’ environment species from the Table 2 (the "lump NutG”, and the "lump NutP”). 1 e"v0 1 cyt 0

To exemplify how the self-control of the protein synthesis works due to the rapid buffer reaction G + P <===> GP, one starts from the QSS cell nominal stationary conditions of Table 2, but with adopting [G]s =[GP]s = 1 nM, and one applies a dynamic perturbation (impulse like) at an arbitrary moment t=0 (Figure 3), by diminishing the stationary [P]s from 1000nM to 900nM ( for a GERM of G(P)1 type). As a result, the regulatory buffer system leads to a quickly [G]s increase from lnM to 1.052nM (due to less P in the buffer reaction, on the expense of GP which displays an accordingly decrease of [GP]s from lnM to 0.947nM) which, in turn, will speed-up the P synthesis enough to recover the initial [P]s in ca. 127min. (with an acceptable tolerance of 1%).The same regulatory mechanism also applies to the [G]s , controlled by the same buffer reaction, the recovering time being of ca. 118 min. If one repeats the simulation, but with an initial [G]s =[GP]s= 0.5nM then, as presented in the Table 2, the recovering time of [P]s is 133min., and 93 min. for [G]s , respectively. It is to be noted that in wild E. coli cells [G]s is around 1nM (see the proof in the footnote of Table 2), but in cloned cells with plasmids, this level can be higher.
To complete the discussion, one simulates also the dynamics of cell components present in large amounts (MetP, MetG), with using the same initial QSS of Table 2, but with adopting a stationary level of [G]s= [GP]s= 0.5nM (to get a maximum regulatory efficiency; see [20,49] ). By applying a dynamic perturbation to [P]s steady-state for a generic GERM of [G(PP)1] type, that diminishes the stationary [P]s from 1000 nM to 900nM, simulation with the identified VVWC model Eqs. (7-9) is leading to the species trajectories displayed in Figure 4, proving again the good self-control of the P-synthesis produced by the lumped G(P)1 GERM model.

It is self-understood that, as the regulatory scheme (in Figure 1) is more effective, as the GERM regulatory efficiency is better. For an extensive discussion on regulatory properties of various GERM-s the reader is referred to the review of Maria[1].
Illustrate Superiority of VVWC Vs. CVWC Models
In order to simply illustrate the discrepancy in predictive capabilities between VVWC and CVWC kinetic models, and how deceptive can the predictions of such CVWC kinetic models be, one considers the same example of a generic GERM in the E. coli cell of G(P)1 type illustrated in the chap. 4. The reaction scheme, reaction rate expressions for the G(P)1 gene expression module are those given in Eq. (6), while the species mass balances are given in Eq. (7) for both CVWC and VVWC formulations.

After rate constant estimation in the G(P)1 VVWC model by using the E. coli cell data with the initial homeostatic concentrations of Table 2, simulations of one cell cycle by using the VVWC model lead to obtaining the species copynumber dynamics plotted in Figure 5. It is to observe that, while the cell volume doubles, the species copynumbers double as well. However, there is a very small discrepancy in the predicted cell-volume dynamics because the average Ds used by the CVWC model is slightly different from the Di uused by the VVWC model

If the species dynamics is plotted in terms of concentrations (referred to the cell cytosol volume), the predicted trajectories for the un-perturbed cell growth case, given in Figure 6 by the CVWC model and the VVWC model are very close to each other, the difference being negligible (in relative terms). That is because, over a large time-domain, the formula Eq. (4a-b) satisfactorily averages the detailed formula Eq. (5). In Figure 6 both models correctly indicate how the key-species stationary values are preserved under balanced cell growth conditions. However, differences in the predictions of the two models better appear under perturbed growing conditions. Thus, the recovering trajectories predicted by the CVWC model and by the VVWC model after an impulse-like perturbation by diminishing the stationary [P]s from 1000nM to 900 nM, are quite different as revealed by the plots of Figure 7. The differences in model predictions are as larger as the species present a lower level in the cell (that is for P, G, and GP species).

Consequently, while the VVWC model correctly reproduces the system homeostasis recover after a perturbation, species concentrations being kept quasi-constant because both nominator and denominator of the fraction Cj (t)= nj (t) / Vcyt (t), [nM], are doubling at the same rate. By contrast, the CVWC model predictions are inaccurate, the predicted species concentration dynamics under perturbed conditions with using an average formula for the cell content dilution being very biased. So, the CVWC models cannot be used in a satisfactory manner to simulate the regulatory properties of GERM and GRC [1]. One can conclude that the VVWC model formulation better reflects the GERM regulatory properties after dynamic (impulse-like) or stationary (step-like, not discussed here) internal or external perturbations.
Conclusions
As revealed by the simple but eloquent example discussed in this study, there are important issues to be considered when developing modular VVWC models of GRC-s including a variable number of GERM-s.
The reviewed simple case studies of VVWC modular kinetic models of GERM-s proved that the chemical and biochemical engineering principles, together with the control theory of the nonlinear systems are fully applicable to modelling complex metabolic cell processes, including sophisticated GRC-s controlling the cell enzyme's syntheses and metabolic fluxes. The ODE kinetic models with continuous variables are fully feasible alternatives to well describe the cell response to stationary or dynamic continuous perturbations from the environment [36].
In fact, such cell process models 'translate' from the ‘language’ of molecular biology to that of mechanistic chemistry and mathematics/computing languages, trying to preserve the structural, functional, and timing hierarchy of the cell components and functions. To avoid very extended ODE cell kinetic models, difficult to be identified, and to be used, lumped model structures should be used with a lumping degree chosen to ensure a satisfactory trade-off between model simplicity and its predictive quality [49].
As discussed by Maria[1], the classical (default) CVWC continuous variable ODE dynamic models are not always recommended. By not explicitly considering the relationship between the cell volume exponential increase during the cell growth, the osmotic pressure, and species reaction rates, they can lead to biased and distorted conclusions on GERM regulatory performances (i.e. the response to perturbations), thus making difficult the modular construction of GRC-s by linking GERM-s.
Symbols
Cj - species (lump, or 'pool') concentration
D - cell content dilution rate (i.e. cell-volume logarithmic growing rate)
g, h - kinetic model function vector J= dg / dC - kinetic model Jacobian matrix
k - rate constant vector
nj - species j number of moles, or number of effector species binding the 'catalyst' L in a GERM
nr - number of reactions
ns - no. of species
Na - the Avogadro number
rj - species j reaction rate
R - universal gas constant
t - time
tc - cell-cycle time
T - temperature
V - cell volume
Greeks
λ(J) - eigenvalues of the dynamic model Jacobian
uij - stoichiometric coefficient of the species "j" (individual or lumped) in the reaction "i";
p - osmotic pressure
tj - species j recovering time of the steady-state
Index
cyt - cytoplasma
env - environment
0 - initial
s - Stationary state
perturb - perturbed
Abbreviations
CCM - central carbon metabolism
G - The active Gene (DNA)
GRC - genetic regulatory circuits
GERM - gene expression regulatory module
GMO genetically modified micro-organisms
GP - the inactive complex of G with the transcription factor P (its encoding protein in the reduced model here)
L - species at which regulatory element acts
M - mRNA
Met - metabolite
nM - nmol L-1, nano-molar (i.e. 10-9 mol L-1 concentration)
NG - negligible
Nut - nutrient
ODE - ordinary differential equations
P - protein
TF - transcription factor
QSS - quasi steady-state
[.] - concentration
References
- Maria G (2017a) A review of some novel concepts applied to modular modelling of genetic regulatory circuits. Juniper Publ., Newbury Park, CA 91320, USA.
- Stelling J, Klamt S, Bettenbrock K, Schuster S, Gilles ED (2002) Metabolic network structure determines key aspects of functionality and regulation. Nature 420: 190-193.
- Crampin EJ, Schnell S (2004) New approaches to modelling and analysis of biochemical reactions, pathways and networks. Progress in Biophysics & Molecular Biology 86: 1-4.
- Kholodenko BN1, Schuster S, Garcia J, Westerhoff HV, Cascante M (1998) Control analysis of metabolic systems involving quasi-equilibrium reactions. Biochimica Biophysica Acta 1379: 337-352.
- Hood L (2017) Quote on the web-site of the Inst. Systems Biology, Seattle, The University of Glasgow, Centre for Mathematics Applied to the Life Sciences.
- Kurata H, Sugimoto Y (2017) Improved kinetic model of Escherichia coli central carbon metabolism in batch and continuous cultures. J Biosci Bioeng 17: S1389-1723.
- Maria G, Xu Z, Sun J (2011) Multi-objectiveMINLP optimization used to identify theoretical gene knockout strategies for E. coli cell. Chemical & Bio-chemical Engineering Quarterly 25(4): 403-424.
- Ay A, Arnosti DN (2011) Mathematical modeling of gene expression: a guide for the perplexed biologist. Crit Rev Biochem Mol Biol 46: 137-151.
- Atkinson MR, Savageau MA, Myers JT, Ninfa AJ (2003) Development of genetic circuitry exhibiting toggle switch or oscillatory behavior in Escherichia coli. Cell 113: 597-607.
- Hlavacek WS, Savageau MA (1997) Completely uncoupled and perfectly coupled gene expression in repressible systems. J Mol Biol 266: 538-558.
- Wall ME, Hlavacek WS, Savageau MA (2003) Design principles for regulator gene expression in a repressible gene circuit. J Mol Biol 332: 861-876.
- Savageau MA (2002) Alternatives designs for a genetic switch: Analysis of switching times using the piecewise power-law representation. Math Biosciences 180: 237-253.
- Ma HW, Zhao XM, Yuan YJ, Zeng AP (2004) Decomposition of metabolic network into functional modules based on the global connectivity structure of reaction graph. Bioinformatics 20: 1870-1876.
- Chen T, He HL, Church GM (1999) Modeling gene expression with differential equations, Pacific Symposium of Biocomputing, pp. 29-40.
- Shmulevich I, Aitchison JD (2009) Deterministic and stochastic models of genetic regulatory networks. Methods Enzymol 467: 335-356.
- Wei K (2014) Deterministic and stochastic modelling of gene expression in the PURE system. MSc thesis Dept of Bionanoscience Delft Univ of Technology Sept. 2014.
- Kaznessis YN (2006) Multi-scale models for gene network engineering. Chemical Engineering Science 61: 940-953.
- Salis H, Kaznessis Y (2005) Numerical simulation of stochastic gene circuits. Comput Chem Eng 29: 577-588.
- Tian T, Burrage K (2006) Stochastic models for regulatory networks of the genetic toggle switch. Proc. of the National Academy of Sciences USA 103: 8372-8377.
- Maria G (2005a) Modular-based modelling of protein synthesis regulation. Chemical and Biochemical Engineering Quarterly 19: 213-233.
- Myers CJ, (2009) Engineering genetic circuits. Chapman & Hall/CRC Press, Boca Raton.
- Bar-Joseph Z, Gitter A, Simon I (2012) Studying and modelling dynamic biological processes using time-series gene expression data. Nature Reviews Genetics 13: 552-564.
- Yang Q Lindahl P, Morgan J (2003) Dynamic responses of protein homeostatic regulatory mechanisms to perturbations from steady state. J theor Biol 222: 407-423.
- Voit EO (2005) Smooth bistable S-systems. IEE Proc. Syst Biol 152: 207-213.
- Maria G (2007) Modelling bistable genetic regulatory circuits under variable volume framework. Chemical and Biochemical Engineering Quarterly 21: 417-434.
- Bailey JE (1991) Towards a science of metabolic engineering. Science 252: 1668-1675.
- Nielsen J (1998) Metabolic engineering, techniques for analysis of targets for genetic manipulations. Biotechnol. Bioeng 58: 125-132.
- Stephanopoulos GN, Aristidou AA, Nielsen J (1998) Metabolic engineering. Principles and methodologies. Academic Press, New York, USA.
- Visser D, Schmid JW, Mauch K, Reuss M, Heijnen JJ (2004) Optimal re-design of primarymetabolism in Escherichia coli using linlog kinetics. Metabolic Engineering 6: 378-390.
- Maria G (2014b) Extended repression mechanisms in modelling bistable genetic switches of adjustable characteristics within a variable cell volume modelling framework. Chemical and Biochemical Engineering Quarterly 28: 35-51.
- Styczynski MP, Stephanopoulos G (2005) Overview of computational methods for the inference of gene regulatory networks. Comput Chem Eng 29: 519-534.
- Maria G (2014a) In-silico derivation of a reduced kinetic model for stationary or oscillating glycolysis in Escherichia coli bacterium. Chemical and Biochemical Engineering Quarterly 28: 509-529.
- EcoCyc (2005) Encyclopedia of Escherichia coli K-12 genes and metabolism, SRI Intl., The Institute for Genomic Research, Univ of California at San Diego.
- Allen GC (1991) The priB gene encoding the primosomal replication n-protein of E. Coli. Jl Biological Chemistry 266: 11610-11613.
- Kubitschek HE (1990) Cell volume increases in Escherichia coli after shifts to richer media. Journal of Bacteriology 172: 94-101.
- Maria G (2017b) Deterministic modelling approach of metabolic processes in living cells - a still powerful tool for representing the metabolic process dynamics. Juniper Publ., Newbury Park, CA 91320, USA.
- Komasilovs V, Pentjuss A, Elsts A, Stalidzans E, (2017) Total enzyme activity constraint and homeostatic constraint impact on the optimization potential of a kinetic model. Biosystems 162: 128-134.
- Stephanopoulos G, Simpson TW (1997) Flux amplification in complex metabolic networks. Chem Eng Sci 52: 2607-2627.
- Maria G (2010) A dynamic model to simulate the genetic regulatory circuit controlling the mercury ion uptake by E. coli cells. Revista de Chimie (Bucharest) 61(2): 172-186.
- Maria G, Luta I (2013) Structured cell simulator coupled with a fluid- ized bed bioreactor model to predict the adaptive mercury uptake by E. coli cells. Computers & Chemical Engineering 58: 98-115.
- Maria G (2005b) Relations between apparent and intrinsic kinetics of programmable drug release in human plasma. Chemical Engineering Science 60: 1709-1723.
- Xu Z, Zheng P, Sun J, Ma Y (2013) ReacKnock: Identifying reaction deletion strategies for microbial strain optimization based on ge- nome-scale metabolic network. PLoS One 8(12): e72-e150.
- Xu Z, Sun X, Yu S (2009) Genome-scale analysis to the impact of gene deletion on the metabolism of E. coli: constraint-based simulation approach. BMC Bioinformatics 10(Suppl 1): S62
- Xu Z, Sun J, Wu Q Zhu D (2017) Find_tfSBP: find thermodynamics-feasible and smallest balanced pathways with high yield from large-scale metabolic networks, Nature Scientific Reports.
- Wallwork SC, Grant DJW (1977) Physical Chemistry. Longman, London, UK.
- Morgan JJ, Surovtsev IV, Lindahl PA, (2004) A framework for whole-cell mathematical modelling. Jl theor Biology 231: 581-596.
- Aris R (1969) Elementary chemical reactor analysis. Prentice-Hall, New Jersey, USA.
- Kobayashi H, Kaern M, Araki M, Chung K, Gardner TS, et al. (2004) Pro-grammable cells: Interfacing natural and engineered gene networks. Proc Natl Acad Sci USA 101: 8414-8419.
- Maria G (2006) Application of lumping analysis in modelling the living systems -A trade-off between simplicity and model quality. Chemical and Biochemical Engineering Quarterly 20: 353-373.


