- Research Article
- Abstract
- Introduction
- Architecture of the Automated Spectrometer System
- Architecture of the Automated Spectrometer Signal Program
- Featureless Representation of the Spectra by Delta Modulation
- Similarity Determination between the Featureless Spectra Representations
- Evaluation and Results
- References
Label-Free Screening of Bio-Molecular Interactions Based on Raman Spectroscopy and a Novel Delta Modulation and Similarity-Based Signal Analysis Method
Petra Perner*
Institute of Computer Vision and Applied Computer Sciences, IBaI, Germany
Submission: October 04, 2017; Published: October 13, 2017
*Corresponding author: Petra Perner, Institute of Computer Vision and Applied Computer Sciences, IBaI, Germany, Email: pperner@ibai-institut.de
How to cite this article: Priyanka B, Meeta L, Banwari L. Exterminating Attribute of Microbial Community in Oil and Gas Pipeline Network. Curr Trends Biomedical Eng & Biosci. 2017; 9(4): 555768. DOI: 10.19080/CTBEB.2017.09.555768.
- Research Article
- Abstract
- Introduction
- Architecture of the Automated Spectrometer System
- Architecture of the Automated Spectrometer Signal Program
- Featureless Representation of the Spectra by Delta Modulation
- Similarity Determination between the Featureless Spectra Representations
- Evaluation and Results
- References
Abstract
With the aid of Raman spectroscopy, the vibrational spectrum of molecules can be examined. Functional groups like amino, carboxyl or hydroxyl groups can be identified through characteristic vibrational frequencies. An automatic system is necessary in order to use RAMAN spectroscopy for high-throughput screening. We describe in this paper our novel method for automatic RAMAN spectra identification. The method is based on a featureless representation. The representation calculated based on delta modulation. Is a 0/1 sequences which can be used for comparison between different spectra’s. Three different similarity measures, the Hamming distance, the Levenshtein distance, and the Damerau-Levenshtein distance, have been studied. The pros and cons of these three distances are discussed in this paper. Finally, we present a novel and powerful method for spectrometer interpretation.
- Research Article
- Abstract
- Introduction
- Architecture of the Automated Spectrometer System
- Architecture of the Automated Spectrometer Signal Program
- Featureless Representation of the Spectra by Delta Modulation
- Similarity Determination between the Featureless Spectra Representations
- Evaluation and Results
- References
Research Article
Specific molecular interactions between bio-molecules form the basis for nearly all biochemical processes in living cells [1]. The bonding between a protein and a ligand, between complementary DNA single strands, between enzymes and their substrates, or between a receptor and its stimulus are all based on specific molecular interactions. The detection and analysis of these interactions are necessary for the understanding of biochemical processes as well as for the development of new active pharmaceutical ingredients.
With the aid of Raman spectroscopy, the vibrational spectrum of molecules can be examined. Functional groups like amino, carboxyl or hydroxyl groups can be identified through characteristic vibrational frequencies. The specific interaction between biological molecules is usually based on hydrogen bonds between functional groups. Because hydrogen bonding affects the force constants between the atoms of a functional group, its vibrational frequencies will show a significant shift compared to the free functional group. The relation between the energy of the hydrogen bond and the frequency shift is called Badger-Bauer relationship [2]. When recording two spectra of the free and the bonded protein under identical conditions and subtracting the spectra, a Raman difference spectrum can be calculated that shows frequency shifts with high sensitivity [3].
We have therefore worked on a system for automated RAMAN screening. Our specific interest concerned the development of a novel software system that can automatically pre-process and analyze RAMAN spectra. We introduced a novel technique to smooth and code the spectrometer signal in a featureless way so that it can be easily interpreted by a similarity-based method. This technique makes it easy to store a huge number of signals without the need of a large memory. Therefore, it can be implemented in a fast computing circuit for high-performance computing.
In this paper, we will explain the architecture of the automated Spectrometer System in Section 2. The architecture of the automated spectrometer signal analysis system is explained in Section 3. The novel smoothing and coding technique based on the Delta Modulation is described in Section 4. The similarity measures are presented in Section 5. A comparison of different representations based on different delta modulation methods and different similarity methods will be given in Section 6. Finally we summarize our work in Section 7.
- Research Article
- Abstract
- Introduction
- Architecture of the Automated Spectrometer System
- Architecture of the Automated Spectrometer Signal Program
- Featureless Representation of the Spectra by Delta Modulation
- Similarity Determination between the Featureless Spectra Representations
- Evaluation and Results
- References
Architecture of the Automated Spectrometer System
A system that can automatically screen and interpret biomolecular interactions based on RAMAN Spectroscopy has been developed (Figure 1). The system consists of a special probe handling carrier well suited for small sample sizes. A special RAMAN Spectroscope has been developed. Raman spectra can be recorded from protein solution, but also from protein crystals. Focusing of the laser enables the measurement of spectra from crystals even if only very small crystals are present. Because of the high concentration of protein in the crystal, good signal to noise ratios can be obtained. Protein crystals contain a large amount of water and can be used in binding studies. Small ligands can diffuse into the crystal and bind to the proteins. This can be analyzed with the help of Raman spectroscopy [4].
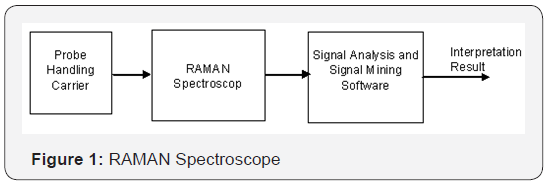
Raman spectroscopy
For clarity reasons we provide a short description of Raman spectroscopy taken from [1]. As the concept of difference spectroscopy is based on the comparison of similar spectra, it is important to record spectra with excellent signal to noise ratios, so that small spectral changes induced by the ligand bonding can be detected. A confocal optical system using a microscope objective with high numerical aperture and a laser for excitation of Raman signals enables good collection efficiencies. The same objective is used for excitation and collection of Raman signals, so the analysis needs only one optical access. Microtiter plates with a glass bottom are used to carry the samples and the optics is placed under the plate. This is ideal for high throughput screening because no expensive cuvettes are needed. Another advantage of the confocal setup with the strong focusing of the Laser is an inherent reduction of fluorescence in relation to Raman signals. The high laser intensities lead to strong saturation and bleaching of the fluorescence whereas the Raman signals cannot be saturated. The Laser is focused to a spot of less than one μm diameter, so the sample volumes can also be very small. To prevent the protein solutions from drying, small sample droplets can be placed under oil that inhibits evaporation.
Figure 2 shows the schematic experimental setup with the components laser, spectrometer and optics for the separation of laser light and Raman signals. The Laser is an external cavity diode Laser emitting at 785nm with a spectral bandwith of only 1MHz and nearly 1W optical power [5]. The Laser can be spectrally shifted for about 14cm-1, this can be utilized for the reduction of fluorescence by a technique of shifted excitation [6].
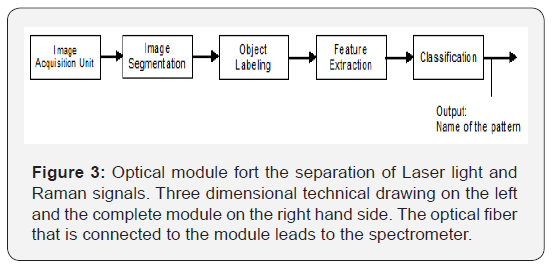
The Czerny Turner spectrometer is equipped with three different gratings for overview spectra (maximum spectral range 2800cm-1) and for a detailed analysis of smaller regions of the spectrum (maximum resolution 0.5cm-1). The recording of the spectra is done with a cooled CCD detector with low readout noise and high quantum efficiency [7]. A compact optical module for the separation of Laser light and Raman signals was developed and built at the Fraunhofer Institute for Laser Technology ILT that is shown in Figure 3. The module consists of a microscope objective with high numerical aperture (NA=1,2) for focusing of Laser light and collection of Raman signals. The Laser beam enters the module with the help of adjustable mirrors and it is filtered with a line filter prior to irradiating the sample. A dichroic mirror and an edge filter separate the Raman signals from reflected Laser light and Rayleigh scattering and a second objective focuses the Raman signals into an optical fiber leading to the spectrometer.

Signal analysis and interpretation
A new signal analysis program has been developed that can preprocess the RAMAN spectrometer signal, automatically extract peaks, and describe the signals by specific signal parameters that enable automatic interpretation of the peaks of the spectra is presented. The software is based on an incremental learning procedure so that knowledge about the spectral characteristics of various proteins and ligands can be learned over time and used for automatic interpretation.
- Research Article
- Abstract
- Introduction
- Architecture of the Automated Spectrometer System
- Architecture of the Automated Spectrometer Signal Program
- Featureless Representation of the Spectra by Delta Modulation
- Similarity Determination between the Featureless Spectra Representations
- Evaluation and Results
- References
Architecture of the Automated Spectrometer Signal Program
The architecture of the automatic spectrometer identification system is shown in Figure 4. After preprocessing the spectrometer signal, the signal is coded into a featureless representation by a delta modulator. The delta modulator codes the signal into a sequence of 1 and 0. While this is done, the signal is smoothed by a stepwise function. The featureless representation makes it unnecessary to develop special highlevel features that describe all interesting properties of the spectra. The sequence itself can be interpreted in different ways. It can be analyzed for identity, similarity of the whole sequence, or for partial identity or similarity. This enables identification of part-spectra, special single peaks, or peak combination within a spectrum.
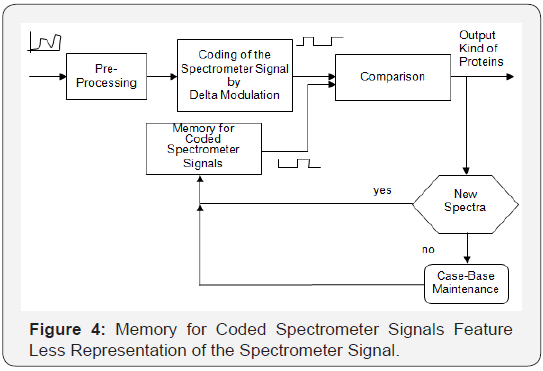
This sequence is compared to sequences of reference spectra stored in a memory. The name of the spectrum where the coded sequence gives the highest similarity is output to the user. A side effect of coding is also that the spectrum is not stored with its real values but instead it is stored as 0/1 sequence. This saves memory capacity and makes implementation of the method in a special purpose processor possible. When no similar sequence is found in the data base, the input spectrum is stored in the data base after it has been coded by the delta modulator. This data collection is necessary since the appearance of the spectra for different proteins is not known yet.
In this special case, the pre-processing of the RAMAN spectra is a baseline correction [8], a Fourier transformation to eliminate the influence of the special system device and its parts [5], and the calculation of the difference between the spectrum of the buffer and the spectrum of the liquid in the buffer
- Research Article
- Abstract
- Introduction
- Architecture of the Automated Spectrometer System
- Architecture of the Automated Spectrometer Signal Program
- Featureless Representation of the Spectra by Delta Modulation
- Similarity Determination between the Featureless Spectra Representations
- Evaluation and Results
- References
Featureless Representation of the Spectra by Delta Modulation
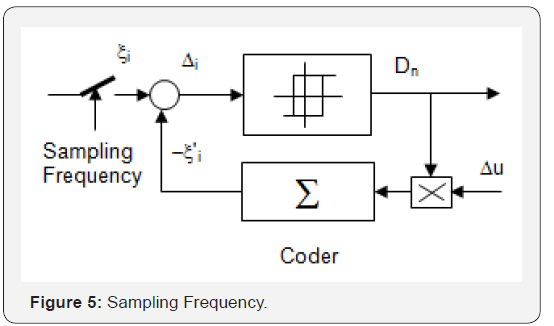
The delta modulator compares the actual signal value s(i) with an estimated signal value r(i) of the coder. This difference e(i) is coded by only one bit. Three different methods exist to estimate and predict the signal value: linear delta modulation (LDM) [9], constant factor delta modulation (CFDM) [10], and continuously variable slope delta modulator (CVSD) [11,12]. We study how these methods work on spectrometer signals and what kind of similarity measure is appropriate for the resulting representation of the spectrometer signal.
Linear delta modulation
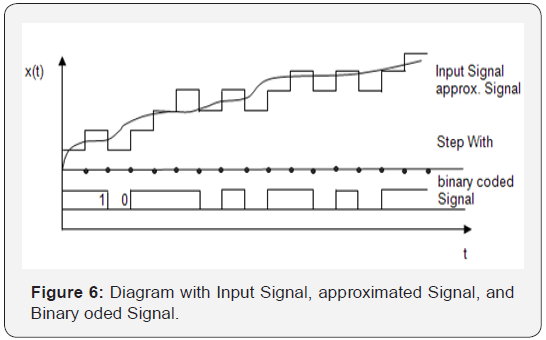
In case of the linear delta modulation (LDM), the difference e(i) between the actual value s(i) and the estimated value r(i) at sampling point i is formed, (Figure 5). Coding is done only in the direction of the modification (D.. = “1” positive, D.. = “0” negative). This binary signal D(i) is stored in the memory. At the same time, the magnitude of the signal expected at the next sampling point i is estimated based on it. The corresponding rule is:
s(i) > r(i) Dn = 0 r(i) = r(i −1) + Δu (1)
s(i) ≤ r(i) 1 n Dn = 1 r(i) = r(i −1) − Δu (2)
The incremental size is a constant value which has to be selected as a function of the effective value δ Δ of the first-order difference signal Δ(i) = s(i) − s(i −1) .
For reproducing the signal (which is not necessary here since we do not want to reconstruct the signal), an inversely functioning decoder then generates the original curve by means of the binary signal stored in the memory. This approximated signal is s`(i). The difference between the original signal and the approximated signal is the approximation error , (Figure 6).
When process dynamics change, the linear delta modulator is no longer optimally adjusted anymore and the reconstruction error increases strongly. The adaptive delta modulators compensate this disadvantage. They dispose of a function block which takes over the control of the incremental size in accordance with process dynamics. In the literature, different adaptive delta modulators are known, two of which are presented in the following section.
Constant factor delta modulation
The instantaneous value compander, also called “constant factor delta modulator” (CFDM), changes its increment size at each sampling point. An adaptation logic decides based on the input signal sequence { Dn,Dn-1} by which factor k the preceding increment size has to be multiplied:
Δui=Δui-1.k Dn=Dn-1 k=P(3)
Dn ≠ Dn-1 k=Q
A requirement is that P.Q =1 in order to observe the stability condition. For speech signals and road data of a robot [13] the values P = 1.5 and Q = 0.66 are known from the literature; according to our study these values also perform well in case of the spectrometer signal application.
Continuously variable slope delta modulator
The syllabic compander, also called continuously variable slope delta modulator (CSVDM), pursues, in contrast to the instantaneous value compander, the tendency of the signal course. Only when the same state has been recorded three times in a coincidence register , the syllabic compander increases its increment size. It is therefore more inert than the instantaneous value compander. The rule for syllabic companding is:
3 bit coincidence k =1 1 1 i i u u− = + (4)
no coincidence k = 0 1 1 i i u u− = − until 0 i u = (5)
As u must not become zero, a minimum increment size larger than 1 must be added. A standard value min s u δ Δ = can be assumed wherein s δ Δ is the variance of the first-order difference of the signal Δs = s(i) − s(i −1) .
- Research Article
- Abstract
- Introduction
- Architecture of the Automated Spectrometer System
- Architecture of the Automated Spectrometer Signal Program
- Featureless Representation of the Spectra by Delta Modulation
- Similarity Determination between the Featureless Spectra Representations
- Evaluation and Results
- References
Similarity Determination between the Featureless Spectra Representations
The spectra are represented by 1/0 sequences. To compare different spectra we need a distance measure that can work on such a representation. Different measures are known from text comparison and DNA sequence analysis. We choose for this work the Hamming distance [13], the Levenshtein distance [14], and the Levenshtein-Damerau distance [15] and compare the performance of these measures on a data set of Raman spectrometer signals.
Hamming distance
The representation of a spectrum A and spectrum B is illustrated in Table 1. We assume that all spectra have the same length i and that the peaks are stable at their position (wavelength) in the spectra. Then we have to compare two binary vectors A and B. The distance d between these two binary representations is the number of bits in which the two vectors differ. This is the well-known Hamming Distance:


Levenshtein distance
Let dL(A,B)=Dm,n/n be the Levenshtein-Distance between the binary vectors A and B with m = |A |and n = |B| . The Levenshtein Distance between the binary vectors A and B is defined as the minimum of modifications needed to transform vector A in vector B. The allowed operations are substitution, inseration or delation of a single signal value.
Then the similarity between A and B is computed as follows:
D0,0 = 0
Di,0 = i for 1≤ i ≤ m
D j,0= j for 1≤ j ≤ n

Damerau-Levenshtein distance
Let dL(A,B)=Dm,n/n be the Damerau-Levenshtein Distance between the binary vectors A and B with m = A and n = B . The Damerau-Levenshtein Distance between the binary vectors A and B is defined as the minimum of modifications needed to transform vector A in vector B. The allowed operations are substitution, inseration or delation of a single signal value or the transposition of two adjacent single signal value. The Damerau-Levenshtein Distance in compared to the Levenshtein Distances has the translation as additional operation.
The matrix is compute as follows:
D0,0 = 0
Di,0 = i for 1≤ i ≤ m
D j,0= j for 1≤ j ≤ n

- Research Article
- Abstract
- Introduction
- Architecture of the Automated Spectrometer System
- Architecture of the Automated Spectrometer Signal Program
- Featureless Representation of the Spectra by Delta Modulation
- Similarity Determination between the Featureless Spectra Representations
- Evaluation and Results
- References
Evaluation and Results
Based on a data set of 30 spectrometer signals, each of the spectrometer signals has been processed and coded by delta modulation. The achieved results are presented in Section 7.1. The final outcome is a string of 0/1 bits. We first calculated the three distance measures: Hamming distance, Levenshtein distance, and the Damerau-Levenshtein distance. We evaluated our method by calculating the pairwise distance between the spectra and used the single-linkage clustering method to show the distance between the spectra based on the similarity measures.
Representation of the spectrometer signal by delta modulation
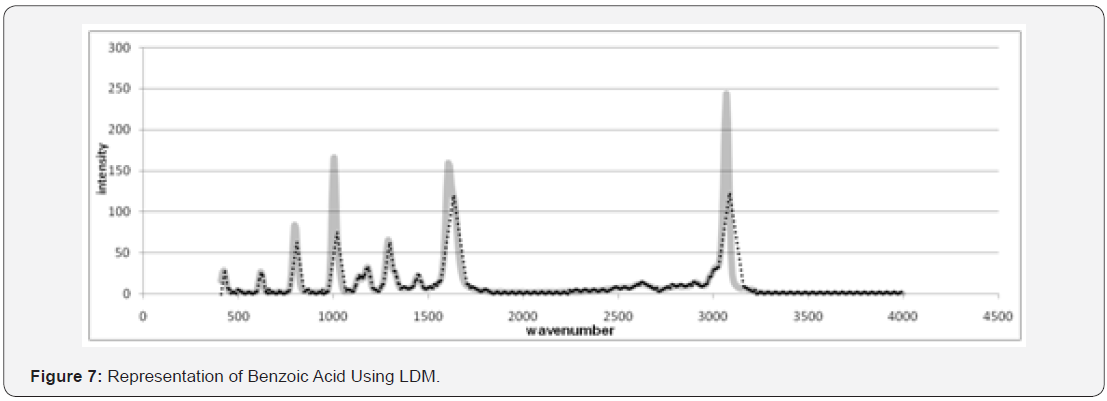
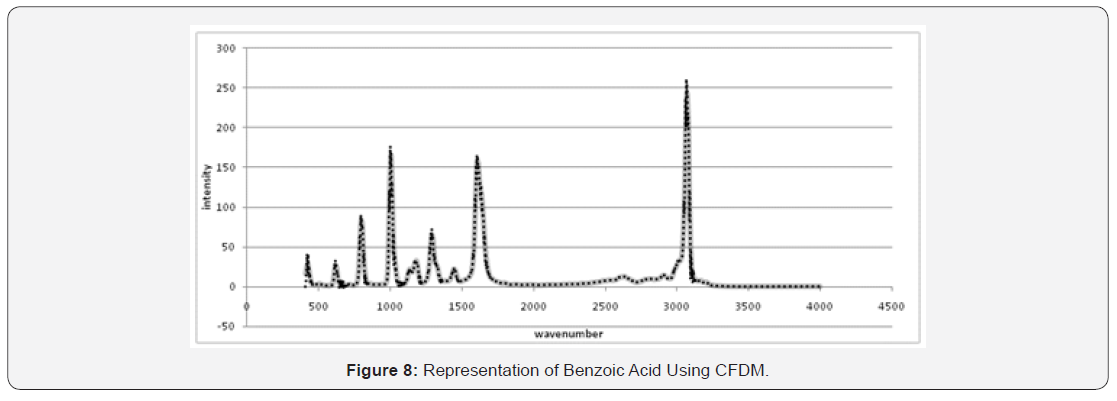
An exemplary representation of the real signal by the approximated signal of the delta modulator is shown in Figure 7 for linear delta modulation and in Figure 8 for constant factor delta modulation. The binary coded signal for both methods is shown in Table 2. It can be seen that the coded signal is different depending on the used delta modulation method. Table 3 shows the mean and maximum approximation error between the input signal and the approximated signal by the delta modulator. As expected, the CFMD method shows the best result. The mean error is 1.677 increments and the maximum error is 16.04 increments. The CVSDM has not been tested yet. Future work will address this method.


Results for similarity between the spectra
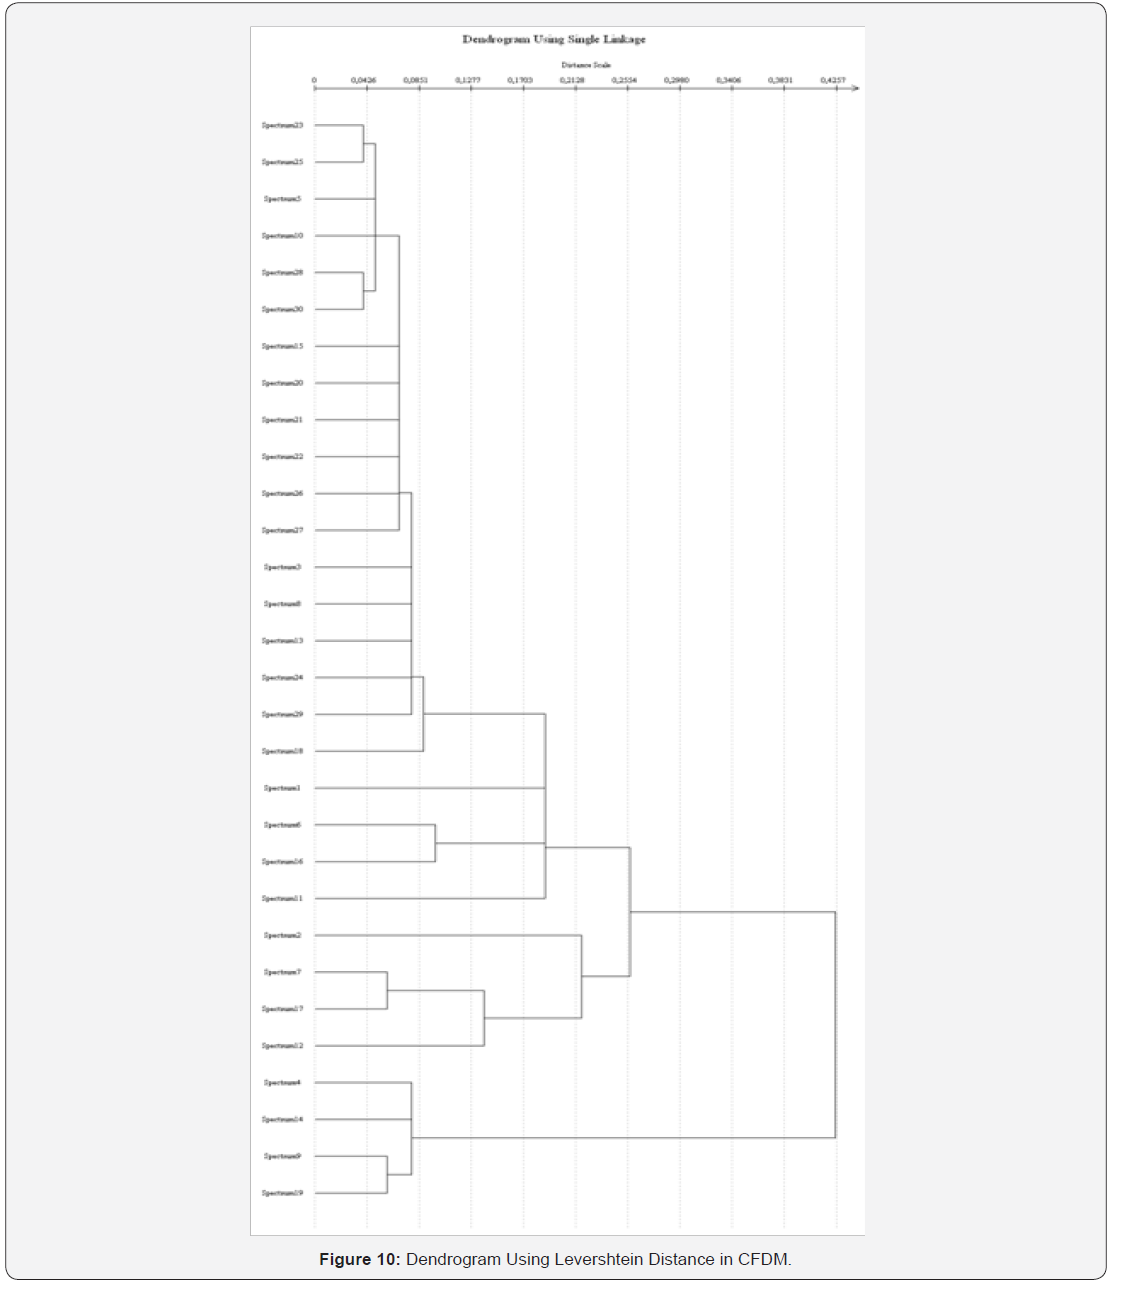
In Section 7.1, we have demonstrated that the CFDM delta modulator gives the best result for calculating the featureless representation of the signal. The results for the different similarity measures between the 30 spectra are shown in Figure 9-11. The Hamming distance shows the highest differences in similarity but does not represent the similar groups well (Figure 9). A much better representation of the similar groups is provided by the Levenshtein (Figure 10) and Damerau- Levenshtein similarity (Figure 11).

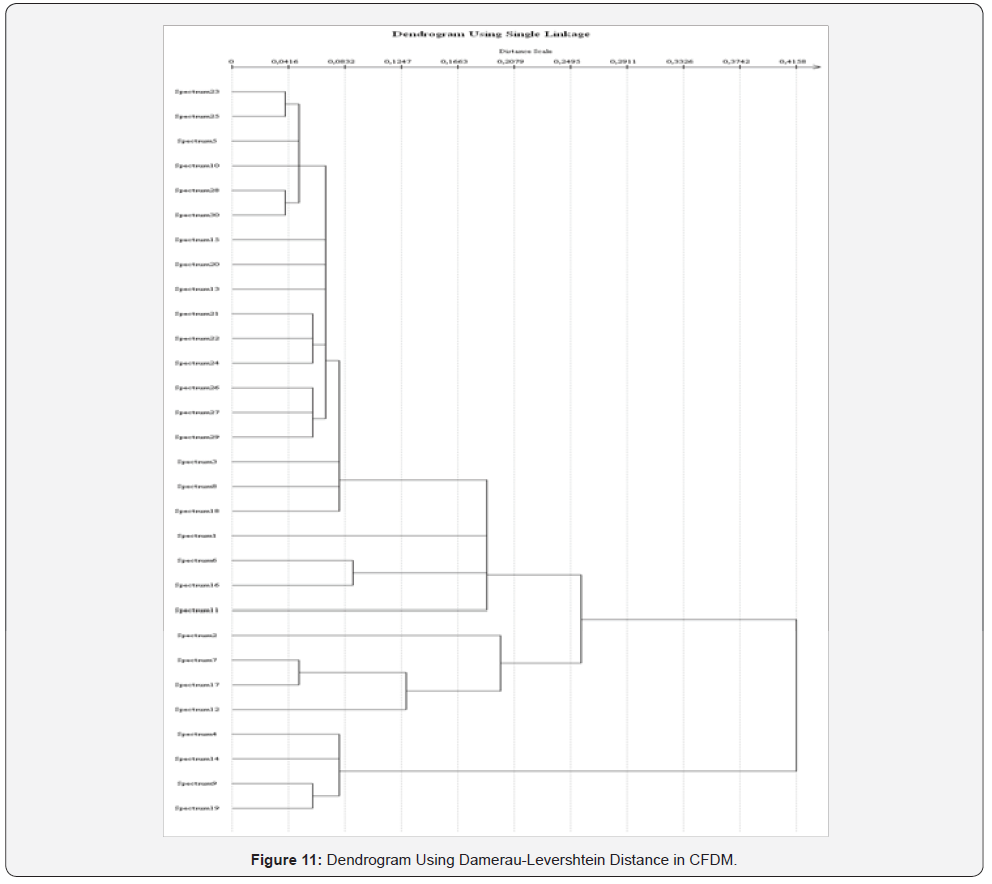
The featureless representation of the spectra by a 0/1 sequence is a good representation for a spectrometer signal. While coding the signal in a 0/1 sequence, the signal is also smoothed by a stepwise function. To keep the approximation error between the original signal and the coded signal small, an adaptive delta modulator has to be selected. In the experiment presented above, we used the CFDM delta modulation method instead of the linear delta modulator. An even better method might be the continuously variable slope delta modulator. Constructing such a modulator for this kind of signals is the aim of further work.
Three different similarity measures have been used: Hamming distance, Levenshtein distance, and the Damerau- Levenshtein distance. While the Hamming distance is very fast and simple to calculate, the latter two distances seem to represent the similar groups of spectras very well. However, these two distance measures are more computationally complex than the Hamming distance. The advantage of the Levenshtein and the Damerau-Levenshtein distances is that these distances can compare strings with different numbers of bits and can delete and substitute bits; it is therefore possible to eliminate small differences in the sequence caused by noise or by the behavior of the delta modulation.
- Research Article
- Abstract
- Introduction
- Architecture of the Automated Spectrometer System
- Architecture of the Automated Spectrometer Signal Program
- Featureless Representation of the Spectra by Delta Modulation
- Similarity Determination between the Featureless Spectra Representations
- Evaluation and Results
- References
References
- Janzen C, Delbrück H, Perner P (2006) MARAS-Marker Free RAMAN screening for molecular investigation of biological interactions, Project Report.
- Badger RM, Bauer SH (1937) Spectroscopic studies of the hydrogen bond. II. The shift of the O-H vibrational frequency in the formation of the hydrogen bond. J Chem Phys 5: 839-855.
- Callender R, Deng H (1994) Nonresonance raman difference spectroscopy: A general probe of protein structure, ligand binding, enzymatic catalysis and the structures of other biomolecules. Annu Rev Biophys Biomol Struct 23: 215-245.
- www.sacher-laser.com
- Zhao J, Carrabba MM, Allen FS (2002) Automated fluorescence rejection using shifted excitation raman difference spectroscopy. Applied Spectroscopy 56 (7): 834-845.
- www.s-and-i.de
- Altose MD, Zheng Y, Dong J, Palfey BA, Carey PR (2001) Comparing protein-ligand interactions in solution and single crystals by Raman spectroscopy. Proceedings of the national academy of science 98(6): 3006-3011.
- Savitzky A, Golay MJE (1964) Smoothing and differentiation of data by simplified least squares procedures. Analytical Chemistry 36(8): 1627-1639.
- Chong Un, Hwang Lee (1980) A Study of comparative performance of adaptive delta modulation systems, IEEE Trans. on Communications 28 (1): 96-101.
- Jayant NS (1970) Adaptive delta modulation with one-bit memory, The Bell System Technical Journal 49(3): 76-80.
- Tazaki S, Osawa H, Shigematsy Y (1977) A useful analytical method for discrete adaptive delta modulation. IEEE Trans. on Communications 25(2): 195-199.
- Perner P (2010) Datenreduktionsverfahren für technologische Industrierobotersteuerungen mit direkter Teach-in-Programmierung, (2nd edn.), (ISBN: 978-3-940501-16-5), ibai-publishing, Leipzig, India.
- Hamming RW (1950) Error detecting and error correcting codes. Bell System Technical Journal 29(2): 147-160.
- Levenshtein VI (1966) Binary codes capable of correcting deletions, insertions, and reversals. Soviet Physics Doklady 10(8): 707-710.
- Damerau F (1964) A technique for computer detection and correction of spelling errors. Communications of the ACM 7(3): 171-176.


