


Predicting Diabetic Readmission Rates: Moving Beyond Hba1c
Damian Mingle*
WPC Healthcare, Nashville, USA
Submission: January 13, 2017; Published: August 23, 2017
*Corresponding author: Damian Mingle, Chief Data Scientist, WPC Healthcare, 1802 Williamson Court, Brentwood, TN 37027, USA, Email: dmingle@wpchealthcare.com
How to cite this article: Damian M. Predicting Diabetic Readmission Rates: Moving Beyond Hba1c. Curr Trends Biomedical Eng & Biosci. 2017; 7(3):555707. 007 DOI: 10.19080/CTBEB.2017.07.555715.
Abstract
Hospital readmission is considered an effective measurement of care provided within healthcare. Being able to risk identify patients facing a high likelihood of unplanned hospital readmission in the next 30-days could allow for further investigation and possibly prevent the readmission. Current models, such as LACE, sacrifice accuracy in order to allow for end-users to have a straight forward and simple experience. This study acknowledges that while HbAlc is important, it may not be critical in predicting readmissions. It also investigates the hypothesis that using machine learning on a wide feature, making use of model diversity, and blending prediction will improve the accuracy of readmission risk predictions compared with existing techniques. A dataset originally containing 100,000 admissions and 56 features was used to evaluate the hypothesis. The results from the study are encouraging and can help healthcare providers improve inpatient diabetic care.
Keywords: Predictive modeling; 30-day readmission; Hospital readmission; Type 2 diabetes; Diabetes mellitus
Introduction
A survey conducted by the Agency for Healthcare Research and Quality (AHRQ) found that in the year 2011 more than 3.3 million patients were readmitted in the United States within 30-days of being discharged. Over $250 million was spent on treatment of readmitted diabetic patients in 2011 [1]. Current practices to identify at-risk diabetic patients are subjective: a clinician will assess the patient and decide what the appropriate care plan is for that individual. Research has shown that these subjective methods for determining readmission are slightly better than random guessing [2]. However, there are tools to objectively score readmission risk, such as LACE [3]. These objective tools are seen to be useful because end-users can make these calculations manually and offer improved accuracy over subjective techniques. Machine learning models can be used to create objective models which then can be used to measure risk [4]. These models are more complex, but may be able to create more accurate risk predictions that should lead to improved diabetic patient outcomes. This study investigates the hypothesis that advanced machine learning techniques can make use of a wide set of clinical features to improve diabetic readmission risk prediction over simpler objective measures like LACE while reducing hospital cost. An existing dataset and algorithms are used to test this hypothesis.
Background and related work
Many healthcare providers in the U.S. use LACE to identify at-risk patients. At its core LACE is a logistic regression model that makes use of a small set of features. LACE itself was derived from a set of 4812 patients, and validated on 1,000,000 patients using patient records from 2004 to 2008 [3].
In addition, numerous previous studies have analyzed the risk factors that predict readmission rates of diabetic patients. However, much of the research is focused on subsets of diabetic populations and solutions are derived from a smaller sample size than this study. In some cases, the results were based on demographic and socioeconomic factors that influence readmission rates [5]. In some cases, the models are unspecific in target and focus on general readmission for all-cause [6]. Our study considers data that covers demographic, clinical procedure-related and diagnostic-related features, as well as medication information for all ages to predict readmissions for diabetic patients within a 30-day window. We provide comprehensive results on features and the model performance is superior to those currently in use. Our goal was not an analysis of readmission cost as this is well documented by other researchers.
In our judgment, our work is the first of its kind structuring a machine learning framework, which analyses all age groups specifically for the diabetic population and unplanned readmissions within a 30-day window. Our study uses a considerably larger dataset which is more balanced when comparing to previous works. Accordingly, our results appear to be more reflective of the problem of unplanned readmissions within 30-days of discharge for diabetics of all ages within the United States. Other studies have not documented the typical performance metrics of machine learning classifiers. Our machine learning framework solves a general problem for diabetic patients who discharge from the hospital and as a single comprehensive solution can be easily implemented [7-15].
In addition to addressing the above gaps in the research, this work coves methods to identify potential modifiable risk factors leading to readmission rates. Machine learning identification of likelihood of readmission is the foundational step to understanding and developing protocols for better inpatient diabetes care. Our primary aim to have the results presented in this study be the baseline for any future work to compare.
Materials and Methods
Data assembly
We performed a secondary analysis of a multicenter prospective cohort study conducted between 1999-2008. The study involved patients discharged to the community from 130 hospitals. The data is provided by the Center for Clinical and Translational Research, Virginia Commonwealth University and is a de-identified abstract of the Health Facts database (Cerner Corporation, Kansas City, MO). This data was used to test the hypotheses that machine learning could predict the likelihood of readmission within the next 30-days for a diabetic patient. The data represents 10 years (1999-2008) of clinical care at 130 hospitals and integrated delivery networks through the United States: Midwest (18 hospitals), Northeast (58), South (28), and West (16). Most of the hospitals (78) have bed size between 100 and 499, 38 hospitals have bed size less than 100, and bed size of 14 hospitals is greater than 500. The dataset contains 50 features representing patient encounters: patient demographics, admission details, diagnoses and procedures (in ICD-9-CM format), laboratory data, and pharmacy data. Strack et al. [7] originally pulled the dataset to meet the following criteria:
- It is an inpatient encounter (a hospital admission).
- It is a "diabetic" encounter; that is, one during which any kind of diabetes was entered into the system as a diagnosis.
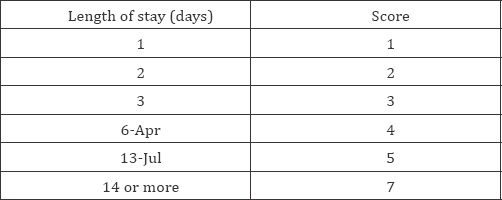
- The length of stay was at least 1 day and at most 14 days.
- Laboratory tests were performed during the encounter.
- Medications were administered during the encounter.
In total, there were 101,766 encounters available for analysis that satisfy these criteria. Each encounter was labeled with one of three classes ("<30", ">30", "NO") based on whether the patient was readmitted within 30 days ("<30"), readmitted in more than 30 days (">=30"), or did not have a recorded readmission ("NO"). Further information about the dataset can be found at http:// www.cioslab.vcu.edu/. (Table 1).

Data pre-processing
The original dataset was not ideally suited for a machine learning approach. In particular, we removed the "encounter ID" and "patient nbr" to avoid over fitting the model. Additionally, it would have been useful to have actual age and actual weight of the patient. While there were techniques used to work around these issues, none proved useful in testing. One of the more significant changes was enriching the dataset with "diagnosis groups": (Table 2). Finally, since this study is concerned with readmissions of patients with diabetes mellitus within a 30-day period from hospital discharge, we relabeled the target variable "1" for encounters that were marked "<30" and "0" otherwise [16-20].

Preliminary analysis and the final dataset
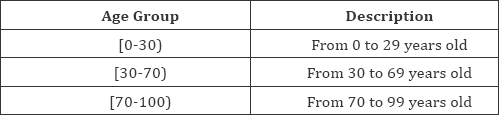
Our analysis demonstrates that there are unique diabetic readmission profiles within the following age groups:
We are making the original dataset inclusive with data augmentation and enrichment available (https://www. researchgate.net/publication/312493339_Diabetic_30-Day_ Unplanned_Readmission_by_Age_Group). Each of the groups has its own set of unique characteristics that we utilized when building our machine learning framework.
Machine learning methods
Classification: Identification of high-risk diabetic patients was posed as the problem of classifying whether a patient would be readmitted within 30-days of being discharged. Best practice is to make use of several machine learning algorithms, which is part of this study. Prior to training the classification algorithms, we randomly split our dataset into two distinct sets - the training and the test set. The training and test set consisted of 75% and 25% of the data. The parameters of each algorithm were chosen based on the classification performance evaluated by 10-fold cross-validation on the training set. The performance of all algorithms was evaluated on the test set. Each age group was treated as a subset of the entire available diabetic population, however the final models for each age group are viewed as independent of each other [21-29].
The configuration for the [0-30) age group was uniquely created within the machine learning model framework to optimize understanding from the diabetic profile of this patient population (Figure 1). The data represented in the graph above is all the patient encounters that meet the single criteria of age, [00-30). The data is treated as three distinct datasets and preprocessing is completed with a single model as the focus. As each model experiences each diabetic patient encounter, it will make a prediction that will be stored until an ensemble is created.

The models include:
- Extreme Gradient Boosted Trees- we made use of ordinal encoding of categorical variables and missing value imputations.<
- Gradient Boosted Greedy Trees Classifier- we implemented One-Hot Encoding, univariate credibility estimates with Elastic Net, category count, missing value imputations, search for differences, and search for ratios.
- Extra Trees Classifier (Gini)- we utilized One-Hot Encoding, univariate credibility estimates with Elastic Net, missing value imputations, search for differences, and search for ratios.
The ensemble of all models for [0-30) was averaged using the following
A= 1/n x ∑_(i=1)^n▒ x_i

where A equals average, n equals the number of models being averaged, and x_i equals the predicted probability of each patient encountered. Other important measures for this ensemble are: (Table 3).
Configuration for (30-70): The machine learning framework produced a model for the (30-70) age group, which is the most complex of three age groups. There was a total of 8 different models averaged together to produce a final output (Figure 2).

Although a few of the 8 models seem the same, there are unique preprocessing steps with each model, along with Grid Search, to create a different perspective of the same machine learning task.
- Random Forest Classifier (Gini): ordinal encoding of categorical variables, a converter for text mining, auto-tuned word N-Gram text modeler using token occurrences, and missing values imputation.
- Extreme Gradient Boosted Trees Classifier with Early Stopping: ordinal encoding of categorical variables, converter for text mining, auto-tuned word N-gram text modeler using token occurrences, missing values imputed.
- Nystroem Kernel SVM Classifier: One-Hot Encoding, converter for text mining, auto-tuned word N-gram text modeler using token occurrences, transform on the link function scale, standardized, missing value imputation,Ridit.
- Balanced Random Forest Classifier (Entropy): Ordinal encoding of categorical variables, category count, converter for text mining, auto-tuned word-n-gram text modeler using token occurrences, missing values imputed.
- Gradient Boosted Trees Classifier with Early Stopping: Ordinal encoding of categorical variables, category count, converter for text mining, auto-tuned word-N- gram text modeler using token occurrences, missing values imputed.
- Gradient Boosted Greedy Trees Classifier with Early Stopping: One-Hot Encoding | Univariate credibility estimates with Elastic Net | Category Count | Converter for Text Mining | Auto-Tuned Word N-Gram Text Modeler using token occurrences | Missing Values Imputed | Balanced ExtraTrees Classifier (Gini) | Search for differences | Search for ratios | Gradient Boosted Greedy Trees Classifier with Early Stopping
- Extreme Gradient Boosted Trees Classifier with Early Stopping: Ordinal encoding of categorical variables | Category Count | Converter for Text Mining | AutoTuned Word N-Gram Text Modeler using token occurrences | Missing Values Imputed | Balanced Extra Trees Classifier (Gini) | Search for differences | extreme Gradient Boosted Trees Classifier with Early Stopping
- Extreme Gradient Boosted Classifier with Early Stopping: Ordinal encoding of categorical variables | Matrix of word-grams occurrences | Pair wise Cosine Similarity | Converter for Text Mining | Auto-Tuned Word N-Gram Text Modeler using token occurrences | Missing Values Imputed | extreme Gradient Boosted Trees Classifier with Early Stopping
The ensemble method to average the 8 predicted probabilities for each diabetic patient by encounter is the same as the [0-30) equation. Below are other important measures for this age group: (Table 4).

Our machine learning framework produced another set of 3 models that captured well the underlying data pattern for age group [70-100). Although it is the same number of models as [00-30), the models themselves are different (Figure 3).
Tree top models resulted in the best model performance of those we tested. The below models demonstrate the preprocessing that was completed before sending as input to the models themselves.
Balanced Extra Trees Classifier (Gin): One-Hot Encoding | Univariate credibility estimates with Elastic Net | Converter for Text Mining | Auto-Tuned Word N-Gram Text Modeler using token occurrences | Missing Values Imputed | Balanced Extra Trees Classifier (Gini) | Search for differences | Search for ratios | Balanced Random Forest Classifier (Gini)

Extreme Gradient Boosted Trees Classifier with Early Stopping: Ordinal encoding of categorical variables | Category Count | Converter for Text Mining | Auto-Tuned Word N-Gram Text Modeler using token occurrences | Missing Values Imputed | Balanced Extra Trees Classifier (Gini) | Search for differences | extreme Gradient Boosted Trees Classifier with Early Stopping
Extreme Gradient Boosted Trees Classifier with Early Stopping: Ordinal encoding of categorical variables | Matrix of word-grams occurrences | Pair wise Cosine Similarity | Converter for Text Mining | Auto-Tuned Word N-Gram Text Modeler using token occurrences | Missing Values Imputed | extreme Gradient Boosted Trees Classifier with Early Stopping
Unique to this final model was the concept of meta-model approach-to use model outputs of 1,2, and 3 for the (70-100) age group as input into an Elastic-Net Classifier (L1/ Binomial Deviance). This type of classifier is based on block coordinate descent. Elastic Net is an extension of logistic regression where the optimizer makes an attempt to find a parsimonious model by having a preference for simpler models. In this context, simpler is defined as having coefficients with smaller absolute values as well as fewer non-zero coefficients. In practice, this helps the model deal with co-linear variables and can also produce models that are less prone to over fitting and generalize better to new data. Elastic-Net is useful in machine learning problems where there are multiple features that are correlated with one another. For completeness, we provide the additional important measures and their corresponding values to compare with the other final models produced for age groups (00-30), (30-70), and (70-100): (Table 5).

Feature analysis
In our study we decided to augment and enrich the original features in an effort to maximize the signal provided in each age group. We implemented several engineered features that we either gained intuition about through the initial study of the data or through the domain expertise of clinicians. While this table does not represent all that can be done with this data, it does represent what we studied: (Table 6).

Because various machine learning models induce learning from a variety of perspectives (information-based, similarity- based, probability-based, error-based), it was important to select features that provided the greatest context for each machine learning model. In our case, feature selection proved to be significant in improving model performance in all three age groups for diabetic patients. No age group had the exact same feature importance ascribed to the same top 5 features. As can be seen below in Table 7-9, items in bold are unique within the top 5 ranked features across all models. The final model for the age group [0-30) worked with over 74 features. We ranked the top 5 features for this model by informativenes show informative they are relative to the other features of that age group: [8]. The "Number of emergency" feature and the feature engineered by dividing the number of emergency visits by the sum of lab procedures plus medications were both unique among all three models: In the case of the age group (30-70) final model, we worked with 79 features that shared the same features as the (70-100} age group


Like the age group [00-30), the age group (70-100) resulted They were the concatenation of discharge disposition with time in two unique features ranking in the top 5 out of 79 features. in hospital and concatenation of race with discharge disposition:
It is significant that all models did not utilize "A1c" results from patients when making a predication for unplanned hospital readmissions. In our study we see that only very few clinicians perform the measurement of HbA1c (18.4%) in the inpatient setting. Many researchers suggest that further attention to the HbA1c by a clinician before a diabetic patient is discharged from the hospital may prove helpful in patient outcomes and lower cost of inpatient care [7]. In our study, we aimed to develop learning models that could be predictive without the HbA1c measurement, the primary reason being clinician judgment and hospital protocols vary greatly.
Evaluation method
Each algorithm was evaluated using a 10-fold stratified cross-validation. Cross-validation is an evaluation technique where the dataset is randomly but evenly distributed into a number of fold (this study-10). The learning algorithm is trained on all but one of the folds and tested on the held-out fold. This repeated for each possible holdout fold. Stratified cross-validation attempts to preserve the class distribution between folds so that each fold is representative of the date full dataset. The process of crossvalidation is repeated ten times to ensure that particular random initialization does not bias the overall result.
All algorithms were evaluated using the area-under- the-curve (AUC), which is equivalent to the c-statistic in this binary classification scenario. The AUC is the probability that a randomly chosen positive instance (this study, "<30" represented as "1") ranks higher than a randomly chosen negative one (this study, "0"). An AUC of 0.5 or less indicates that the algorithm is not better than a random guess while an AUC of 1.0 indicates perfect classification. Previous research in readmission risk has achieved AUCs between 0.5 and 0.7.
AUC is a graphical plot that illustrates the performance of a binary classifier system as its discrimination threshold is varied. It is created by plotting the fraction of true positives out of the positives vs the fraction of false positives out of the negatives, at various threshold settings. TPR is also known as sensitivity, and FPR is one minus the specificity or true negative rate. In all cases our machine learning models are compared to the LACE index AUC, calculated by comprising a threshold of each index value to the true positive and false positives achieved by that threshold.
LACE index scoring tool for risk assessment of hospital readmission
LACE is seen as the current in-use solution for readmissions for the U.S. One considerable benefit to LACE is the interpretability of the index itself. While many hospitals use the index in a computer assisted way, manual calculation is certainly possible. Further work is required to identify additional factors that may increase the discrimination or accuracy of the index. LACE is known to have limitations in that it was derived over a small sample size which may prevent it from being useful in the hospitals population if they do not overlap.
There are four steps to calculating the LACE Score Risk of Readmission [3]:
Step 1: Length of stay (including day of admission and discharge) days
Step 2: Acuity of Admission
If you can answer "yes” to the question,” Was the patient admitted to the hospital via the emergency department?” then you can add "3” to the LACE Score from step 1.
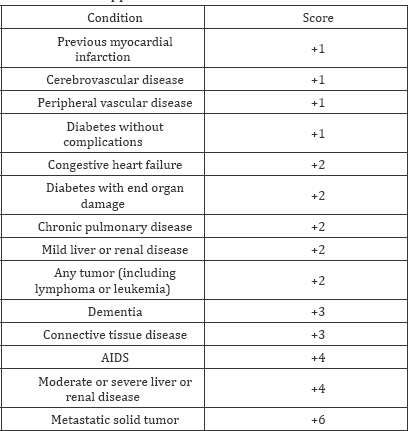
Step 3: Comorbidities
The patient may have multiple comorbidities. If the total score in this section is between 0 and 3 then "3” should be added to the LACE Score. If the score is ≥4 than "5" is added to the LACE Score. Additional information about what is meant by these conditions is in Appendix A.
Step 4: Emergency Department Visits
Determine how many times the patient has visited an emergency department in the six months prior to admission (not including the emergency department visit immediately preceding the current admission) and ad that figure to the LACE score. However, in cases where the visits are => 4 then add only "4" to the LACE score. Once LACE steps 1 through 4 are complete, then total the score. If in total a patient receives a LACE Score of ≥10 then the patient is labeled "high risk for readmission." LACE attempts to lessen the burden for clinicians by requiring only a very few number of features that can be found within a patient's record. The non-condition specific nature of LACE, as it relates to diabetes mellitus and its simple approach, renders the result slightly better than random.
Cost analysis
It is well known that hospital readmissions are costly to the healthcare system. Research shows that the cost of readmission of diabetes mellitus and its complications is $251 million for 23,700 total readmissions. Hence the cost per readmission is approximately equal to $10,591 [1]. In this secondary analysis the average length of stay for the diabetic patient encounter is 4.396 days, leading us to believe the cost for one-day admission is considered to be $2,409.
This is of particular importance to develop costing models around the benefit of having a proper machine learning solution delivered to hospital clinicians in a low-tech way. By establishing a one-day review of a patient before actual discharge there could be risk-reward trade-off that would be appealing to many healthcare settings.
Results and Discussion
The results from performing 10-fold cross-validation are presented in (Table 10 & 11):


In conclusion, while providers of care may make the decision not to obtain a measurement of HbAlc for patients with diabetes mellitus during the stay at the hospital, there exist other useful predictors of readmission rates that may prove valuable in the development of strategies to reduce readmission rates and associated costs for the care of these individuals. Our machine learning approach yielded a 26% improvement using over 100,000 patient encounters from 130 U.S. hospitals over a 10- year period compared to LACE, which was derived from 4,800 patients over a 4-year period.
Conclusion and Future Work
Our research suggests that applying a machine learning approach to a larger feature set as well as novel approaches to model diversity and model blending can improve on simpler readmission models such as LACE, potentially improving patient outcomes and lowering inpatient cost to hospitals. The highest performing models were those developed around age groups rather than a general "all" age group. This study targets diabetic patients only; however, we believe this early work sets the stage for further research to improve the accuracy of readmission risk for other top health conditions like heart disease, Schizophrenia, COPD, etc. An improved dataset, one that includes other critical features such as age, weight, and lab values, could prove valuable and are worth further study. Additional discovery may exist in modeling by condition group name (circulatory, respiratory, diabetes) as a primary condition. Also, suggesting a "next step" in transitions of care (home health, SNF, rehab facility) for a patient's optimal outcome may prove useful within healthcare.
Conflict of Interest
The authors declare that they have no conflict of interests.
Acknowledgment
The authors thank Cerner Corp. and the VCU cent for Clinical and Translation Research for the data used in the study. The authors appreciate the information available through organizations such as American Diabetes Association, International Diabetes Federation, and the Juvenile Diabetes Research Foundation. The authors thank WPC Healthcare for supporting this study.
References
- Hines AL, Barrett ML, Jiang HJ, Steiner CA (2014) Conditions with the largest number of adult hospital readmissions by payer 2011. Healthcare Cost and Utilization Project.
- Allaudeen N, Schnipper JL, Orav EJ, Wachter RM, Vidyarthi AR (2011) Inability of providers to predict unplanned readmissions. J Gen Intern Med 26(7): 771-776.
- van Walraven C, Dhalla IA, Bell C, Etchells E, Stiell IG, et al. (2010) Derivation and validation of an index to predict early death or unplanned readmission after discharge from hospital to the community. CMAJ 182(6): 551-557.
- Mingle D (2015) A Discriminative feature space for detecting and recognizing Pathologies of the vertebral column. International Journal of Biomedical Data Mining 04(01).
- Jiang HJ, Stryer D, Friedman B, Andrews R (2003) Multiple hospitalizations for patients with diabetes. Diabetes care 26(5): 14211426.
- Hosseinzadeh A, Izadi MT, Verma A, Precup D, Buckeridge DL (2013) Assessing the Predictability of Hospital Readmission Using Machine Learning. In IAAI.
- Strack B, DeShazo JP, Gennings C, Olmo JL, Ventura S, et al. (2014) Impact of HbA1c measurement on hospital readmission rates: analysis of 70,000 clinical database patient records. BioMed Research International 2014: 11.
- Mingle D (2017) Controlling Informative Features for Improved Accuracy and Faster Predictions in Omentum Cancer Models. Current Trends in Biomedical Eng & Biosci 1(2): 1-6.
- Blondel M, Seki K, Uehara K (2013) Block coordinate descent algorithms for large-scale sparse multiclass classification. Machine learning 93(1): 31-52.
- Britton KA, Aggarwal V, Chen AY, Alexander KP, Amsterdam E, et al. (2011) No association between hemoglobin A1c and in-hospital mortality in patients with diabetes and acute myocardial infarction. Am Heart J 161(4): 657-663.
- Chen T, He T (2015) Higgs boson discovery with boosted trees. In: Cowan (Ed.), JMLR: Workshop and Conference Proceedings, 42: 69- BO.
- Forsythe CE (2014) Predictive Risk Modelling for Hospital Readmissions. University of Waikato.
- Friedman B, Basu J (2004) The rate and cost of hospital readmissions for preventable conditions. Med Care Res Rev 61(2): 225-240.
- Friedman J, Hastie T, Tibshirani R (2001) The elements of statistical learning. Springer, Berlin: Springer series in statistics (Volume 1).
- Geiss LS, Pan L, Cadwell B, Gregg EW, Benjamin SM, et al. (2006) Changes in incidence of diabetes in US adults, 1997-2003. Am J Prev Med 30(5): 371-377.
- Geurts P, Ernst D, Wehenkel L (2006) Extremely randomized trees. Machine learning 63(1): 3-42.
- Halkos ME, Puskas JD, Lattouf OM, Kilgo P, Kerendi F, et al. (2008) Elevated preoperative hemoglobin A1c level is predictive of adverse events after coronary artery bypass surgery. J Thorac Cardiovasc Surg 136(3): 631-640.
- Howell S, Coory M, Martin J, Duckett S (2009) Using routine inpatient data to identify patients at risk of hospital readmission. BMC Health Serv Res 9: 96.
- Kim H, Ross JS, Melkus GD, Zhao Z, Boockvar K (2010) Scheduled and unscheduled hospital readmissions among diabetes patients. Am J Manag Care 16(10): 760-767.
- Levetan CS, Passaro M, Jablonski K, Kass M, Ratner RE (1998) Unrecognized diabetes among hospitalized patients. Diabetes Care 21(2): 246-249.
- Lichman M (2013) UCI machine learning repository
- Pittas AG, Siegel RD, Lau J (2004) Insulin therapy for critically ill hospitalized patients: a meta-analysis of randomized controlled trials. Arch Intern Med 164(18): 2005-2011.
- Shah RV, Altman RK, Park MY, Zilinski J, Leyton MJ, et al. (2012) Usefulness of hemoglobin a 1c to predict outcome after cardiac resynchronization therapy in patients with diabetes mellitus and heart failure. Am J Cardiol 110(5): 683-688.
- Siegelaar SE, Hoekstra JB, DeVries JH (2011) Special considerations for the diabetic patient in the ICU; targets for treatment and risks of hypoglycaemia. Best Pract Res Clin Endocrinol Metab 25(5): 825-834.
- Silverstein MD, Qin H, Mercer SQ, Fong J, Haydar Z (2008) Risk factors for 30-day hospital readmission in patients? 65 years of age. Proc (Bayl Univ Med Cent) 21(4): 363-372.
- Stolker JM, Spertus JA, McGuire DK, Lind M, Tang F, et al. (2012) Relationship between glycosylated hemoglobin assessment and glucose therapy intensification in patients with diabetes hospitalized for acute myocardial infarction. Diabetes Care 35(5): 991-993.
- Umpierrez GE, Isaacs SD, Bazargan N, You X, Thaler LM, et al. (2002) Hyperglycemia: an independent marker of in-hospital mortality in patients with undiagnosed diabetes. J Clin Endocrinol Metab 87(3): 978-982.
- Vinik R, Clements J (2011) Management of the hyperglycemic inpatient: tips, tools, and protocols for the clinician. Hospital Practice 39(2): 4046.
- Williams C, Seeger M (2001) Using the Nyström method to speed up kernel machines. In Proceedings of the 14th annual conference on neural information processing systems 161322: 682-688.


