


Enhancing Traffic Conflict Analysis at Signalized Intersections Using 3D Convolutional Neural Network-Based Detection and Post-Processing Algorithms for Safety Assessment
Ahmed Mohamed*, Lizhe Li and Mohamed Ahmed
Department of Civil and Architectural Engineering, and Construction Management, University of Cincinnati, USA
Submission: September 09, 2024; Published: September 16, 2024
*Corresponding Author: Ahmed Mohamed, Graduate Research Assistant, Department of Civil and Architectural Engineering, and Construction Management, University of Cincinnati, Ohio, USA
How to cite this article: Ahmed M, Lizhe L, Mohamed A. Enhancing Traffic Conflict Analysis at Signalized Intersections Using 3D Convolutional Neural Network-Based Detection and Post-Processing Algorithms for Safety Assessment. Civil Eng Res J. 2024; 15(1): 555904. DOI 10.19080/CERJ.2024.15.555904
Abstract
Traffic conflict analysis has gained significant attention over the last few years. Recent research has made significant progress in the development of detection and tracking systems by utilizing various technologies such as closed-circuit televisions (CCTVs), unmanned aerial vehicles (UAV), and sensor fusion exploiting light detection and ranging (LiDAR). By examining the challenges hinder the widespread adoption of traffic conflict analysis using artificial intelligence in safety assessment techniques, it is found that the limitations are broken into three categories; monitoring device, detection algorithm, and outputs processing related limitations. In a trial to overcome these limitations, this study utilized Convolutional Neural Network (CNN) based algorithm, that is essentially developed for autonomous vehicle systems, to detect and track road users at signalized intersections. The primary advantage of this algorithm lies in its ability to depict road users through the utilization of three-dimensional bounding cuboids. This representation method simplifies the entire traffic data processing procedure and improves the detection for better establishment of an automated safety assessment tool utilizing artificial intelligence. To refine the precision of the tracking process, this study further incorporates a suite of post-processing algorithms. These are specifically designed for data augmentation, reconstruction of seamless trajectories, and the accurate estimation of vehicle states and indicators. The algorithm has been examined on various video footages and proved its detection superiority for high traffic volumes at intersections with an overall precision of 95.08%, and a recall of 92.81%. It exhibited exceptional accuracy and efficacy in identifying a range of crucial conflict scenarios, achieved through the application of four unique traffic conflict indicators.
Keywords: Artificial Intelligence; Computer Vision; Vehicle Trajectory; Vehicle Detection; Signalized Intersections; Conflict Analysis; Traffic Safety
Abbreviations: CCTVs: Closed-Circuit Televisions; UAV: Unmanned Aerial Vehicles; LiDAR: light Detection and Ranging; CNN: Convolutional Neural Network; TTC: Time-to-Collision; PET: Post Encroachment Time; Mos: Moving objects; ARCIS: Automated Roadway Conflict Identification System; Mask R-CNN: Mask Region Convolutional Neural Network; CSRT: Channel and Spatial Reliability Tracking; IOU: Intersection Over Union; KITTI: Karlsruhe Institute of Technology and Toyota Technological Institute
Introduction
Intersection crashes account for 20% and 40% of total fatalities and injuries, respectively, on different roadway types in the United States [1]. This can be attributed to the higher occurrence of complex interactions among various road users at intersections [2]. Traditionally, a detailed historical crash report for a specific intersection or roadway segment, a minimum of three years’ worth of crash records, has been used to assess its operation and identify primary crash contributing factors [3-5]. To expedite the assessment process, alternative approaches have been adopted, such as utilizing traffic conflicts to develop more efficient and effective analysis techniques over specific time frames [6,7]. The term “Traffic Conflicts” was introduced by Perkins and Harris in 1967 [8], and was further refined to describe traffic conflicts as observable situations where two or more road users approach each other in space and time, posing a risk of collision if their movements remain unchanged [9]. Analyzing traffic conflicts provides more convenient means of assessment since they are considered as key indicators for crash potential and their occurrence is relatively higher compared to actual crashes.
General indicators used for classifying traffic conflicts include Time-to-Collision (TTC), Post Encroachment Time (PET), and deceleration measurements. Other indicators are derived from these three general indicators [10]. Although other indicators related to TTC, such as time-to-line crossing or time-to-zebra, are used less frequently in defining traffic conflicts, they are still valuable [11]. Notably, measuring conflicting speeds is an important indicator for identifying the relationship between conflicts and crashes and their severities. While the level of risk is categorized into three types: (a) critical conflicts occurring at right angles or head-on, (b) average conflicts that may cause rear-end collisions, and (c) and minimum severity conflicts [12].
This study is devoted to assessing the safety within intersections areas by using the implemented surveillance cameras. A new detection method, utilizing Convolutional Neural Network (CenterNet), is proposed to improve road users’ trajectories accuracy for safety analysis. Additionally, a spatial analysis method is developed to identify traffic conflicts at signalized intersections. This is followed by the implementation of various post-processing algorithms to augment the precision of vehicle tracking. This is achieved through error analysis, data reduction and the reconstruction of vehicle trajectories, encompassing elements such as position, speed, and acceleration of vehicles. Finally, these improved tracking results are used to estimate various traffic indicators, thereby demonstrating the effectiveness of the proposed tracking process in this paper.
The organization of this study is as follows; the following section presents the literature review on traffic conflict detection techniques. Section 3 describes the followed methodology in the collection of video data, observation process, and the conduction of algorithm formulations. In section 4, the extracted outputs will be validated and assessed. Section 5 introduces the post-processing algorithms whereas the outputs will be analyzed and processed to remove the errors, then, the accuracy evaluations of the proposed algorithm will be presented. Finally, the summary and conclusions are presented in Section 6.
Background
Early studies for detecting traffic conflicts utilized manual techniques by training human observers on different conflict types and selected thresholds [13,14]. These manual observation procedures were classified into subjective and objective methods [15]. The subjective methods involved trained observers investigating conflicts and classifying their severity level. Objective methods relied on time measurements, with TTC being a fundamental measure used in these approaches. Manual techniques faced limitations in terms of coverage, particularly in hazardous areas and adverse weather conditions. Moreover, they incurred high costs for hiring and training observers, and there was inconsistency in judgments among observation teams [16,17].
Based on the rapid and incessant development in the computer vision field, tracking techniques for vehicles using different types of cameras placed at specific locations along roadway sections have been developed [18]. Computational algorithms have been employed to detect traffic conflicts based on these tracking methodologies [19,20]. Four types of objects tracking techniques have been developed, including 3D Model-based tracking [21], Region-based tracking [22-25], Contour-based tracking [26], and Feature-based tracking [27,28].
A hybrid method that integrates Kalman filtering and Kanade- Lucas-Tomasi feature tracker has been developed for Feature-based tracking on highway sections [29]. This approach enabled the computation of traffic parameters such as flow rate, average speed, and average spatial headway for each lane separately using the proposed methodology in [30]. The entrance and exit regions were determined using a homography that transformed 3D images into 2D along a highway section plan. A simple transformation matrix was utilized to compute the real-time coordinates of selected features, vehicles corner points, from the 3D image, Equation 1. Kalman filter was employed to maintain the noisy measurements utilizing normalized correlation. Then, positions and velocities were calculated ( X ,Y, X ,Y ). However, the approach showed a decent accuracy in the correlation between the computation and real traffic parameters, the errors distribution showed inaccurate results for flow, density, and headways calculations.

The approach was further extended by [28] to include vehicle tracking at intersections. The utilized algorithm was adopted from [29] with a modification in the transformation matrix to account for the geometric features specific to intersections. The overall results were satisfactory, achieving a vehicle detection accuracy of 88.4%. The tracking system demonstrated efficient performance in handling pedestrians and two-wheeled vehicles. However, several errors were identified in feature grouping at far distances, errors caused by camera jitter, issues arising from over-segmentation of trucks and buses, and instances of over-grouping. To address these common challenges in tracking systems, [27] proposed a hybrid strategy to resolve problems related to appearance and disappearance, splitting, and partial occlusion by leveraging the interaction between objects and regions’ characteristics. The technique demonstrated good accuracy and allowed real-time execution of all algorithm components on a standard PC, except for the region segmentation stage.
Another study conducted by [23] investigated traffic conflicts at intersections using video monitoring, employed a combination of low-level image-based tracking and a high-level Kalman filter for position and shape estimation. The image segmentation process utilized a mixture of Gaussian models as described in [31]. Moving objects (MOs) were represented by blobs. The tracking process involved determining the bounding box for each moving object at each frame based on timestamps, labels, velocities, and other features related to the blobs. A visualization module was developed based on extracted results, and a conflict detection module accompanied with a friendly user interface were utilized to predict potential collisions between vehicles by comparing the measured distances between bounding boxes to a minimum threshold value.
The utilization of drones in safety analysis has been explored in previous research [32]. One notable contribution is the CitySim dataset, which consists of drone-based vehicle trajectories extracted from 1140 minutes of drone videos recorded at 12 different locations. This dataset encompasses various road geometries and intersection types, providing valuable insights for safety evaluation. Building upon this work, Wu et al. introduced an automated traffic safety diagnostics solution called “Automated Roadway Conflict Identification System” (ARCIS) [33]. The system employs a Mask Region Convolutional Neural Network (Mask R-CNN) to enhance vehicle detection in UAV videos. Subsequently, a channel and spatial reliability tracking algorithm is used to track the detected vehicles and generate vehicle trajectories, then, size and location data were extracted based on pixel-to-pixel masks. The study focuses on calculating PET at the pixel level, enabling the identification of conflicts by comparing the PET values with multiple specific thresholds.
In a recent study by Abdel-Aty et al. [34] videos from CCTV cameras were utilized to detect 3D vehicles key points by employing Mask-RCNN bounding box and occlusion-Net algorithms. A transformation algorithm was employed to convert the 3D coordinates to 2D coordinates. The method’s efficiency was evaluated by comparing the results with ground truth data obtained from a drone video camera installed at the center of the intersection, providing a bird’s-eye perspective. The intersection was divided into three regions: the intersection entrance area, the within-intersection area, and the intersection exit area [35]. An integrated system of algorithms was used, including ARCIS, to perform vehicle detection and tracking tasks using UAV images. Vehicle trajectories were obtained using the Channel and Spatial Reliability Tracking algorithm (CSRT). A comparison between the detection and tracking results was conducted using the intersection over union (IOU) metric. The study showed that the presented framework significantly improved the precision of localization from the 2D plan view. PET values were successfully utilized to identify traffic conflicts between vehicles.
Following this research, another study proposed an integrated detection system that addressed the aforementioned limitations by combining CCTV cameras, LiDAR, sensor fusion, trajectory extraction, and safety evaluations [36]. The system workflow involved real-time detection using both CCTV cameras and LiDAR simultaneously. The extracted detections were then processed using a sensor fusion module to generate vehicle trajectories. The methodology demonstrated real-time detection and tracking capabilities. The precision rates for camera and LiDAR were 90.32% and 97%, respectively, while the fusion technique correctly detected 97.38% of the vehicles. However, this study had limitations, including the lower recall percentage for LiDAR and the exclusion of pedestrians and bicyclists, which resulted in the exclusion of conflicts involving vulnerable road users.
These recent studies demonstrate the ongoing efforts to leverage CCTV cameras, drones, LiDAR, and sensor fusion techniques for traffic monitoring, vehicle detection, tracking, and safety analysis. By combining multiple data sources and advanced algorithms, researchers aim to improve the accuracy and efficiency of existing systems and address the challenges associated with occlusions, over-segmentation, and over-grouping. However, there are several constraints impeding the broader adoption of these techniques in safety assessment processes. These include restrictions on drone flight altitude, the limited duration for real-time surveillance, challenges presented by adverse weather conditions, and the precise alignment required to match data extracted from LiDAR and surveillance cameras. Additionally, the substantial costs associated with implementing and calibrating these techniques further limit their widespread use. This study introduces a new tracking technique that relies on surveillance cameras only. Integrating with computer vision and neutral network algorithm, this approach minimally mitigates the impact of previously described factors.
Two main contributions have been made in this paper: (a) the introduction of a detailed CNN-based algorithm, CenterTrack, to detect road users, pedestrians and vehicles, using the mounted surveillance cameras at signalized intersections. The monocular 3D detection ability of CenterTrack provides better detections at traffic congestions by estimating the occluded edges, subsequently, eases the transformation process to the top-down view, and (b) a comprehensive post-processing approach that includes data reduction, trajectory smoothing, and the estimation of vehicle states and traffic indicators. By the conclusion of this paper, a number of figures substantiate that the implement of this comprehensive tracking algorithm and data post-processing procedure significantly enhances the accuracy of traffic tracking results. These acquirements serve in the proposed detection framework of traffic conflicts at signalized intersections by employing four conflicts indicators and applying the principles of extreme value theory.
Methodology
A comprehensive methodology was employed, consisting of several steps. Initially, a set of videos at a signalized intersection were recorded, observed for traffic conflicts instances and thoroughly revised to serve in the detection and analysis framework. The CenterTrack algorithm was utilized to track road users in the selected video sequences. To assess the detection accuracy of CenterTrack, a state-of-the-art YOLOv7 algorithm was employed. Subsequently, data post-processing techniques were applied to validate the extracted coordinates, transform them from the image plane to a top-down view, and refine the trajectories of the road users. To evaluate the performance of the proposed framework, it was tested on a set of extracted traffic conflict incidents. Traffic conflict indicators were then calculated to identify instances of traffic conflicts. The proposed framework for the traffic conflict detection and analysis by employing CenterTrack algorithm is shown in (Figure 1).

Data Preparation
A total of 40 hours of real-time and previously recorded video footage were extracted from a CCTV camera installed at a rural signalized intersection in Jackson Hole, Wyoming, known as Town Square intersection. Two trained observers meticulously reviewed the video data to identify traffic conflict events and violations. To ensure the consistency and accuracy of the extracted data, two researchers thoroughly examined the observations. Center Track algorithm was utilized to track the road users in the selected video sequences. Video footages were selected to cover both weekdays and weekends. The details of the video footages are provided below, (Table 1).

The identification of traffic conflicts adhered to the prescribed methodology outlined in ‘Traffic Conflict Techniques for Safety and Operations” by the Federal Highway Administration (13). Each conflict was diligently mapped and collected, accompanied by careful notation of additional relevant details (road users’ movements, identification of fault, prevailing weather conditions, surface conditions, etc.). Subsequently, a cumulative list of the observed traffic conflicts was prepared accompanied with the associated Time-to-Collision, (Table 2). Accordingly, a subset of the prepared conflict list was subjected to the analysis to calculate a comprehensive values of traffic conflict indicators. A total of 3865 frames were selected for the video analytics process including different camera resolutions and covering all the extracted types of traffic conflicts.

CenterTrack Algorithm
The algorithm “CenterTrack” has gained prominence in research. It was introduced in the original research paper “Objects as Points” by Zhou et al. [37]. The algorithm represents objects as single points and predicts their bounding boxes and classes. It capitalizes on the observation that most object bounding boxes have similar aspect ratios, using a single point to represent the object’s center and size. Compared to existing state-of-the-art object detection methods like Faster R-CNN and RetinaNet, CenterTrack achieves higher accuracy and faster processing. The official GitHub repository provides the algorithm’s source code and comprehensive descriptions of its components. Additionally, they provide a new training strategy that simplifies the annotation process by using point-level annotations instead of traditional bounding boxes. CenterTrack provides an end-to-end solution for monocular 3D object detection and tracking by leveraging the complementary nature of 2D object detection and 3D object localization. By formulating 3D object detection as a key point estimation problem, CenterTrack achieves more efficient and effective localization and orientation estimation of 3D objects, particularly in challenging occlusion scenarios and complex scenes. Experiments were conducted on the Karlsruhe Institute of Technology and Toyota Technological Institute (KITTI) and nuScenes datasets to demonstrate that CenterTrack achieves state-of-the-art performance in both 3D object detection and tracking, surpassing previous methods that rely solely on 2D or 3D information. Moreover, the proposed method exhibits computational efficiency, with a processing speed of over 25 frames per second, making it suitable for real-time applications.
CenterTrack detection and tracking algorithm was utilized in running the analysis of the extracted set of video footages for the case of study intersection. For the initial trials, a 20 sec. video was analyzed to estimate the time frame. The computational power of the utilized device (Intel(R) Xeon(R) CPU E3-1240 v3 @ 3.40 GHz, 16.0 GB installed RAM, 1 GB NVIDIA Quadro K620). In carrying out the video analytics process, the analysis required 650 seconds when utilizing the CPU, and significantly less—only 205 seconds—when leveraging the GPU. Based on this conclusion, it was required to either improve the computational power of the utilized PC or employing an external GPU for performing the analysis. Hence, Google external GPU was used through Google Collaboratory environment to upload and run the video analysis. It should be mentioned that Google Collaboratory is a cloud-based development environment for machine learning education and research. It allows users to write and execute codes in a web browser without requiring any internal installation. For the 20 Sec. video, the elapsed time of the analysis performed on Google Collaboratory was 41 Sec. Consequently, Google Collaboratory environment was selected in running the analysis. The video analytics for a single frame utilizing CenterTrack algorithm is illustrated in (Figure 2).

To assess the detection accuracy of CenterTrack, another state-of-the-art algorithm, YOLOv7 was chosen to verify the extracted results.
YOLOv7
YOLOv7 algorithm was published and trained on COCO dataset with 80 object categories [38]. The learning rate was initially set to 0.01 and decreased by a factor of 10 at 150 and 200 epochs. The total training time was around 36 hours on 8 NVIDIA V100 GPUs. Additionally, YOLOv7 has a total of 7 convolutional layers in its backbone network. It has been evaluated on several benchmark datasets, including COCO, Waymo Open, and Udacity Autonomous Driving. The real-time performance of YOLOv7 was evaluated and showed that it can achieve real-time speeds of up to 60 frames per second on a single GPU. (Figure 3) describes the supesriority of YOLOv7 over other YOLO versions in terms of efficiency and time. (Figure 4) shows a sample frame of video analysis for Jackson Hole Town Square using YOLOv7 detect and track algorithm.


Data Analysis and Detection Assessment
Parameter Tuning
In order to achieve the best performance from CenterTrack, the parameters and tuning options were updated by carefully observing the output detection progress. After several trials, the best set of parameters was found to be as follows: Tracking confidence threshold = 0.01, Test focal length (in pixels) = 1250, Depth scale factor = 1.0, Tracking weight = 1.0. It is worth mentioning that the pre-computing for heat maps, and the debug mode were enabled for faster inference of heat maps and providing additional debug information during execution.
Output Data Description
The video analytics process yielded three outputs: a video file, a JSON file, and a TXT file. The video output visually represents the occupying cuboids of each road user, providing a frame-by-frame tracking of their movements. While the JSON and TXT files provide the detected objects’ labels, their features, and the cuboids eight coordinates in the image plane. A code was developed to concatenate the outputs. Subsequently, the redundant coordinates related to over-detected objects were removed. (Figure 5) showcases the visual validation of the video output obtained using the CenterTrack algorithm. The red quadrilateral shapes depicted in the figure were generated using the extracted coordinates from the TXT file. A visual revision was conducted to verify the alignment of these shapes with the actual road users and their positions within the image plane at a specific chosen frame for the conflict set.

Detection Accuracy Assessment

At this phase, it was required to assess the detection accuracy of CenterTrack. Consequently, a selected video set of 1,000 frames was analyzed using CenterTrack and YOLOv7 algorithms. The selected scenes included traffic congestions, and hazardous weather and surface conditions at day and night times. A comparison was held between the two algorithms and the performance indices are calculated, (Table 3).

The assessment process yielded to find that the CenterTrack achieved 95.08%, and 92.81% in overall precision, and recall, respectively. A primary limitation of CenterTrack lies in its inability to detect road users until their full form is visible within the video frame. This challenge, however, is not shared by YOLOv7, which proves to be a more versatile tool in such instances.
Post-Processing Phase
The extraction of clean trajectories and accurate orientation is a crucial aspect of vehicles’ data processing. These steps play a pivotal role in generating precise speed and acceleration and reliably capturing the vehicle’s movement. After the tracking process, several unresolved issues persist: (a) The tracking process relies on the raw camera video, and as a result, the tracked data utilizes the camera’s coordinate system, which may not conform to a standardized coordinate system. Consequently, it becomes challenging to determine the precise position, speed, acceleration, and other states of the vehicles accurately, and (b) The tracked data often contains errors, such as frames contains miss-tracking, wrong-tracking, and outliers. Hence, utilization of raw camera coordinates and the presence of tracking errors necessitate careful post-processing techniques to address these challenges and obtain precise information regarding a vehicle’s position, speed, acceleration, and other relevant states.
Camera View Projection and Homography Calculation
Given that the original camera’s viewpoint, located on a first-floor rooftop, is unaccepted for research use, it becomes necessary to establish a common coordinate system. To achieve this, the image of the same intersection area obtained from Google Earth is cited. In projective geometry a homography transformation is a bijection that maps lines to lines [39], therefore by utilizing the Google Earth image as a reference, a consistent coordinate system can be established by matching the same feature points from two images. It is able to calculate the homography between the raw and projected road.
To address the challenge of locating feature points obscured by vehicles and pedestrians in the raw camera video, a background image of the roadway is generated. This is accomplished by calculating the median value of each pixel over a 5-minute video duration. The resulting background image offers the advantage of capturing all roadway features without occlusion from vehicles. In (Figure 6), the left portion illustrates the reconstructed background road surface, devoid of any vehicles or pedestrians. Next, the two sides of pedestrian crossing lane lines are identified and marked as feature points. To mitigate potential errors arising from road quality issues, only the feature points that are clearly visible are selected.
By comparing the red feature points in the raw road image with green points on Google Earth reference image, matching pairs are identified. This process reveals the homography between the two images, representing the transformation needed to align them accurately. This homography estimation facilitates subsequent analysis and processing of the tracked data, enabling more general and precise measurements.
Trajectories Projection on new reference road surface
The post-processing starts with the raw trajectories’ projection from original CenterTrack algorithm. The initial output solely provides the coordinates of each tracked vehicle in the raw camera view. However, by employing the previously obtained homography, it becomes feasible to project the trajectories onto a new reference road surface sourced from Google Earth. The resulting projected trajectories offer a comparative view between the raw camera view and the data projected onto the new reference road surface.
(Figure 7) demonstrates the comparison between the projected raw camera view and the projected data on the new reference background road surface. Evidently, the two representations exhibit a high degree of alignment, indicating the correctness of the projection process. This alignment serves as strong evidence validating the accuracy of the trajectory projection and reinforces the reliability of the data obtained for further analysis and interpretation.

Trajectories Reconstruction
However, the presence of poor video quality and crowded traffic conditions results in several tracking errors. These errors include: (a) multiple instances of tracking occurred leads to the duplicated detection, (b) instances where vehicles are not tracked in certain frames, leading to missed tracking results, (c) incorrect vehicle ID causing the division of a single trajectory into multiple segments, and (d) untracked vehicles when they are obscured by other objects, resulting in gaps in the trajectories. To address these issues, the first step in the data post-processing involves associating the vehicle positions among the tracked points. This is achieved by implementing a simple automated process that matches each tracked position to form a single trajectory [41].
This process defines error between current frame data and subsequent frame data to be minimized via Equation 2. This equation ensures that the error between the position of a vehicle in the current frame and its position in subsequent frames is minimized. Since the tracking in 2D map comprises both the X and Y directions in Google Earth image plane, it is essential to satisfy this condition for both dimensions. By employing this equation, the correct tracked points can be accurately associated for current frame to next frame within the dataset, irrespective of any incorrect or duplicate tracking.

In cases where there is a miss tracking in the subsequent frame, minimizing the error alone might still result in an association with the wrong position. To address this, a second condition is introduced. Equation 3 states that the minimized error should be smaller than a predetermined threshold. This additional equation ensures that no outliers are introduced during the data processing. Any removed positions are treated as gaps in the trajectory, indicating instances where reliable tracking information is not available. By eliminating these outlier positions, the data processing can focus on more accurate and reliable trajectory information.

Trajectories Smoothing
Upon completion of the aforementioned steps, the raw trajectories containing errors are constructed. To further refine the trajectories, a robust locally weighted regression and smoothing procedure is applied in this research. This robust regression procedure guards against deviant points distorting the smoothed points [42]. The weight is defined by the bi-square function, Equation 4.

Where r_i is the residual of the ith data point produced by the regression smoothing procedure. The MAD is the median absolute deviation of the residuals, Equation 5.


Following the smoothing processing, a Savitzky-Golay filter is recommended for eliminating any residual errors. The efficacy of this approach can be observed in (Figure 8), which presents a comparison of trajectories before and after the smoothing process. As depicted in the figure, the majority of errors addressed in the preceding section are successfully eradicated from the vehicle trajectories. Consequently, the trajectories are now highly suitable for accurate speed and acceleration estimation, (Figure 9).
Speed, Acceleration, and Orientation Estimation
The process of calculating speed and acceleration from noisy trajectory is conducted based on the proposed methodology in [43]. This paper introduced a non-causal, non-linear low pass filter to calculate instantaneous vehicle speed and acceleration. To determine the time-series speed for each raw trajectory, the median difference over multiple time-steps is calculated. This is done by individually calculating the time series speed for each trajectory using a range of time steps, as described in Equation 6, where i denotes the current frame, n is the time-step, and () x i n+ is the vehicle’s position in frame i n + . Thus, ( ) n v i is the estimated average speed of the vehicle over 2∙n frames bounding the current frame. This process will replicate multiples times with different integer n from 1 to m. Then the speed of the vehicle is determined by taking the median of all these calculated speeds. Finally, a Gaussian smoother is applied to the median speed to further reduce any remaining noise and ensure a smoother representation of the vehicle’s speed profile, Figure 10(a).


Once the clean speeds have been obtained, the acceleration can be calculated using a simpler approach compared to the method used to calculate the speeds, Equation 7. The acceleration values can be derived directly from the clean speeds. To further refine the acceleration profile, a smoother can be applied to the calculated acceleration values, resulting in a final refined representation of the vehicle’s acceleration, Figure 10(b).

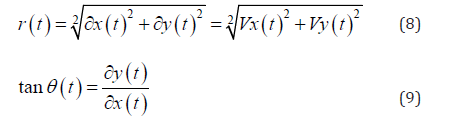
Speeds and accelerations are calculated separately into longitudinal and lateral directions. It was chosen to define vehicles orientations by using the polar coordinates system (r,θ). The following equations represent the magnitude of the traveled distance (r) by a specific object between two successive frames in unit time (t), and its inclination angle (θ) with y-axis, Equation 8, and Equation 9.
Traffic Conflicts Detection
After the trajectories were extracted and smoothened, four traffic conflict indicators are calculated to detect various traffic conflict types. Three time-based and one acceleration-based SMoS were utilized in assessing the extracted set of video footage. TTC, Modified Time-to-Collision (MTTC), and PET are the time-based indicators. Whereas Deceleration Rate to Avoid a Crash (DRAC) is the acceleration-based measure. The following formulas illustrate the calculation of the utilized indicators, Equations (10-13).

Where ,xLtand ,xFtare the positions of leading and following road users at time t, DLis the length of the leading road user, ,vL,tand ,vF,tare the speeds of leading and following road users, respectively. ΔvtΔ, and Δat are the difference in speeds and accelerations between the two colliding road users, correspondingly. tL,tand tF,tare the departure time of the offending vehicle, and the arrival time of the conflicting vehicle.
TTC denotes the duration it takes for the non-leading vehicle to reach the conflict area [7]. MTTC was developed by [43] to release the speed constraint that assumed by TTC since the calculation method of TTC proposed that the two colliding road users had constant speed at collision time. Conversely, PET represents the temporal disparity between two vehicles approaching the projected conflict zone at a specific moment [44]. In addition, DRAC is calculated using extrapolated measurements of speed and distance to determine the proximity to the conflict point [45]. As illustrated, usually DRAC is used as a guiding kinematic measurement that could assess the severity of traffic conflicts when the crossing movements are not completing by employing hard brakes.
The analysis of the proposed conflicts was conducted. It should be mentioned that one of the analyzed conflicts was excluded since the video footage included an ice removal three-wheeled truck which could not be identified by the algorithm. The traffic conflicts indicators were calculated for the road users located in the video scenes by developing a code to calculate, smooth, and draw the output curves. The extreme value method was applied to detect the sudden changes in the indicators curves which refer to the traffic conflict occurrence [46-48].
(Figure 11) shows the extracted trajectories from both camera and top-down views as an example for the video analytics process of a side swipe conflict. While (Figure 12) depicts the code outputs for the same conflict. It is noted that the PET values were calculated for specific cases such that the predicted collision points were predetermined. However, for the detected conflicts the road users took either action by maneuvering and one of them did not cross the estimated point of collision or applying a relatively high deceleration rate and passed the collision point with unnoticeable PET.
Conclusions and Discussions
In conclusion, this research paper successfully utilized the CenterTrack algorithm to analyze traffic conflicts at intersections, presenting valuable insights and contributions to the field. Through the application of CenterTrack for road user detection and a subsequent comparison with YOLOv7, an overall precision rate of 95.08% was achieved, highlighting the algorithm’s effectiveness in accurately identifying road users. Furthermore, the establishment of a transformation homography allowed for the visualization of detected objects from a plan view. This visualization technique provided a comprehensive understanding of the spatial distribution of road users at the intersection, enabling a more insightful analysis of potential conflicts and their occurrence patterns.


The smoothening algorithm introduced in this study played a vital role in improving the precision and dependability of the identified trajectories, speeds, and accelerations. Through noise reduction and elimination of irregularities in the data, this algorithm allowed for a more precise depiction of road user behavior, resulting in more accurate analysis and prediction of traffic conflicts. In order to gain deeper insights into traffic conflicts, this research paper introduced the computation of four indicators for measuring such conflicts. By employing the principles of extreme value theory, the occurrence of traffic conflicts was successfully detected, providing valuable data for evaluating intersection safety and identifying potential areas of concern.
In summary, this study highlights the importance of the CenterTrack algorithm for analyzing traffic conflicts at intersections. By combining the transformation homography, smoothening algorithm, and extreme value theory, our understanding of traffic patterns and intersection safety is broadened. The results of this research hold practical implications for enhancing traffic management strategies, improving intersection design, and promoting road safety as a whole. However, two main limitations of CenterTrack were found: (a) the height constrain on the mounted camera since it was essentially designed for in-vehicle cameras, and (b) the algorithm is trained to detect a limited number of the categories by utilizing KITTI dataset. Future research can leverage these findings and address the limitations to improve the field and create more advanced methods for analyzing and preventing traffic conflicts.
Acknowledgment
This work was sponsored by the Wyoming Department of Transportation (WYDOT). Grant Number: RS04221. The writings were enhanced by using ChatGPT which helped in checking for grammatical errors and paraphrasing sentences in a more concise manner.
References
- Federal Highway Administration, US Department of Transportation (2022) Traffic Safety Facts.
- Kim DG, Washington S, Oh J (2006) Modeling Crash Types: New Insights into the Effects of Covariates on Crashes at Rural Intersections. Transport Engineer 132(4).
- Mohanty M, Panda R, Gandupalli SR, Arya RR, Lenka SK (2022) Factors Propelling Fatalities during Road Crashes: A Detailed Investigation and Modelling of Historical Crash Data with Field Studies. Heliyon 8(11): e11531.
- Diaz-Corro KJ, Moreno LC, Mitra S, Hernandez S (2021) Assessment of Crash Occurrence Using Historical Crash Data and a Random Effect Negative Binomial Model: A Case Study for a Rural State. Transport Res Record 2675(12).
- Wu H, Gao L, Zhang Z (2014) Analysis of Crash Data Using Quantile Regression for Counts. Journal of Transportation Engineer 140: 4.
- Sayed T, Brown G, Navin F (1994) Simulation of traffic conflicts at unsignalized intersections with TSC-Sim. Accident Analysis & Prevention 26(5): 593-607.
- Sayed T, Zein S (1999) Traffic Conflict Standards for Intersections. Transport lanning Technol 22(4): 309-323.
- Perkins Stuart R, Joseph I Harris (1967) Criteria for traffic conflict characteristics, signalized intersections. Research Laboratories, General Motors Corporation.
- Workshop on Traffic Conflicts (1977) Proceedings: First Workshop on Traffic Conflicts Oslo 77. Oslo: Norwegian Council for Scientific and Industrial Research.
- Johnsson C, Laureshyn A, Ceunynck T De (2018) In Search of Surrogate Safety Indicators for Vulnerable Road Users: A Review of Surrogate Safety Indicators. Transport Rev 38(6): 765-785.
- Anarkooli AJ, Persaud B, Milligan C, Penner J, Saleem T (2021) Incorporating Speed in a Traffic Conflict Severity Index to Estimate Left Turn Opposed Crashes at Signalized Intersections. Transport Res Record 2675(5): 214-225.
- Muhlrad N (1993) Traffic conflict techniques and other forms of behavioral analysis: Application to safety diagnoses. 6th ICTCT workshop.
- Parker MR, Zegeer CV (1989) Traffic conflict techniques for safety and operations: Observers manual. No. FHWA-IP-88-027, NCP 3A9C0093. United States. Federal Highway Administration.
- Salman NK, Al-Maita KJ (1995) Transportation Research Record No. 1485, pp. 177-185. Human Performance and Safety in Highway, Traffic, and ITS Systems.
- Kraay JH, Horst ARA, Van Der, Oppe S (2013) Manual conflict observation technique DOCTOR (Dutch Objective Conflict Technique for Operation and Research).
- Glauz WD, Bauer KM, Migletz DJ (1985) Expected traffic conflict rates and their use in predicting accidents. Transport Res Record 1026: 1-12.
- Ismail K, Sayed T, Saunier N, Lim C (2009) Automated Analysis of Pedestrian-Vehicle Conflicts Using Video Data. Transport Res Record 2140: 44-54.
- Ismail KA (2010) Application of computer vision techniques for automated road safety analysis and traffic data collection (Doctoral dissertation, University of British Columbia).
- Hou J, List GF, Guo X (2014) New Algorithms for Computing the Time-to-Collision in Freeway Traffic Simulation Models. Comput Intelligence Neurosci.
- Essa M, Sayed T (2015) Simulated Traffic Conflicts: Do They Accurately Represent Field-Measured Conflicts? Transportation Res Record 2514: 48-57.
- Dahlkamp H, Pece AEC, Ottlik A, Nagel HH (2004) Differential Analysis of Two Model-Based Vehicle Tracking Approaches. In: Rasmussen CE, Bülthoff HH, Schölkopf B, Giese MA (eds) Pattern Recognition. DAGM 2004. Lecture Notes in Computer Science, 3175. Springer, Berlin, Heidelberg p. 71-78.
- Stauffer C, Grimson WEL (2000) Learning Patterns of Activity Using Real-Time Tracking. IEEE Transactions on Pattern Analysis Machine Intelligence 22(8): 747-757.
- Veeraraghavan H, Masoud O, Papanikolopoulos NP (2003) Computer Vision Algorithms for Intersection Monitoring. IEEE Transact Intelligent Transport Syst 4(2): 78-89.
- Magee DR (2004) Tracking multiple vehicles using foreground, background and motion models. Image Vision Comput 22(2): 143-155.
- Maurin B, Masoud O, Papanikolopoulos NP (2005) Tracking All Traffic: Computer Vision Algorithms for Monitoring Vehicles Individuals, and Crowds. IEEE Robotics and Automat Magazine 12(1): 29-36.
- Koler D, Weber J, Malik J (1994) Robust Multiple Car Tracking with Occlusion Reasoning. European Conference on Computer Vision.
- Cavallaro A, Steiger O, Ebrahimi T (2005) Tracking Video Objects in Cluttered Background. IEEE Transactions on Circuits and Systems for Video Technol 15(4): 575-584.
- Saunier N, Sayed T (2006) A Feature-Based Tracking Algorithm for Vehicles in Intersections 2006: 59.
- Beymer D, Mclauchlan P, Coifman B, Malik J (1989) A Real-Time Computer Vision System for Measuring Traffic Parameters.
- Gazis DC, Edie LC (1968) Traffic Flow Theory. Proceedings of the IEEE 56(4): 458-471.
- Stauffer C, Grimson WEL (1999) Adaptive Background Mixture Models for Real-Time Tracking. Proceedings of the IEEE Computer Society Conference on Computer Vision Pattern Recogn 2: 246-252.
- Zheng O, Abdel-Aty M, Yue L, Abdelraouf A, Wang Z, et al. (2022) CitySim: A Drone-Based Vehicle Trajectory Dataset for Safety Oriented Research and Digital Twins Figure 1. Post Encroachment Time Conflicts in a Single Frame from the CitySim Dataset Expressway A Weaving Segment Location.
- Wu Y, Abdel-Aty M, Zheng O, Cai Q, Zhang S (2020) Automated Safety Diagnosis Based on Unmanned Aerial Vehicle Video and Deep Learning Algorithm. Transport Res Record 2674(8): 350-359.
- Abdel-Aty M, Wu Y, Zheng O, Yuan J (2022) Using Closed-Circuit Television Cameras to Analyze Traffic Safety at Intersections Based on Vehicle Key Points Detection. Accid Anal Prev 176: 106794.
- Cai Q, Abdel-Aty M, Lee J, Wang L, Wang X (2018) Developing a Grouped Random Parameters Multivariate Spatial Model to Explore Zonal Effects for Segment and Intersection Crash Modeling. Analytic Methods Accident Res 19: 1-15.
- Anisha AM, Abdel-Aty M, Abdelraouf A, Islam Z, Zheng O (2022) Automated Vehicle to Vehicle Conflict Analysis at Signalized Intersections by Camera and LiDAR Sensor Fusion. Transportation Research Record: J Transportation Res Board p. 036119812211288.
- Zhou X, Wang D, Krähenbühl P (2019) Objects as points. Computer Vision and Pattern Recognition.
- Wang CY, Bochkovskiy A, Liao HYM (2022) YOLOv7: Trainable Bag-of-Freebies Sets New State-of-the-Art for Real-Time Object Detectors.
- Baer R (2005) Linear algebra and projective geometry. Courier Corporation.
- Coifman B, Li L, Xiao W (2018) Resurrecting the Lost Vehicle Trajectories of Treiterer and Myers with New Insights into a Controversial Hysteresis. Transportation Res Record 2672(20): 25-38.
- Coifman B, Li L (2017) A Critical Evaluation of the Next Generation Simulation (NGSIM) Vehicle Trajectory Dataset. Transport Res Part B: Methodol 105: 362-377.
- Cleveland WS (1979) Robust Locally Weighted Regression and Smoothing Scatterplots. J Am Statistical Assoc 74(368).
- Ozbay K, Yang H, Bartin B, Mudigonda S (2008) Derivation and Validation of New Simulation-Based Surrogate Safety Measure. Transport Res Record 2083: 105-113.
- Cooper PJ (1984) Experience with traffic conflicts in Canada with emphasis on “post encroachment time” techniques. In International calibration study of traffic conflict techniques. Berlin, Heidelberg: Springer Berlin Heidelberg p. 75-96.
- Gettman D, Head L (2003) Surrogate safety measures from traffic simulation models. Transportation Research Record 1840(1): 104-115.
- Wang C, Xu C, Dai Y (2019) A Crash Prediction Method Based on Bivariate Extreme Value Theory and Video-Based Vehicle Trajectory Data. Accident Analysis Prevent 123: 365-373.
- Borsos A, Farah H, Laureshyn A, Hagenzieker M (2020) Are Collision and Crossing Course Surrogate Safety Indicators Transferable? A Probability Based Approach Using Extreme Value Theory. Accident Analys Prevent 143: 105517.
- Zheng L, Sayed T (2020) A Bivariate Bayesian Hierarchical Extreme Value Model for Traffic Conflict-Based Crash Estimation. Analytic Method Accident Res 25: 100111.


