


Exploring the Correlation Between Asphalt Pavement Friction and Texture Properties: An Application of Ensemble Empirical Mode Decomposition (EEMD)
Ahmed El-Ashwah S1* and Magdy Abdelrahman2
1Department of Civil, Architectural, and Environmental Engineering, Missouri University of Science and Technology, Rolla, USA
2Missouri Asphalt Pavement Association (MAPA) Endowed Professor, Department of Civil, Architectural, and Environmental Engineering, Missouri University of Science and Technology, Rolla, USA
Submission: May 05, 2024; Published: May 15, 2024
*Corresponding Author: Ahmed El-Ashwah S, Department of Civil, Architectural, and Environmental Engineering, Missouri University of Science and Technology, Rolla, USA
How to cite this article: Ahmed El-Ashwah S* and Magdy Abdelrahman. Exploring the Correlation Between Asphalt Pavement Friction and Texture Properties: An Application of Ensemble Empirical Mode Decomposition (EEMD). Civil Eng Res J. 2024; 14(5): : 555899. DOI 10.19080/CERJ.2024.14.555899
Abstract
The performance of asphalt pavement friction is primarily determined by its surface characteristics, mainly its micro texture and macrotexture properties. Therefore, understanding the relationship between surface texture and pavement skid resistance is crucial from a safety perspective. The aim of this research is to examine the relationship between the friction properties of asphalt pavement and its corresponding surface texture by applying the ensemble empirical mode decomposition (EEMD) method. The EEMD algorithm was utilized to optimize and extract the ensemble intrinsic mode function (eIMFs), which were subsequently combined to produce ensemble base intrinsic mode functions (eBIMFs). In addition, seven texture indicators were computed to characterize the original texture, eIMFs, and eBIMFs profiles. A correlation analysis revealed that eIMF3 exhibited the highest correlation with the original profile, achieving a correlation coefficient up to 0.69, followed by eIMF2 and eIMF4. The friction-texture correlation, initially weak for the original profile, showed significant improvement with the application of the EEMD method, particularly with eIMF6. A multilinear regression model was developed based on the texture characteristics of eIMF6, achieving an overall coefficient of determination (R2) of 0.878. Finally, a sensitivity analysis revealed that the importance of texture parameters, in descending order, was root-mean-square slope (Δq), root-mean-square deviation (Rq), root-mean-square wavelength of the profile (λq), mean difference of elevation (MDE), and kurtosis (Rku).
Keywords: Friction Properties; Surface Texture; Ensemble Empirical Mode Decomposition; Hilbert-Huang Transformation; Texture Indicators
Abbreviations: EEMD: Ensemble Empirical Mode Decomposition; eIMFs: Ensemble Intrinsic Mode Functions; eBIMFs: Ensemble Base Intrinsic Mode Functions; MDE: Mean Difference of Elevation; WT: Wavelet Transform; HHT: Hilbert-Huang Transform; IMFs: Intrinsic Mode Functions; MA: Mean Amplitude; MF: Mean Frequency; DFT: Dynamic Friction Tester; TR: Traprock; LS: Limestone; SMA: Stone Matrix Asphalt; DG: Dense-Graded; JMF: Job Mix Formula; MoDOT: Missouri Department of Transportation; CT: Circular Track; HHT: Hilbert-Huang Transform; HSA: Hilbert Spectral Analysis; MTD: Mean Texture Depth; MLR: Multilinear Regression
Introduction
Research has consistently shown a strong link between the skid resistance of pavement surfaces and overall road safety. Among the various attributes of pavement surfaces, skid resistance is the most essential. Tire-surface friction is influenced by multiple factors, including surface characteristics (texture, material composition properties), properties of vehicular tires (tread pattern and depth, rubber composition, and tire size and dimensions), the operational conditions, including (wheel speed, load, slip ratio, and pneumatic pressure), and finally the presence of environmental contaminants (water, snow, ice, and dust) [1,2]. The texture of the pavement surface plays a vital role in influencing this friction. Therefore, gaining a deep understanding of how pavement texture impacts skid resistance is essential.
The pavement texture is categorized into four main groups based on texture wavelength (λ): micro-texture (λ < 0.5mm), macrotexture (0.5mm ≤ λ < 50mm), mega-texture (50mm ≤ λ < 500mm), and unevenness (500mm ≤ λ) [2]. The skid resistance of pavement is significantly influenced by the summation of its macro-texture and micro-texture. These textures, which exhibit random and non-stationary properties akin to natural signals, have led to the adoption of several signal processing methods in highway engineering to explore the friction-texture relationship of pavement surfaces. The Fourier and wavelet transforms are the primary analysis techniques utilized for this analysis. The FT is ideal for analyzing stationary signals with consistent frequencies over time, which is not the case with road textures. In contrast, one drawback of the Wavelet Transform (WT) analysis is its reliance on selecting the appropriate wavelet basis function since no single wavelet basis is applicable to all situations [3]. Thus, it is essential to investigate other signal processing techniques that are capable of effectively managing non-stationary signals and are flexible across different scenarios.
To overcome these limitations, the Hilbert-Huang Transform (HHT), an empirically derived method capable of analyzing nonlinear and non-stationary data, has recently been employed to optimize and evaluate the texture profiles of pavement surfaces. Gagarin et al. [4] investigated the potential of using the HHT to analyze pavement surface texture, demonstrating that the pavement’s physical characteristics can be discerned and interpreted through the combination of intrinsic mode functions (IMFs) derived from HHT. A comparative study was conducted by Ayenu-Prah et al. [5] to evaluate the accuracy of the HHT, FT, and WT methods in analyzing pavement profiles, noting HHT’s superior adaptability in detailed profile analysis of pavement [5].
Cho [6] applied the Empirical Mode Decomposition (EMD) to extract the IMFs and then combined them into four Base Intrinsic Mode Functions (BIMFs): BIMF1 was the sum of the first four IMFs, BIMF2 was the sum of the following four IMFs, BIMF3 was the sum of the following four IMFs, and BIMF4 was the sum of the remaining IMFs. Subsequentially, a mean amplitude (MA) and mean frequency (MF) were computed for each BIMF and correlated with the dynamic friction tester (DFT) values. Building on Cho’s study, Rado & Kane [7] reported that the MA and MF indicators of the first two BIMFs (BIMF1 and BIMF2) were statistically significant and adequate for monitoring changes in measured DFT values, although the practical significance of the MF and MA indicators remains limited. Following the Cho study, Kane et al. [8] introduced two new texture indicators, density and sharpness, to characterize the obtained BIMFs. They observed that the friction-texture correlation at various speeds improved when considering density, sharpness, and the combination of density and sharpness. In addition, Yu et al. [9] found that the texture parameters of BIMF2, which is the sum of three IMFs (IMF3, IMF4, and IMF5), exhibited a strong correlation with the friction numbers compared to the main texture profile.
Current foundation engineering practices in permafrost regions aim to maintain soil in a frozen state by preventing heat transfer from buildings and structures through insulation, coatings, thermosiphons, air convection methods, and sun sheds. Various preservation and mitigation techniques have been used to minimize heat transfer from superstructures to frozen ground in permafrost regions and, hence, maintain the Adfreeze bonds and prevent foundation strains such as settlements or heaving. One approach involved the use of open crawlspaces, allowing cold winter airflow beneath buildings to mitigate heat transfer to permafrost (Vyalov et al., 1993b). Thermosiphons were also used as passive soil refrigeration systems to preserve permafrost in continuous and discontinuous permafrost zones through heat exchangers between soil and the atmosphere [7-9]. Other technics such as Cold Air Refrigerant Systems (CARS) were also employed to circulate cold air within pile foundations during winter to facilitate refreezing [10]. Although these techniques are efficient in minimizing the heat transfer from the superstructure to frozen ground, however, they cannot prevent thawing of Adfreeze bonds due to higher ambient temperatures related to global warming. This behavior poses a significant challenge for pile foundations, especially in warming permafrost areas. Thus, novel retrofitting techniques are needed to maintain Adfreeze bonding around piles.
Chen et al. [11] proposed the use of freezing liquid in concrete piles (Fast Freezing System, FFS) during casting to locally lower pile temperatures, reduce concrete refreezing time, and enhance freezing force in permafrost regions. FFS was found effective in accelerating the refreezing process and improving freezing force in cast-in-place piles. The study observed that FFS induced a significant cooling effect, enabling the interface temperature of pile foundations to drop below natural ground temperature within a few days. Amanzadeh and Rayhani [12] developed an experimental setup to explore the possibility of local pile-soil interface freezing using a freezing liquid circulated into steel pipe piles. The experimental results showed that local freezing is capable of decreasing temperature in the pile surrounding soil and development of Adfreeze bond at the pile-soil interface. Considering the limitations of experimental model tests, this study aims at developing a numerical model based on the model test results obtained from experimental tests to further investigate this phenomenon.
This paper introduces the numerical model developed to simulate a steel pipe pile embedded in unfrozen sand and examine the potential for Adfreeze bond formation facilitated by circulation of freezing liquid in the pile. The finite element numerical models were developed employing ABAQUS software and calibrated based on the results obtained from experimental model tests. These models were then used to investigate other parameters controlling the response of the pile-soil system to local freezing. These parameters include pile geometry (diameter), ground temperature, exposure freezing liquid temperature and other pile and soil characteristics. This paper presents the development details of these numerical models as well as parameter analysis in this study.
Research Significance
Noteworthy, research studies in the literature have focused on applying the EMD to optimize and extract the IMFs, although the EMD has some drawbacks, particularly mode mixing. Mode mixing occurs when the decomposition technique fails to group signals of similar frequencies into individual IMFs. Consequently, various oscillation modes are mixed within a single IMF, causing them to lose their physical significance or inaccurately reflect the underlying physical processes [10,11]. To address this issue, the ensemble empirical mode decomposition (EEMD) was proposed, which improves the analysis by making the data more regular and less susceptible to mode mixing by incorporating noise assistance [11,12]. However, EEMD comes with the cost of increased computational complexity and the requirement for multiple iterations due to the ensemble process [11]. Overall, although EEMD provides improvements over EMD, the selection between these two methods would be based on the specific requirements and constraints of the application, such as signal purity, sensitivity to added noise, complexity level, and computational cost.
The main goal of this study is to explore the effectiveness of the EEMD method in modeling to better understand the correlation between pavement surface texture and friction properties, as indicated by the DFT values at 20km/hr (DFT20). The EEMD was used to extract the ensemble IMFs (eIMFs), which were then combined to produce ensemble BIMFs (eBIMFs). A comparative analysis of these developed eIMFs and the proposed eBIMFs against the original profile was conducted to identify which demonstrates the strongest correlation with pavement friction. Finally, by analyzing six texture indicators along with the mean profile depth (MPD) of the eIMF and eBIMF through the HHT, the texture parameter that exhibited the strongest correlation with surface friction was identified.
Research Methodology
This research study adopted the EEMD to analyze the surface texture profile of asphalt mixture slabs and investigate the frictiontexture relationship. The EEMD decomposes the measured profile into a set of eIMFs and often a residue, ordered from the highest to the lowest frequency component. Height-, spacing- and shaperelated texture indicators were computed for the original and each eIMF to determine which eIMF correlates best with the friction properties. Consequently, a circular track meter (CTMeter) was utilized to measure the macrotexture profile of the fabricated slabs, while the DFT was employed to monitor the friction properties of asphalt mixtures. Figure 1 illustrates the research methodology.
Materials
Seven asphalt mixtures were fabricated using different aggregate sources-traprock (TR) and limestone (LS)-and mix designs, including stone matrix asphalt (SMA) and densegraded (DG) mixtures. The details of these asphalt mixtures are presented in Table 1. Additionally, Figure 2 shows the typical job mix formula (JMF) of the investigated mixtures alongside the specification limits. Notably, the SMA mixtures were designed to meet the Missouri Department of Transportation (MoDOT) specifications, incorporating 0.3% cellulose fibers and 50% by volume of traprock [13,14].


Asphalt Mixture Slabs Preparation
Fourteen asphalt mixture slabs, each measuring 20 by 20 inches, were fabricated using a vibratory compactor following AASHTO PP104-21 [15]. To ensure homogeneity, aggregates from all sources were screened, and precise weights for each type and size were meticulously collected. These aggregates were then uniformly mixed with asphalt binder to create four equal batches. The subsequent process involved filling the mold, leveling the mixture, and compacting till the target density was achieved.
Testing Methods
Firstly, the fabricated asphalt mixture slabs were marked, using a white marker, to designate the DFT spot to ensure that the friction and texture measurements were taken consistently at the same point. Figure 3 illustrates the test setup for assessing friction and texture properties.

Circular Track Meter (CT-Meter)
The CT-Meter was used to measure the surface characteristics of pavements according to ASTM E2157 [16]. It features an arm that holds sensors, commonly laser-displacement sensors, which capture the macrotexture texture of the pavement surface. This arm rotates around a circular track with a radius of typically 5.6 in, allowing the sensor to record deviations in surface texture from a reference plane. Notably, the CT-Meter provides highresolution measurements with a vertical resolution as fine as 3μm, a horizontal resolution of around 50μm, and a sampling rate of 870μm.
Dynamic Friction Tester (DFT)
The DFT was used to measure the friction properties of pavement surfaces under wet conditions, as specified by ASTM E1911 [17]. It operates by rotating a circular disk equipped with three rubber pads against the pavement surface at specified speeds, up to 90 km/hr. As the disk contacts the surface, it measures the resistance caused by friction, thereby recording the torque. The friction coefficient is then calculated by dividing this computed torque force by the weight of the disk. Notably, the friction coefficient obtained at 20 km/hr (DFT20) is indicative of the surface’s micro texture properties [2,18].
Hilbert-Huang Transform (HHT)
The HHT is an adaptive method to analyze non-linear and non-stationary signals, composed of two main parts:
1) Empirical Mode Decomposition (EMD) or its variant, such as ensemble empirical mode decomposition (EEMD), which decomposes a signal into its ensemble intrinsic mode functions (eIMFs).
2) Hilbert Spectral Analysis (HSA) on these eIMFs. The HSA applies the Hilbert Transform to each eIMF to obtain instantaneous frequency data, creating a time-frequency-energy distribution known as the Hilbert spectrum.
Ensemble Empirical Model Decomposition (EEMD)
The EEMD is an enhancement of the EMD method, designed to overcome the issue of mode mixing that can occur due to signal intermittency or noise. The EEMD method adds white noise to the original signal multiple times, computes the EMD for each noisy version of the signal, and then averages the results [11,12], as illustrated in Figure 4. Notably, over sifting can reduce the amplitudes of eIMFs, making them less meaningful in a physical context. To avoid over sifting, the sum of the differences (SDk) is computed between two consecutive sifting results and is kept within 0.2 to 0.3 [19], as illustrated in Figure 4.

As the decomposition process produces eIMFs sorted from highest to lowest frequency, the merging principle requires combining components of similar frequencies. This approach ensures that the frequency characteristics of the merged Base eIMFs (eBIMFs) remain consistent throughout the analysis. Consequently, the developed eIMFs were combined to produce three combinations of eBIMFs, as presented in Table 2, to analyze the pavement friction-texture relationship. For each eBIMF combination, three eBIMFs were computed, designated as eBIMF1, eBIMF2, and eBIMF3. As the number of eIMFs is unpredictable, for all combinations, eBIMF3 consistently represents the cumulative sum of the remaining eIMFs that were not included in eBIMF1 and eBIMF2. Figure 5 presents an example of the decomposed eIMFs by the EEMD and two eBIMFs combinations.

Hilbert Spectral Analysis (HSA)
This study performed the HSA on the eBIMFs to compute both instantaneous amplitude and frequency. Subsequently, the means of the instantaneous amplitude and frequency, MA and MF, respectively, of the eBIMFs were computed and utilized to analyze the friction-texture relationship. Equation (1) defines the analytical signal used to compute the instantaneous frequency. This equation consists of two parts: the real component, x(t), and the imaginary component, xˆ(t) . The real part represents the original signal (eBIMFi(n)), while the imaginary part is the result of the Hilbert Transform (Equation (2)). Finally, the instantaneous amplitude and frequency were computed using Equations (3) and (4).
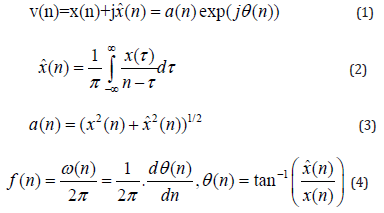
where θ(n) is the phase function of original signal (ν(n)).
Parameters Selection for Characterizing Surface Texture
It is recognized that the MPD is strongly associated with the mean texture depth (MTD) for portraying friction in asphalt pavements [20,21]. Both MTD and MPD serve as critical parameters for measuring pavement macrotexture. However, these parameters may not adequately represent the distribution of pavement texture characteristics when analyzing tirepavement friction. Consequently, to enhance the evaluation of asphalt pavement texture properties, six additional parameters along with the MPD were introduced. These texture parameters are categorized based on their characteristics: height-related parameters include MDE (Mean Difference of Elevation), Rsk (Skewness), Rku (Kurtosis), and Rq (Root-Mean-Square Deviation); spacing-related parameters include λq (Rootmean square wavelength of the profile); and shape-related indicators include Δq (Root-mean square slope), as detailed in Table 3. Furthermore, these parameters were computed for five combinations, the original profile, the first seven eIMFs, and three eBIMFs, to promote a comparative analysis with the original texture profiles.


Results, Analysis, and Discussion
Correlation Analysis of Original Vs. Decomposed Texture Profiles
A correlation analysis was conducted to compare the original profile with its decomposed counterparts, using the entire profile and the proposed texture parameters detailed in Table 3. Figure 6(a) illustrates the results of the correlation analysis between the original texture profiles and the developed eIMFs, with error bars representing the range of maximum and minimum values of the correlation coefficient across the investigated mixtures. A prominent peak in correlation occurred at eIMF3, followed by eIMF4 and eIMF2, indicating that these eIMFs correlate most robustly with the original texture profile. After this peak, a progressive decrease in the correlation coefficients was observed, extending from eIMF4 to eIMF9. Therefore, eBIMFs that incorporate eIMF3, eIMF4, and/or eIMF2 are likely to show the highest correlation with the original profile, as depicted in Figure 6(b). The variation in correlation levels across different eBIMF combinations indicates that the method of combining eIMFs into eBIMFs significantly impacts their correlation with the original texture profile.
Furthermore, a correlation analysis of the texture indicators showed that, among the eIMFs, the eIMF2 and eIMF3 demonstrated the strongest correlation with the parameters computed for the original profile, yielding convergent results. The eIMF3 exhibited the strongest correlation with the original profile in terms of the MPD, Rq, and Rsk, while the eIMF2 showed superior correlation with respect to the MDE, Rku, λq, and Δq, as illustrated in Figure 7. However, while the eBIMFs exhibited a higher correlation with the original texture profile, as shown in Figure 6(b), they exhibited a lower correlation coefficient than eIMFs regarding the texture parameters.
Correlation Analysis of the Friction and Texture Properties
A correlation analysis was also performed to evaluate the relationship between the friction properties, as indicated by DFT20 values, and the texture characteristics, as defined by the computed texture indicators, with the results presented in Figure 8. As illustrated in Figure 8(a), the correlation between the texture characteristics and the friction properties was initially weak; however, it improved with the application of EEMD. Furthermore, the correlation varied across the eIMFs and combinations of eBIMFs. Generally, the computed texture indicators, particularly Δq, Rq, and MDE, of the eIMF6 exhibited the strongest correlation with the DFT20, achieving a correlation coefficient (r) exceeding 0.65. Additionally, the Rq and Rsk parameters of the eBIMFs exhibited a good correlation with the DFT20 values, as illustrated in Figure 8(b). Therefore, the eIMF6 was adopted to examine the friction-texture relationship.


Impact of EEMD on the Friction-Texture Relationship
The friction-texture relationship was explored based on the texture characteristics of both the original and eIMF6 profiles, as shown in Figure 9. As depicted in Figure 9, the relationship based on the characteristics of the original profile was very weak for all proposed texture indicators. However, an improvement was observed with the application of EEMD. It was found that the Δq, Rq, and MDE parameters demonstrated relatively good correlations with the DFT20. In contrast, Rsk, Rku, and λq showed very weak correlation with the DFT20 values.
Multilinear Regression (MLR) Analysis
A backward stepwise multilinear regression (MLR) analysis was conducted to identify the most significant texture indicators affecting pavement friction, aiming to develop an accurate frictiontexture prediction model. Equation (5) expresses the general MLR model. Initially, a full model including all texture indicators of the eIMF6 was constructed. It systematically removed the least significant predictors, one at a time, those with a p-value greater than 0.05, until no further predictors could be removed without a significant loss of fit. The results of the MLR analysis are presented in Table 4. It was noted that λq, Rq, Δq, Rku, and MDE were statistically significant for predicting pavement friction (p-value < 0.01). In addition, MDE, Rq, and Rku positively influenced the friction values, while λq and Δq had a negative impact due to their respective positive and negative coefficients.
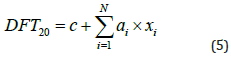
where DFT20 is the dynamic friction value at 20 km/hr, c is the error term, ai is the coefficient representing the respective independent variables’ effects on the dependent variable, and xi is the independent texture indicator.


The accuracy of the MLR model was assessed by analyzing the bias of the data points, which reflects their rotation or shift around the line of equality, and the precision, which measures the degree of scatter around the equality line [25,26]. Figure 10(a) displays the non-constrained regression lines comparing measured versus predicted DFT20 values, accompanied by goodness-of-fit statistics. A sensitivity analysis was also conducted to identify the most influential texture indicators in predicting pavement friction, as illustrated in Figure 10(b). The analysis was conducted using the range of computed data; the minimum, mean, and maximum values of the computed texture parameters were used. It was observed that the importance of the parameters ranked in descending order as follows: Δq, Rq, λq, MDE, and Rku.


Correlation Analysis Based on HSA Results
The friction-texture relationship was further explored using the MA and MF parameters obtained through the HSA. Therefore, HSA was performed on eBIMF combinations to obtain instantaneous amplitudes and frequencies, and the MA and MF were computed. Among the computed eBIMF combinations, the second combination exhibited a statistically significant correlation with the friction properties. Specifically, the MF of eBIMF2-1, eBIMF2-2, and eBIMF2-3 and MA of eBIMF2-1 and eBIMF2-3 were statistically significant parameters, as shown in Figure 11.
Summary, Conclusion, and Recommendation
This research explores the relationship between pavement friction and texture using the EEMD algorithm. Fourteen asphalt mixture slabs were fabricated, and their friction and texture properties were evaluated using a dynamic friction tester (DFT) and a circular track meter (CT-Meter). The EEMD method was adopted to optimize and extract the eIMFs to better characterize the surface texture profile. Subsequently, three eBIMF combinations were proposed to investigate the friction-texture relationship further. Additionally, seven texture parameters were computed for the original and developed eIMF and eBIMF profiles. The key findings are outlined as follows:
i. The characteristics of the original texture profile exhibited relatively weak correlations with the DFT results, as indicated by a low correlation coefficient (r) and coefficient of determination (R²).
ii. Applying EEMD enhanced the friction-texture correlation, indicating the effectiveness and applicability of the EEMD method in optimizing the friction-texture relationship.
iii. Among the eIMFs and eBIMFs, the texture characteristics of eIMF6 exhibited the strongest correlation with the DFT results.
iv. The correlation analysis revealed that the λq, Rq, Δq, and MDE were statistically significant in predicting pavement friction.
v. Two friction-texture models were developed using backward stepwise multilinear regression analysis: (1) based on the HSA of the eBIMF2; and (2) based on the characteristics of eIMF6, with an overall R2 of 0.878, an r of 0.937, and p-value of less than 1.0E-05.
vi. Based on the sensitivity analysis, the importance of texture parameters, in descending order, was Δq, Rq, λq, MDE, and Rku.
Finally, adopting the HHT analysis would enhance the frictiontexture prediction model. However, a comparative analysis of various empirical mode decomposition methods is essential to determine the most effective decomposition approach. Additionally, future research should expand to include a broader range of asphalt mixtures and additional texture indicators to further validate and refine the models.
Acknowledgment
The authors would like to thank the Missouri Department of Transportation (MoDOT) for funding this study under Project No. TR202020-MST.
References
- Henry JJ (2000) Evaluation of Pavement Friction Characteristics. NCHRP Synthesis 291, National Cooperative Highway Research Program (NCHRP), Washington, DC.
- Hall JW, Smith KL, Titus-Glover L (2009) Guide for pavement friction. Final Report for NCHRP Project 1: 43.
- Attoh-Okine NO (1999) Application of wavelets in pavement profile evaluation and assessment. In: Proceedings-Estonian Academy of Sciences Engineering. Tallinn Techn Uni Estonian Acad Sci p. 53-63.
- Gagarin N, Huang N, Oskard M, Dennis GS, James RM (2004) The application of the Hilbert-Huang Transform to the analysis of inertial profiles of pavements. Int j Veh Des 36: 287-301.
- Ayenu-Prah A, Attoh-Okine N (2009) Comparative study of Hilbert-Huang transform, Fourier transform and wavelet transform in pavement profile analysis. Vehicle System Dynamics - Veh Syst Dyn 47(4): 437-456.
- Cho C (2010) Application of Hilbert Huang Transformation to analyze pavement texture-friction relationship. Master of Science, Pennsylvania State University.
- Rado Z, Kane M (2014) An initial attempt to develop an empirical relation between texture and pavement friction using the HHT approach. Wear 309: 233-246.
- Kane M, Rado Z, Timmons A (2015) Exploring the texture-friction relationship: from texture empirical decomposition to pavement friction. Int J Pavement Engineer16(10): 919-928.
- Yu M, Kong Y, Wu C, Xinquan X, Shanqiang L, et al (2021) The Effect of Pavement Texture on the Performance of Skid Resistance of Asphalt Pavement Based on the Hilbert-Huang Transform. Arab J Sci Eng 46: 11459-11470.
- Adu-Gyamfi YO, Attoh-Okine NO, Ayenu-Prah AY (2010) Critical Analysis of Different Hilbert-Huang Algorithms for Pavement Profile Evaluation. J Computing Civil Engineer 24(6): 514-524.
- Wu Z, Huang NE (2009) Ensemble empirical mode decomposition: a noise-assisted data analysis method. Adv Adapt Data Anal 1(1): 1-41.
- Lei Y, He Z, Zi Y (2009) Application of the EEMD method to rotor fault diagnosis of rotating machinery. Mech Syst Signal Process 23: 1327-1338
- Missouri Department of Transportation (MoDOT) (2023) 2023 Missouri Standard Specifications for Highway Construction. Jefferson City, MO.
- Buttlar WG, Abdelrahman M, Rath P (2023) Evaluation of Recycled Components in Stone Matrix Asphalt Mixes. Missouri Department of Transportation, Jefferson City, MO, USA.
- AASHTO Standard PP104-21 (2021) Sample Preparation and Polishing of Asphalt Mixture Specimens for Dynamic Friction Testing. American Association of State Highway and Transportation Officials, Washington, DC, USA.
- ASTM Standard E2157-15 (2019) Standard Test Method for Measuring Pavement Macrotexture Properties Using the Circular Track Meter. ASTM International, West Conshohocken, PA, USA.
- ASTM Standard E1911-19 (2019) Standard Test Method for Measuring Surface Frictional Properties Using the Dynamic Friction Tester. ASTM International, West Conshohocken, PA, USA.
- El-Ashwah AS, Broaddus K, Abdelrahman M (2023) Predicting the Friction Coefficient of High-Friction Surface Treatment Application Aggregates Using the Aggregates’ Characteristics. J Materials Civil Engineer 35(5): 04023089.
- Huang H, Pan J (2006) Speech pitch determination based on Hilbert-Huang transform. Signal Processing 86(4): 792-803.
- Wambold JC, Antle CE, Henry JJ, Rado Z (1995) International PIARC experiment to compare and harmonize texture and skid resistance measurements. PIARC.
- Prowell BD, Hanson DI (2005) Evaluation of Circular Texture Meter for Measuring Surface Texture of Pavements. Transp Res Rec 1929: 88-96.
- Chou C-P, Lee C-C, Chen A-C, Wu C-Y (2017) Using a constructive pavement texture index for skid resistance screening. Int J Pavement Res Technol 10(4): 360-368.
- Chen S, Liu X, Luo H, Haoyuan L, Jinagmiao Y, et al (2022) A state-of-the-art review of asphalt pavement surface texture and its measurement techniques. J Road Engineer 2(2): 156-180.
- Li L, Wang KCP, Li Q Joshua (2016) Geometric texture indicators for safety on AC pavements with 1mm 3D laser texture data. Int J Pavement Res Technol 9: 49-62.
- El-Ashwah AS, Awed AM, El-Badawy SM, Gabr AR (2019) A new approach for developing resilient modulus master surface to characterize granular pavement materials and subgrade soils. Constr Build Mater 194: 372-385.
- Bennett CR, Paterson WDO (2000) A guide to calibration and adaptation. HDM-4 Volume 5 The Highway Development and Management Series.


