


Mechanics of Sediment Plug Formation in the Middle Rio Grande, NM
Pierre Y Julien1*, Kiyoung Park2, Drew C Baird3 and Nathan Holste3
1Professor, Department of Civil and Environmental Engineering, Colorado State University, USA
2Manager, K-water, Dae-jeon, Republic of Korea
3Hydraulic Engineer, Department of the Interior, U.S. Bureau of Reclamation, Technical Service Center, Sedimentation and River Hydraulics, USA
Submission: February 21, 2024; Published: February 28, 2024
*Corresponding Author: Pierre Y Julien, Professor, Department of Civil and Environmental Engineering, Colorado State University, USA
How to cite this article: Pierre Y Julien*, Kiyoung Park, Drew C Baird and Nathan Holste. Mechanics of Sediment Plug Formation in the Middle Rio Grande, NM. Civil Eng Res J. 2024; 14(4): : 555893. DOI 10.19080/CERJ.2024.14.555893
Abstract
The mechanics of sediment plug development in the Middle Rio Grande is examined based on the historic records on the hydraulic geometry, morphology and sedimentation factors. From 1992 to 2002, the Middle Rio Grande experienced an increase in overbank flows due to channel narrowing from vegetation encroachment causing a roughness increase and a decrease in channel conveyance and sediment transport capacity. In 2002, a significant reach of the river was perched about 8 ft above the floodplain. Relationships for the daily bed aggradation rate and the estimated time for plug formation are tested with field measurements. The primary factors causing sediment plugs to form in the Middle Rio Grande are: (1) overbank flow on perched channel floodplains; and (2) high near-bed sediment concentration (Ro=1). Sedimentation factors show that overbank flows with high Rouse numbers from 0.6 to 1.7 accelerate channel aggradation. Backwater effects from the railroad bridge (Tiffany plugs) and sharp river bends (Bosque plugs) also accelerate the plug formation process. Field observations confirm significant overbank flow around shallow and narrow aggrading main channels.
Keywords: Channel Width; Perching, Rio Grande; River Modeling; Rouse Number; Sediment Plug; Sediment Transport Capacity
Introduction
A sediment plug is a channel blockage observed at sites where sediment deposition is comparable to the flow depth. Sediment plugs have occurred at several locations around the country. Diehl [1] investigated the plug formation in the Hatchie River basin in the Tennessee and attributed the plug development to low-gradient alluvial systems with sediment-laden tributaries. Shields et al. [2] studied the Yalobusha River in northern Mississippi and found that the sediment plug occurred after river channelization due to the shrinkage of bankfull discharge and the decreased channel slope. A sediment plug formed in the Guadalupe River below Canyon Dam in Texas during the summer of 2002 [3]. The main channel plug occurred during a historic flood carrying large volumes of sediment and debris from the tributary. The Clear Branch Creek of the Middle Fork of the Hood River, Oregon, also experienced a sediment plug in 2006 due to flooding and anthropogenic activities. In the Middle Rio Grande (Figure 1), sediment plugs occurred three times (1991,1995, and 2005) at the Tiffany junction area located 45 miles upstream from the Elephant Butte Reservoir. Two new sediment plugs formed in the Bosque del Apache area 13 miles upstream of the Tiffany plug in 2008 and in 2017. All sediment plugs developed within a matter of weeks and the main channel aggraded up to bank crest, causing water delivery stoppage through the main channel. Figure 2 shows a photo of the Tiffany plug in June 2008. The main channel filled up with sediment and the flow (3,700 cfs) was forced around the plug onto the floodplain.


Sediment plugs in the Middle Rio Grande have been studied by various authors. Leόn [4] developed a relationship between slope and both the width and widthdepth ratio of channels. She obtained good agreement with field measurements of the Middle Rio Grande [5]. Boroughs [6] investigated earlier sediment plugs of the Middle Rio Grande and attributed plug formation to the constriction and expansion of the river channel with overbank flows. Boroughs et al. [7] proposed the criterion PLGNUM for sediment plug formation in alluvial rivers. It consists of five major parameters to cause a sediment plug: (1) loss of flow to overbank areas; (2) overbank flows that continue for several days or weeks; (3) upstream sediment supply exceeding the local sediment transport capacity; (4) a flow-sediment discharge exponent, and (5) non-uniform vertical distribution of the total sediment load. However, the PLGNUM criterion failed to predict the 2008 Bosque plug in the Middle Rio Grande [8].
Therefore, further investigation is needed to better understand the mechanics of sediment plug formation on the Rio Grande. Bender and Julien [9] and Shrimpton and Julien [10] showed that the vertical sediment distribution, low overbank flow, backwater effects, low bank height and perching are likely to cause the sediment plugs in the Middle Rio Grande. Park and Julien [11] quantified the effects of overbank flow and sediment concentration profile on channel bed elevation in the Middle Rio Grande. Julien and Rainwater [12] also examined the flow sequences during the years prior to plug formation. In addition, numerical models have been applied to simulate bed elevation changes and identify the parameters associated with sediment plug formation on the Rio Grande [7,13,14]. Huang et al. [15], Boroughs [13], Huang and Makar [16,17] and Park [8] used 1-D or 2-D numerical programs to simulate past and future channel morphology in the Middle Rio Grande. However, there are concerns that a number of important plug formation processes were overly simplified or ignored, thus limiting the model to a specific site with minimal predictive capabilities [18]. Thus, new hypotheses need to be examined and tested to improve the simulation of sediment plug formation. The purpose of this paper is to examine the physical processes and the mechanics of sediment plug formation in order to assess the primary causing factors. The specific objectives are to: (1) investigate the mechanics of sedimentation leading to plug formation; (2) analytically examine which factors lead to the plug formation on the Middle Rio Grande; and (3) use field measurements and site visits to determine which factors contribute the most to the formation of sediment plugs. The hypotheses to be developed further in this article include three main types of parameters: (1) geometric factors, e.g. channel width and roughness; (2) backwater factors contributing to overbank flow on perched floodplains; and (3) sedimentation factors, e.g. sediment concentration profiles and main channel aggradation. This article first develops analytical relationships and then examines the main parameters based on very detailed field data collected in the Middle Rio Grande over long periods of time.
Governing Equations
The bed elevation changes are examined analytically based on the following four basic equations: (1) the flux equation; (2) a flow resistance equation; (3) a sediment transport equation; and (4) a sediment continuity equation.
Flux equation
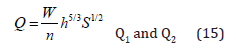
The flux equation described the flow rate at a given cross section as

where Q is the water discharge, V is the mean flow velocity perpendicular to the cross sectional area A (A = W h for wide rectangular channel, where W is the channel width and h is the mean flow depth).
Flow resistance equation (Manning)
The flow resistance equation describes the relationship between flow depth and mean flow velocity. Manning’s equation is commonly used in rivers, or
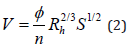
where φ is 1.49 for English units and 1 for SI units (φ =1 is used in this article), n is the Manning roughness coefficient, Rh is the hydraulic radius ( Rh = cross-section area / wetted perimeter) and 𝑆 is the friction slope.
Sediment transport equation
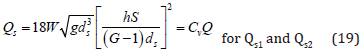
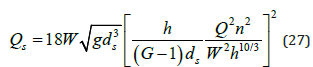
Several sediment transport equations are available and Julien’s [19] formula is used because it yields useful analytical formulations describing sediment plug formation
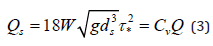
where Qs is the volumetric sediment discharge, W is the
channel width, g is the gravitational acceleration, ds is the
particle size, Cv is the volumetric sediment concentration, and 𝜏* is the Shields parameter 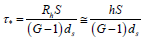 where G is the specific gravity of sediment.
Sediment continuity equation (Exner)
The Exner equation defines the changes in bed elevation with time as a function of the longitudinal changes in the rate of sediment transport, as
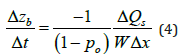
where Δzb is the change in bed elevation during a time increment Δt, po is the porosity of the bed material, ΔQs is the net change in volumetric sediment discharge over a reach length Δ𝑥 .
Mechanics of Sediment Plug Formation
The theoretical analysis of riverbed changes focuses on three types of factors: (1) geometric factors including the effects of changes in both channel width and width-depth ratios on the sediment transport capacity of a channel; (2) effects of overbank flow on main channel aggradation; and (3) backwater effects on channel aggradation rates.
Sediment transport capacity in the main channel
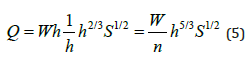
The first relationship between channel width, or widthdepth ratio and sediment transport capacity is obtained after combining Eqs. (1) and (2). For wide rectangular channels, in SI units, the hydraulic radius Rh becomes equal to the flow depth h, and
Mass balance between two successive cross sections 1 (upstream) and 2 (downstream) yields a relationship between width and depth while keeping both slope S and Manning n constant
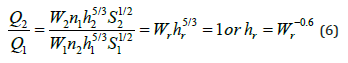
where  is the channel width ratio,
  is the
flow depth ratio.
is the
flow depth ratio.
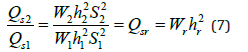
Repeating this procedure for the sediment load in widerectangular channels (Rh = h) while keeping a fixed grain size, specific gravity and channel slope, the relationship between sediment discharge and the width and depth ratios can be obtained from Eq. (3) and the definition of the Shields parameter as
The depth ratio can be eliminated by substituting Eq. (6) into Eq. (7) as
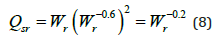
Therefore, from this relationship for wide-rectangular channels, an increase in channel width decreases the sediment transport capacity with power of -0.2 (Figure 3a). Leόn et al. [5] and Park [8] showed that the exponent of this relationship can change with different sediment transport equation, but the trend is the same.

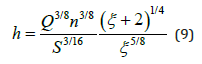
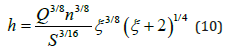
A more general relationship is obtained when using
the hydraulic radius instead of the flow depth in both the
Shields parameter and Manning’s equation. The hydraulic radius is defined as 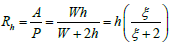 depends
on the width-depth ratio ξ =W / h . This general relationship
defines width, depth and sediment discharge as a function
of discharge, slope, Manning n and the width-depth ratio
ξ as
depends
on the width-depth ratio ξ =W / h . This general relationship
defines width, depth and sediment discharge as a function
of discharge, slope, Manning n and the width-depth ratio
ξ as
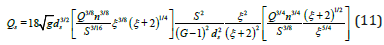
Assuming constant gravitational acceleration, sediment size, discharge, Manning coefficient, and channel slope at two cross-sections, Eq. (11) simply reduces to
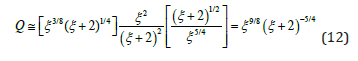
This s Q −ξ relationship is plotted in Figure 3b and shows a maximum value. Taking the derivative of this equation with respect to ξ and equating it to zero gives the value of the width-depth ratio ξm that corresponds to the maximum sediment transport capacity, thus
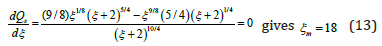
Therefore, the sediment transport capacity from Eq. (11) is maximum at a width-depth ratio ξm = 18, and it will be decreased with the power of -0.125 when ξ is much larger than 18.

Effects of overbank flow on main channel sedimentation
The analysis of overbank flow is sketched in Figure 4.
In order to determine the overbank flow effect on sedimentation in the main channel, continuity of water can be expressed as:
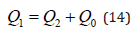
where 𝑄1 is the inflow, 𝑄2 is the main channel outflow and 𝑄𝑜 is the overbank flow. The overbank flow Qo occurs when the flow depth h exceeds the bankfull height H, and its magnitude over a reach length of overbank flow Lo is calculated using the broad-crested weir equation with the overbank coefficient Cb as
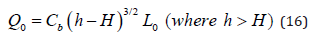
Substituting Eqs. (15) and (16) into Eq. (14) yields a relationship between overbank length and flow depth:
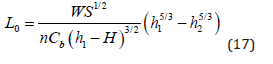
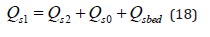
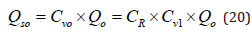
where Cb is a broad-crested weir coefficient ( Cb ≅ 1.4 in SI units or Cb ≅ 2.5 in English units). Sediment transport is defined from the mass conservation of sediment, flow depth h, and friction slope S. The incoming sediment load Qs1 equals the outgoing sediment load in the channel Qs2 plus the sediment load on the overbank area Qso and the sediment deposited on the bed Qsbed
The sediment loss to overbank areas is defined using the volumetric depth-averaged sediment concentration Cv and the concentration ratio CR = Cvo / Cv1. The concentration ratio CR is defined as the average concentration in the overbank portion of the water column Cvo divided by the depth-averaged sediment concentration Cv1 in the main channel. It is calculated using the Rouse sediment concentration profile. Therefore, the overbank sediment load is obtained from
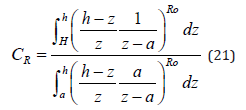
where a is the reference level (a=2ds), Ro is the Rouse
number 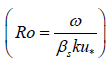 , ω is the particle settling
velocity, βs is the ratio of the sediment to fluid momentum
exchange coefficient ( βs ≈ 1), k is the von Karman constant
(k ≈ 0.4) , and
, ω is the particle settling
velocity, βs is the ratio of the sediment to fluid momentum
exchange coefficient ( βs ≈ 1), k is the von Karman constant
(k ≈ 0.4) , and  is the shear velocity. From Eq.
(21), the concentration ratio CR is plotted as Figure 5 using
calculations from Guo and Julien [20], Shah-Fairbank et
al. [21] and Yang and Julien [22]. As the Rouse number
decreases ( u* /ω increases), the concentration ratio
increases. For the Rio Grande, the Rouse number Ro > 0.6
corresponds to very low values of the concentration ratio,
i.e. CR<0.1.
is the shear velocity. From Eq.
(21), the concentration ratio CR is plotted as Figure 5 using
calculations from Guo and Julien [20], Shah-Fairbank et
al. [21] and Yang and Julien [22]. As the Rouse number
decreases ( u* /ω increases), the concentration ratio
increases. For the Rio Grande, the Rouse number Ro > 0.6
corresponds to very low values of the concentration ratio,
i.e. CR<0.1.
Sediment continuity allows the calculation of the sediment deposition rate in the main channel from
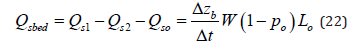
Substituting Eqs. (16, 19, 20 and 22) into Eq. (18) yields:
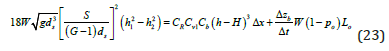
Eliminating Cb and H by combining Eqs. (17 and 17a) and (23) yields the rate of bed elevation change over time:
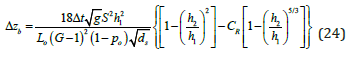
The term in brackets of Eq. (24) defines the aggradation coefficient Co shown in Figure 6. For a uniform sediment concentration profile (Ro = 0, CR = 1), the daily bed aggradation rate would be very low. The condition of interest, CR<0.1, however, yields high values of Co. Therefore, the high values of Ro for the Rio Grande largely contribute to the formation of sediment plugs.
This general bed aggradation relationship is particularly of interest when h2 is the bankfull height h2 = H and h1 > H. The aggradation depth from Eq. (24) can be examined in terms of two parameters: (1) the aggradation magnitude M; and (2) a sediment plug coefficient CP from
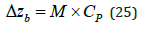
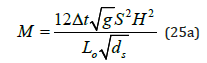
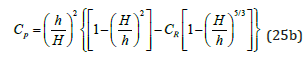

The magnitude M determines the aggradation depth scale in m. The sediment plug coefficient CP is plotted in Figure 7 as a function of h/H.
For instance, the daily (Δt = 86,400 s) aggradation of
fine sediment at ds = 0.00025 m (or settling velocity ω =
0.035 m/s) for a channel at a slope S = 0.0007, flow depth H = 1m 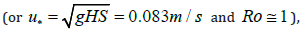 over
an overbank flow length Lo = 300m is calculated from Eq.
(25a) as 0.33 m. The sediment plug coefficient 0.25 P C ≅
from Eq. (25b) when h = 1.1m, or h/H = 1.1, and CR<0.1.
Therefore, we can expect a daily bed aggradation rate of Δzb ≅ 0.33 × 0.25 = 0.08m in this channel.
over
an overbank flow length Lo = 300m is calculated from Eq.
(25a) as 0.33 m. The sediment plug coefficient 0.25 P C ≅
from Eq. (25b) when h = 1.1m, or h/H = 1.1, and CR<0.1.
Therefore, we can expect a daily bed aggradation rate of Δzb ≅ 0.33 × 0.25 = 0.08m in this channel.
In the Rio Grande, the sediment concentration profile is non-uniform (e.g. Ro ≅ 1and CR < 0.1, and therefore CP is high). This physically means that the sediment load is concentrated near the bed and the clear water in the overbank flow causes significant aggradation from the large decrease in sediment transport capacity in the main channel. This enrichment in sediment concentration in the main channel accelerates the sediment plug formation process.
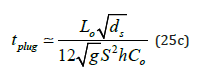
It is also interesting to estimate the plug formation time tplug which is the time required for a plug to form as a result of overbank flow. This is obtained from Eq. (24) when Δzb = h1
Backwater effects


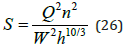
Backwater effects on channel bed elevation changes are examined by considering flow discharge (Eq. 2), sediment transport (Eq. 3), and sediment continuity (Eq. 4). From the flow discharge equation, friction slope S can be expressed as,
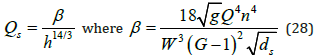
Substituting Eq. (26) into the sediment transport capacity Eq. (3) yields
Keeping the discharge, Manning n, channel width W and grain size ds constant gives
Now substituting Eq. (28) into the sediment continuity Eq. (4) gives:
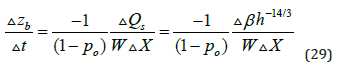
Thus, when the flow depth increases due to backwater effects, the channel bed quickly aggrades. Narrow channels aggrade faster and are more likely to plug than wide channels. The reach length Δx can be determined from the distance required for suspended sediment to settle from the suspension Δx ≅ 5Q /Wω where ω is the settling velocity [23]. At a discharge of Q = 100 m3/s, a W = 60 m wide sand-bed channel with ω = 0.03 m/s, the length required for sediment settling in a backwater zone would be about 280 m long.
Sediment Plugs of the Middle Rio Grande, New Mexico
The sections of the Middle Rio Grande examined in this study include the Bosque del Apache Reach (Bosque plugs) and the Elephant Butte Reach (Tiffany plugs), which are identified officially by Reclamation based on the presence of geologic and geomorphic controls. The Bosque Reach is located in the Bosque del Apache National Wildlife Refuge.
Changes in planform geometry
Owing to the channel narrowing and vegetation encroachment, bank roughness has significantly increased over time. As shown in Figure 8, around the Bosque plug location (section Agg/Deg 1550), the channel width decreased 40% between 1962 and 2002 and another 70% between 2002 and 2008.

Cross-section Geometry
Cross-section data are based on numerous georeferenced field surveys and with comparisons with GIS maps. A total of 266 rectangular composite cross sections (main channel and floodplains) in 1992 and 404 cross sections (aggradation/degradation lines) in 2002 were available for this study. Comparisons with historic satellite imagery delineate the vegetation to vegetated channel widths. The cross-section data, which are used in the analyses Park and Julien [11] and Park [8]) include: distances, bed slopes, bed elevations, minimum bed elevations, channel widths, bank crest elevations. Figure 9 shows changes in cross-section geometry of the perched river reach near the Tiffany plug. An overbank flow analysis by Bender and Julien [9] defined perching when the thalweg of a cross section was higher than the floodplain elevation. A perching ratio can be defined as the number of perched cross-sections divided by the total number of cross-sections. The perching ratio was 13 % in 1992 but increased to 87 % in 2002 according to [8].

Channel roughness data
Flow discharges at San Marcial (USGS 08358400) and at San Acacia (USGS 08354900) are used to determine the amount of overbank flow and water losses. The USGS gauges provide daily flow discharges since 1958. The main water losses from the main channel are due to overbank flows in areas with perched cross-sections. Two major locations with active return flows could be located based on the geometric data using LIDAR, DEM, HEC-RAS and satellite imagery.
A Manning n value of 0.017 was used to describe grain roughness in the main channel along the entire Tiffany Junction Reach based on previous studies [24]. FLO Engineering [25] also obtained a Manning n of 0.015-0.017 for cross-sections at the upstream portion of the Tiffany Junction Reach with data from 1993 and 1994 at flows ranging from 2,700 cfs to 5,400 cfs. The representative Manning n value provided by Reclamation was 0.017 ~ 0.024 for the main channel and 0.1 in floodplain areas. The composite Manning n values ranged from 0.02~0.075 depending on the flow discharge and location [8].
Sedimentation data
From the grain size analyses from the Bosque Reach report Paris et al. [26] and the Elephant Butte Reach report [27], the overall median diameter was 0.2 mm in 1992 and increased to 0.23 mm in 2002. There is a slight difference between San Acacia and San Marcial in terms of sediment size, but no significant relation between the seasonal sediment size and sediment plug formation could be observed. Thus, the median particle diameter can be considered constant for the entire reach. Several sediment transport equations are in good agreement Leόn [4], Boroughs [6] with the field measurements on the Rio Grande, as shown at San Acacia (USGS 08354900) in Figure 10.


The Rouse parameter which is a function of sediment fall velocity and shear velocity has increased over time since bed sediment particles have slightly coarsened (0.2 mm in 1992 and 0.25 mm in 2002) and the channel flow depth decreased 52% between 1992 and 2002. Sediment concentration profiles indicate Rouse number values ranging from 0.6 to 1.7. At such high values of the Rouse number, the sediment concentration becomes very small near the free surface and sediment is mostly transported near the bed.
Backwater Observations
The backwater effects from the bridge at San Marcial has been identified by Park [8] as a factor affecting the Tiffany plug formation. Historical records of the flooded area corroborate the influence of backwater effects on sediment plugs (Figure 11). The backwater effect due to bridge contraction speeds up the channel sedimentation, which is the primary triggering factor of the Tiffany plugs.
The presence of sharp bends 0.6 mile downstream of the 2008 Bosque plug location (Agg/Deg 1555 ~ Agg/ Deg 1557) has also been considered as in important factor triggering the Bosque Plug as shown in Figure 12. The Google imagery shows multiple sharp bends around Agg/Deg 1555 and the lateral migration on the east side bank resulted in another bend at Agg/Deg 1557. The corresponding sediment filling time up to the bank height (2.85 ft, 2002 HEC-RAS geometry) was estimated to be less than 3 weeks. The sharp bends located less than 1 mile downstream of the 2008 Bosque plug location were the primary factor explaining why the plug formed in the Bosque area, rather than in the Tiffany area, in 2008.

Field Observations of the Bosque Plugs
A site visit of the Bosque del Apache reach of the Rio Grande was conducted on May 26 and June 6, 2017 by [28,29]. The purpose of the site visits was to document overbank flow conditions and the status of potential sediment plug formation. The field investigation in May 2017 reported a sediment plug forming between RM 81- 82 (2012 river demarcations) at approximately the same location as the 2008 sediment plug. Flow depths were only 1 - 1.5 feet across the entire channel at a section (~150 feet wide) where depths should have been about 4 feet based on similar conditions observed upstream and downstream. It was estimated that about 1/3 to 1/2 (1,000 to 1,500 cfs) of the total flow was being conveyed by the main channel. Bed material in this area appeared to be medium sand. In addition to overbanking flow leaving the main channel, areas where overbanking flows were returning to the main channel were also observed. This occurred even when the top of bank was perched 3-4 feet above the floodplain. In June 2017, the reported flow depths were generally less than 2 feet across the entire channel. It was estimated that about 1/12 (~250 cfs) of the total flow was being conveyed by the main channel. Bed material in this area appeared to be medium sand. While wading over the top of the sediment plug there were several areas, particularly upstream, where the bed was soft (uncompacted and/or unconsolidated) and considered to be recent sediment deposition areas
Figure 13 shows a June 2019 photo of the flow on the left-bank floodplain in the direction perpendicular to the main river flow direction from a field survey [30]. Field observations show that the flow is leaving the channel at nearly a 90-degree angle and flowing down the perched bank to the lower-lying floodplain. Figure 14 shows the most recent aerial view of the Bosque plug illustrating the effects of the sharp bends at the downstream end of the plug as a source of additional head loss and forcing mechanism to raise the water level and causing surface runoff on a perched floodplain and subsequent drainage of overbank flow on side channel areas.


Conclusion
Based on the historic flow and geometric characteristics of plug areas, several factors were identified and examined in relation to the sediment plug formation at two locations on the Middle Rio Grande (Bosque plug and Tiffany plug). The main conclusions of this study include:
1) Theoretical derivations define the relationships between channel width (also width/depth) and sediment discharge, between overbank flows and sedimentation rates in the main channel, and between backwater effects and channel bed elevation. Relationships for the daily bed aggradation rate and the estimated time for plug formations have been formulated. The increases in width-depth ratio, overbank flow, Rouse number and backwater effects result in the decrease of sediment transport capacity, leading to the main channel aggradation. Channel narrowing and the increased floodplain roughness also increase overbank flows.
2) Historic sediment plugs (both the 1995 Tiffany plug and the 2008 Bosque plug) of the Middle Rio Grande were analyzed with an analytical model leading to Eqs. (24) and (25). Significant overbank flow is observed at a discharge of 3,500cfs (100 m3/s). The Rouse number is typically close to unity and ranged from 0.6 to 1.7 during the period from 1992 to 2002.
3) Field observations described sustained overbank flows in shallow perched channels with freshly deposited sediment in the main channel. Local backwater effects accelerate the process and sediment plugs can form during a single flood. The Tiffany plugs have been affected by backwater from the San Marcial railroad bridge. The Bosque plug was more influenced by channel narrowing, an increase in bank roughness and backwater from sharp bends. Field observations at the Bosque plugs in 2017 and 2019 confirm the expected theoretical results.
Acknowledgment
Funding from the U.S. Bureau of Reclamation is gratefully acknowledged. However, the results do not necessarily reflect policies or endorsement of Reclamation. We would like to express sincere appreciation to Jonathan AuBuchon, Ari Posner, and Robert Padilla at the USBR for their support and assistance with all aspects of this study. We are also grateful to Katherine Anderson, Seema Shah-Fairbank, Ted Bender, Tracy Owen, Chris Shrimpton and Jon Rainwater at Colorado State University for their contributions to the analysis of the Rio Grande database. The authors are also grateful to K-water for the support to the second author during the course of his dissertation research at CSU. The valuable comments from anonymous reviewers have also been sincerely appreciated.
Notation
The following symbols are used in this paper:
a = reference elevation
A = cross sectional area
Ca = near-bed sediment concentration
Cb = broad-crested weir coefficient
Co = aggradation coefficient
CP = sediment plug coefficient
CR = concentration ratio
Cv = volumetric sediment concentration
ds = sediment particle size
G = specific gravity of sediment
g = gravitational acceleration
h = mean flow depth
hr = flow depth ratio
H = bank height
Lo = length of overbank flow
M = sediment plug magnitude
n = Manning roughness coefficient
P = wetted perimeter
po = porosity of the bed material
Q = water discharge
Qs = volumetric sediment discharge
Qbed = sedimentation rate on channel bed
Qo = overbank flow discharge
q, qs = unit flow and sediment discharges
Qs = sediment discharge
Qso = overbank sediment discharge
Qsr = sediment discharge ratio
Ro = Rouse number
Rh = hydraulic radius
S = friction slope
t = time
tplug = plug formation time
u* = shear velocity
V = mean flow velocity
W = channel width
Wr = channel width ratio
x = downstream distance
zb = bed elevation
Greek symbols
β = coefficient of the stage-discharge relationship
βs = ratio of sediment to fluid momentum exchange coefficient
Δzb = change in channel bed elevation
κ = von Kármán constant
ξ = width-depth ratio
ξm = width-depth ratio for the maximum sediment transport capacity
τ* = Shields parameter
ω = Settling velocity of sediment
ϕ = 1.49 for English units and 1 for SI units in Manning equation
References
- Diehl TH (1994) Causes and effects of valley plugs in West Tennessee. Proc. of the Symp. on Responses to Changing Multiple-Use Demands; New Directions for Water Resources Planning and Management. Am Wat Res Assoc (AWRA), Nashville, TN, Pp. 97-100.
- Shields FD, Knight SS, Cooper CM (2000) Cyclic perturbation of lowland river channels and ecological response. Regul Rivers Res Manag 16: 307-325.
- Gergens R (2003) Canyon Lake flood emergency operations. Proc. Watershed System 2003 Conf., U.S. Army Corps of Engineers, Northwestern Division, Portland, OR.
- Leόn C (2003) Analysis of equivalent widths of alluvial channels and application for instream habitat in the Rio Grande. Ph.D. dissertation, Colorado State University, USA.
- Leόn C, Julien PY, Baird DC (2009) Case Study: Equivalent widths of the Middle Rio Grande, New Mexico. J Hydraul Eng 135: 306-315.
- Boroughs CB (2005) Criteria for the Formation of Sediment Plugs in Alluvial Rivers. Ph.D. Dissertation, Colorado State University, Fort Collins, CO, USA.
- Boroughs CB, Abt SR, Baird DC (2011) Criteria for the Formation of Sediment Plugs in Alluvial Rivers. J Hydraul Eng 137: 569-576.
- Park K (2013) Mechanics of sediment plug formation in the Middle Rio Grande.” Ph.D dissertation, Colorado State University, Fort Collins, CO.
- Bender TR, Julien PY (2011) Bosque Reach -Overbank flow analysis 1962-2002. Tech. Report for Reclamation, Albuquerque, NM, P. 175.
- Shrimpton C, Julien PY (2012) Middle Rio Grande, Assessment of Sediment Plug Hypotheses. Tech. Report for Reclamation, Albuquerque, NM, P. 48.
- Park K, Julien PY (2012) Mechanics of sediment plug formation in the Middle Rio Grande. Tech. Report for Reclamation, Albuquerque, NM.
- Julien PY, Rainwater J (2014) Review of Sediment Plug Factors - Middle Rio Grande, NM, Tech. Report for Reclamation, P. 66.
- Boroughs CB, Padilla R, Abt SR (2005) Historical sediment plug formation along the Tiffany Junction Reach of the Middle Rio Grande. Proc. 2005 New Mexico Water Research Symp., New Mexico Water Resources Research Institute, Las Cruces, NM.
- Tetra Tech, Inc. (2010) River mile 80 to river mile 89: Geomorphic Assessment and Hydraulic and Sediment-continuity Analyses. Tech. Report for Reclamation, Albuquerque, NM.
- Huang JV, Greimann B, Yang CT (2003) Numerical Simulation of Sediment Transport in Alluvial River with Floodplains. Int J Sed Res 18(1): 50-59.
- Huang JV, Makar PW (2010) 2009 historical bed elevation trends and hydraulic modeling: San Antonio to Elephant Butte Reservoir. Tech. Report for Reclamation.
- Huang JV, Makar PW (2011) Sediment modeling of the Middle Rio Grande with and without the temporary channel maintenance in the Delta: San Antonio to Elephant Butte Reservoir. Tech Report for Reclamation.
- Lai YG (2009) Sediment Plug Prediction on the Rio Grande with SRH Model. Bureau of Reclamation, Technical Service Center, Denver, CO.
- Julien PY (2018) River Mechanics, Cambridge University Press, New York, USA.
- Guo J, Julien PY (2004) An Efficient Algorithm for Computing Einstein Integrals. J Hydraul Eng 130(12): 1198-1201.
- Shah-Fairbank S, Julien PY, Baird DC (2011) Total Sediment Load from SEMEP using Depth-Integrated Concentration Measurements. J Hydraul Eng 137(12): 1606-1614.
- Yang CY, Julien PY (2019) The ratio of measured to total sediment discharge. Intl J Sed Res 34: 262-269.
- Julien PY (2010) Erosion and Sedimentation, Cambridge University Press, New York, USA.
- Reclamation (2011) Bosque del Apache Sediment Plug Management: alternative analysis. U.S. Dept. of the Interior, Bureau of Reclamation, Albuquerque, NM.
- FLO Engineering, Inc. (1995) “Manning’s n-value calibration for SO lines, 1993 runoff season.” Tech. Report for Reclamation.
- Paris A, Anderson K, Shah-Fairbank SC, Julien PY (2011) Bosque del Apache Reach Hydraulic Modeling Analysis. Tech Report for Reclamation, Albuquerque, NM.
- Owen TE, Julien PY (2011) Elephant Butte Reach report: Hydraulic Modeling Analysis. Tech Report for Reclamation, Albuquerque, NM.
- AuBuchon J, Harris A. Lawlis B, Holste N (2017a) BDA Pilot Project May 26, 2017 Site Visit - Trip Report. U.S. Dept. Interior, Bureau of Reclamation, USA, P. 24.
- AuBuchon J, Hobbs B, Gonzales E, Hobbs B, Lawlis B, et al. (2017b) BDA Pilot Project June 6, 2017 Site Visit - Trip Report” U.S. Dept. Interior, Bureau of Reclamation, USA, P. 138.
- Holste N, Harris A, Hobbs B (2019) Increasing Freedom Space and Sustainability on the Rio Grande through Channel Realignment, Federal Interagency Sedimentation and Hydrologic Modeling Conference, SEDHYD, Reno, NV, June 24-28, 2019.


