Determining the Cause(s) of Periodic, Pulsed Brown Pelican (Pelicanus occidentalis) Mortality on South Texas Roads
Andrew Birt*, John Young and Robin Gelston
Texas A&M University Transportation Institute, USA
Submission: August 29, 2023; Published: September 12, 2023
*Corresponding Author: Andrew Birt, Texas A&M University Transportation Institute, USA
How to cite this article: Andrew Birt*, John Young and Robin Gelston. Determining the Cause(s) of Periodic, Pulsed Brown Pelican (Pelicanus occidentalis) Mortality on South Texas Roads. Civil Eng Res J. 2023; 14(1): : 555881. DOI 10.19080/CERJ.2023.14.555881
Abstract
This paper deals with an unusual case of wildlife-vehicle collisions in south Texas. For a number of years, periodic Brown Pelican (Pelicanus occidentalis) mortality events have been occurring on State Highway 48 (SH48) which links Brownsville and Port Isabel in Texas. These mortality events occur over the course of 24 hours during fall and winter frontal storms. During such events, large numbers of pelicans crash land on the roadway, where they have a high chance of being killed or injured by motorists. As many as 80 birds have been killed in a single event. The purpose of this paper is to describe a series of research methods used to understand the cause of this mortality. These research methods include: statistical modeling; wind tunnel and computational fluid dynamics studies; and models of pelican flight. The research suggests that the Brown Pelican mortality is attributable to several interacting factors. First, the proximity of the roadway to a major Brown Pelican roost site, and natural fly ways result in large numbers of birds crossing over a relatively small section of highway. Second, flight models suggest that Brown Pelicans find it physiologically demanding to fly into sustained strong winds (i.e., greater than 35 mph). Third, Concrete Traffic Barriers on the windward side of the highway cause unusual airflows that are difficult for pelicans to fly through. The paper is written to document and communicate this unusual phenomenon, and its possible causes to a broad ecological and transportation audience.
Keywords: Pelican; Pelicanus occidentalis; Wind Tunnel; Computational Fluid Dynamics; Road Ecology; Wildlife-vehicle Collisions
Introduction
The Brown Pelican (Pelicanus occidentalis) is a large coastal seabird species with a wingspan of 6-8 ft, and a body mass between 4-11 lbs. They have a large geographic range, spanning the Gulf, Pacific, and Atlantic coasts of the Americas. In south Texas, populations peak in fall and winter as birds migrate to the area from summer breeding grounds in more northern latitudes. A smaller population remain in the area year-round. Brown Pelicans are plunge-divers, feeding by diving head-first into the water to trap fish (Shields, 2014). In the 1970s, populations seriously declined as a result of insecticide poisoning and other human threats. They became federally protected in 1970, and as a result, populations are recovering in south Texas. Although not currently threatened or endangered (they were delisted in 2009), Brown Pelicans are a charismatic and popular winter resident of the south Texas coastal societies, and their local ecology.
Frequent but periodic Brown Pelican mortality occurs on an approximately 3-mile stretch of State Highway 48 (SH48), which links Brownsville to Port Isabel, and ultimately South Padre Island. During strong northerly winds associated with cold fronts, a proportion of pelicans attempting to fly across the road lose altitude and ‘crash land’ on the road surface. Typically, 5-80 pelicans are killed during an event, and many more are saved by local volunteers. The pelican mortality on SH48 is important for a number of reasons. First, the scale of mortality is problematic for both environmental and animal welfare reasons. Second, the events present a serious public safety risk to volunteers who assemble in an attempt to save ‘downed’ (crash-landed) birds. The goal of this paper is to documents this unusual case of wildlife-vehicle mortality, and describe research methods we have used to understand the cause of the mortality. The research team present a number of research techniques that we have used to improve understanding the cause of this particular type of pelican mortality. Although Pelican mortality is unlikely to ever become a major transportation problem, we argue that our research is important in the more general case of documenting specific road ecology problems, and developing a toolbox of research methods to understand and mitigate a broader set of road ecology problems. To keep the narrative manageable, and useful for a broad audience, we present summaries of each research step, largely in the chronological order of our original research.
Methods
Our research consist of four interrelated tasks/methods that together provide a more complete understanding of the causes of mortality.
a. Describe the study area and background to the mortality problem.
b. Develop statistical models to evaluate the key environmental factors that drive mortality.
c. Conduct aerodynamic studies of the roadway using wind tunnel experiments and Computational Fluid Dynamics (CFD).
d. Develop and test simple models of Brown Pelican flight.
Study Area and Background
The major hotspot of pelican mortality occurs on and adjacent to the Carl “Joe” Gayman Bridge located on SH 48 between Brownsville, TX and Port Isabel, TX (the area marked in Figure 1 (a)). SH48 runs parallel to the Port of Brownsville Ship Channel (located less than one-quarter of a mile to the southeast). To the northwest of the corridor lies the Bahia Grande complex - a 21,762-acre wetland comprising Bahía Grande, Laguna Larga, Little Laguna Madre, and other lagoons, which connect to the Laguna Madre and the Gulf of Mexico. Pelican mortality has occurred all along SH48 between San Martin Bridge and the southern end of the Bahia Grande, but has tended to be concentrated on sections adjacent to water, and especially around Carl Gayman Bridge. Most of SH48 is a causeway elevated approximately 10 ft above the surrounding water, and raised by slopes on either side. The road comprises two lanes in either direction, plus 12 foot outer and median shoulders, and has a speed limit of 75 mph. Segments of causeway flanked by open water have 36-inch Concrete Traffic Barriers (CTB’s) installed on the outside lanes (type SSTR). Most of the sections covered in Figure 1 also have 42-inch median CTB’s installed. Two bridges - San Martin and Carl Gayman - cross channels linking San Martin Lake and the Bahia Grande to the Brownsville Ship Channel. The bridges are elevated slightly above the causeway, and are approximately 400-foot long (Figure 1(d)).
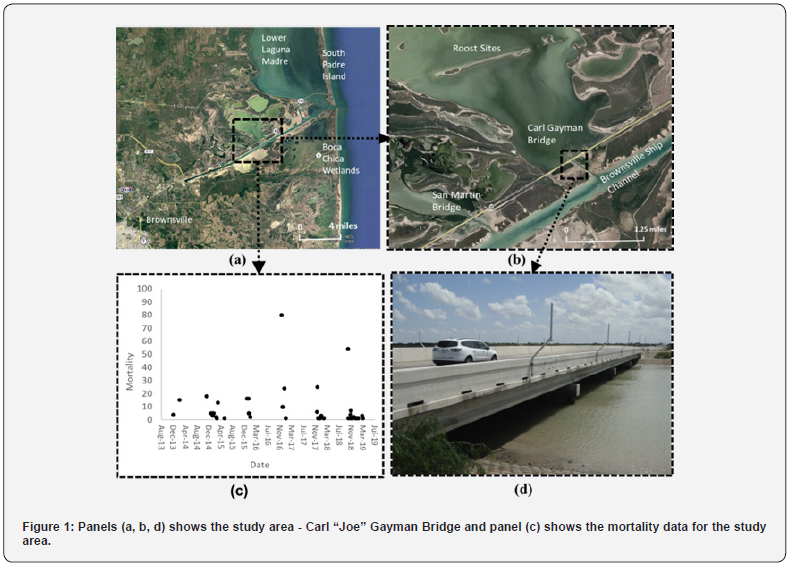
In the 1930s and 1950s, the hydrology of the Bahia Grande complex was impacted by the construction of the Brownsville Ship Channel, resulting in degradation of the original wetland. Prompted by the actions of locals (notably Carl ‘Joe’ Gayman, in 1999 the U.S. Fish and Wildlife Service (USFWS), the Nature Conservancy and the Conservation Fund purchased the Bahía Grande and the surrounding land, and began an official restoration plan. A key component of this restoration was to widen and deepen the Carl Gayman Channel, to provide hydraulic connectivity to the Brownsville Ship Channel and therefore the Laguna Madre. The Texas Department of Transportation (TxDOT) lengthened and widened what is now the Carl ‘Joe’ Gayman Bridge in support of this restoration effort. The ongoing restoration efforts have been an environmental success, and have so far transformed 10,000 acres of land into a dynamic, natural landscape of national and international importance. In line with the restoration of the physical environment, the wetland has resulted in the reestablishment of flora and fauna. This includes a growing population of brown pelicans that use islands in the Bahia for overnight roosts.
TxDOT, local conservationists, and state and federal wildlife agencies have been monitoring the mortality, while local news agencies also report incidents. Through a mix of observation and speculation by scientists and the public alike, the causes of mortality have been attributed to cold fronts, and the CTBs on the road. A volunteer group has also formed to help save the pelicans (during cold fronts) and to encourage longer term mitigation. Between 2 and 20 volunteers assemble at the beginning of forecasted storm events and attempt to slow down traffic and save birds from the traffic lanes. Often this occurs in conditions of low light, high winds, cold temperature, rain and against the background of fast-moving traffic and distressed pelicans and volunteers. Reportedly, the volunteers save a great many pelicans, but are unable to save all downed birds. In some cases, injured birds are saved from the road but cannot be rehabilitated. When cold fronts occur during the evening, darkness often forces volunteers to leave the roadway while crash landings are still occurring.
TxDOT has been collecting pelican mortality data on SH48 since 2013 when the mortality first became apparent as a consistent, if punctuated phenomenon. In 2014, TxDOT fitted the Carl Gayman and San Martin Bridges with ‘pelican poles’ which extend an additional 8 ft above the CTBs, to encourage higher altitude crossings (see Figure 1(d)). Although it is thought that the poles have helped mitigate mortality, events still occur. In 2016, they commissioned the research outlined in this paper to gain better insights into the cause of mortality, and find long term solutions to the problem.
Statistical Models of Pelican Mortality on Texas Bridges
The objective of this component of the research was to develop statistical models to determine the relationship between the occurrence and severity of pelican mortality events (number of pelican deaths per day) and environmental variables such as temperature, wind conditions (speed and direction), and tides. Between December 2013 and March 2019, TxDOT has collected Pelican carcasses from SH48. The data provide approximate counts of pelican mortality over the study time period. To estimate weather and other environmental variables over the same period, we downloaded weather data from NOAA [1]. Because no weather data exists for the exact location of mortality, we downloaded data from the three nearest NOAA weather stations, and checked the similarity of records among stations. The study team converted wind direction to a categorical variable describing the direction of the wind relative to the orientation of SH48 - i.e., North Perpendicular (NP), South Perpendicular (SP), East Perpendicular (EP), and West Perpendicular (WP). The tide data were included because the research team suspected that daily movement over the causeway (and therefore mortality) could be affected by the availability of roost islands in the Laguna Madre.
The research team then consolidated the indirect (environmental) and direct (mortality) variables into a single data matrix containing information for each day of the study period, irrespective of whether mortality events occurred. The candidate indirect variables used in the modeling were: Average Daily Wind Direction, Average Daily Wind Speed, Minimum Temperature, Average Tidal Water Level. The direct variables were daily pelican mortalities. Normally, counts such as the daily pelican mortality data would be modeled using a Poisson regression model. Poisson regression assumes that the logarithm of a Poisson distributed response variable (mortality), can be modeled by a linear combination of unknown parameters and indirect variables (i.e., weather variables). However, the pelican mortality data (Figure 1(c)) is characterized by infrequent mortality events. The data is therefore over dispersed or zero-inflated, i.e., dominated by a large number of days with no observed mortality. To account for this over dispersion, a Zero-Inflated Poisson model (ZIP) was used. ZIP regression is used in cases where count data has an excess of zero counts, and where it is reasonable to believe those excess zeros are generated by a separate process from the count values and can be modeled independently. For example, it is possible that many of the days with zero mortality can be explained by the fact that no pelicans (or an insufficient number) crossed the bridge on that day, or that they crossed the bridge using a different flight altitude, or flight behavior. Whatever the explanation for the process, the Poisson component of the ZIP assesses the degree to which weather variables influence the number of birds killed conditional on a mortality event taking place on that day. To understand the impact of different variables on pelican mortality, we used Akaike’s information criterion (AIC) to select the environmental variables that provided the most parsimonious predictions of mortality (i.e., the goodness of fit of the model to data balanced by the number of explanatory variables/parameters).
Airflow over SH48
Anecdotal accounts of pelican mortality included their coincidence with strong northern winds, and many observers suspected that the interaction of high winds and the CTBs on the road were responsible for crash landings. To test these ideas, the research team used wind tunnel modeling and computational fluid dynamics studies to understand patterns of airflow over the roadway. The wind tunnel testing involved placing a scale model of sections of SH48 in a wind tunnel (Texas A&M University Oran W. Nicks Low-Speed Wind Tunnel), and measuring the wind speed and pattern of wind as the bridge structure deflected it. Scaled models (1:37.5) of the causeway and bridge were constructed of plywood. The models were constructed so that the CTBs could be detached from the road to investigate their effect on airflow. The bridge model was also constructed to enable the bridge deck to be raised at different heights from the floor of the wind tunnel (simulating different water levels under the bridge). Finally, all models were constructed so they could be rotated in the wind tunnel to explore the effects of wind direction (relative to the bridge) on airflow patterns. All wind tunnel experiments were tested using a laminar 35 mph input wind. Velocity measurements were taken at fixed points on the bridge using an electronic measurement probe. Causeway and bridge sections of the model were tested at wind angles of 0, 15 and 30 degrees (where 0 degrees is perpendicular to the longitudinal direction of the road section). The research team also performed analogous aerodynamic testing using CFD software. CFD testing was performed using SimScale software. CFD simulations were performed for the same scenarios as were tested in the wind tunnel, enabling the research team to compare and cross-validate the outputs of wind tunnel and CFD simulations. The outputs were post processed using Paraview Software.
Models of Pelican Flight
Pennycuick [2] has developed models of bird flight using a series of equations representing phenomenological aspects of the forces constituting bird flight. In addition to deriving the formula, he has also tested these equations under a range of natural and controlled conditions. The research team used these models to estimate power curves and other useful flight characteristics for the Brown Pelican. We assembled the key variables of Brown Pelican mass, wingspan, and wing area as inputs to the model, and used them to derive power curves for optimum Brown Pelican flight. To validate the model, we also researched the literature for direct and controlled observations of Brown Pelican flight, and examined video footage of birds attempting to cross SH48 during mortality events (video footage provided by local volunteers).
Results
Statistical Models of Pelican-Vehicle Mortality on Texas Bridges
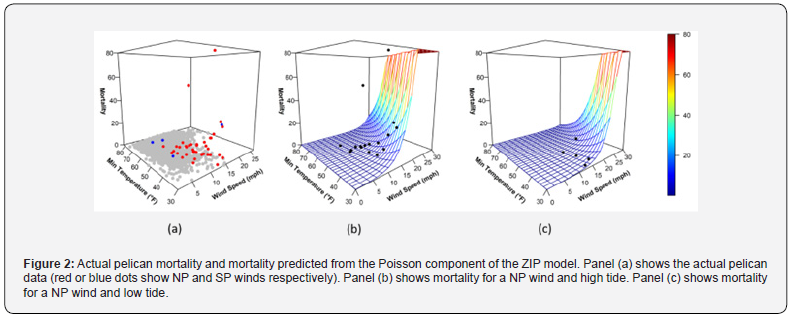
The ZIP model indicated wind direction, average daily wind speed, minimum temperature, and the water level had some influence in predicting the magnitude and timing of Brown Pelican mortality. Table 1 shows the model parameters for the model that provided the best fit to the data (based on AIC). Wind direction was treated as a categorical variable, so there are four different parameters used to predict mortality - depending on the wind direction. The model parameters suggest increased mortality risk occurs when winds originate from NP, SP, and EP directions (i.e., perpendicular to the bridge) than if they are from WP directions. The parameters also suggest a positive relationship between wind speed and mortality, and water level and mortality. The minimum temperature is negatively related to mortality (i.e., all things being equal, lower daily minimum temperatures result in higher mortality). The final parameter in the table is the zero-inflated term. This parameter translates to the probability of a mortality event occurring on any particular day, and is assumed to depend on factors other than weather (e.g., the probability of a large number of birds flying over the bridge at a specific time of day).

Figure 2 shows graphs of actual and predicted mortality relative to wind speed and minimum temperature. These figures only show the Poisson component of the model. In other words, they assume mortality rates are directly related to weather and tide variables. Figure 2(a) shows actual mortality plotted against wind speed and minimum temperature, with mortality events occurring with NP and SP winds colored blue and red respectively. Figure 2(b) shows the predictions from the Poisson component of the model assuming a NP wind and high water level. Figure 2(c) shows NP predictions but with the low water level. An important point for interpreting these models and graphs concerns the use of daily average variables (from available stations) as independent predictors. We acknowledge that in this modeling exercise ‘average’ values can only serve as a proxy for the ‘actual’ conditions that ocured after the onset of a storm (which are what we are actually attempting to relate to mortality). For example, daily average windspeeds are likely to be lower than ‘typical’ in situ wind gusts.
Airflow over the State Highway 48 Bridges and Causeways
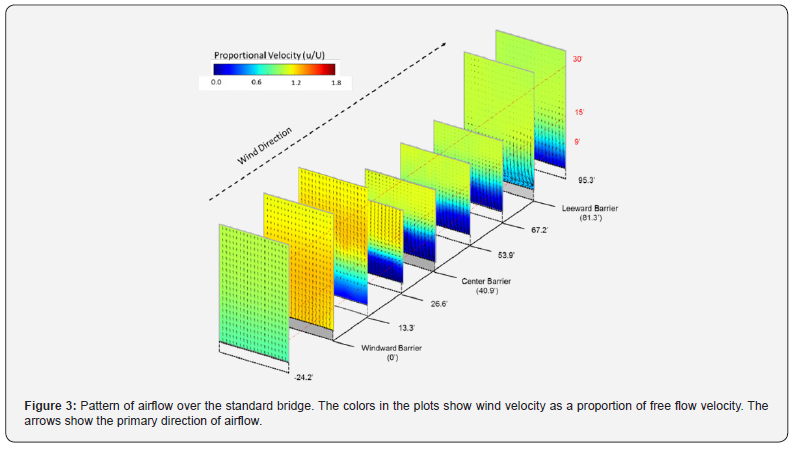
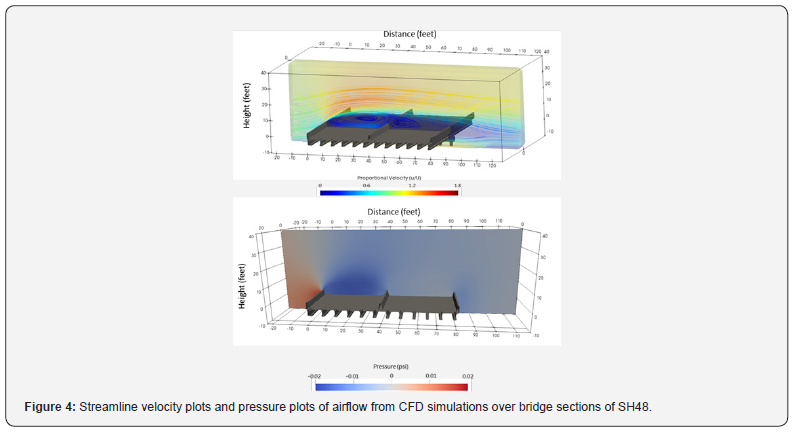
Figure 3 shows the airflow over the bridge scale model as measured in the wind tunnel experiments. In this figure, the panels are arranged as cross-sections of the roadway. Each panel coincides with the locations at which a electronic probe took velocity and pressure measurements. The panels are colored to show the velocity at a location proportional to the input velocity (green areas indicate no difference between input velocity and a measured location, blue areas show local air moving slower than the input wind, and yellow to red colors show higher local velocities than the input speed). Figure 4 shows an analogous view of airflow over the bridge using CFD results. As in the case of wind tunnel outputs, the plots show local velocity proportional to the input airflow. To a large extent, the airflow patterns from the CFD and Wind Tunnel matched qualitatively, but a lack of fully quantitative data from the wind tunnel prevented the research team from performing a more thorough validation.
Both methods suggest that the windward CTB influences airflow over the bridge. The CTB creates an upward deflection of the input airstream. At altitudes higher than 15 ft (above the road), airflow over the first two lanes has high velocity (1.2 times the input velocity) and a major upward component. The maximum height of this layer of fast-moving air occurs close to halfway across the bridge. Over the leeward lanes, the air begins to slow down, and has a strong downward component. Behind the windward CTB, a large vortex forms (slow-spinning air), and between the vortex and the upward layer of fast areas, a few other layers form with speeds intermediate to the fast layer above and the slower layer below. Some of these layers have enough velocity to cause a secondary but relatively minor vortex behind the median CTB. At the leeward side of the bridge, the air has decelerated such that the leeward CTB has little effect on airflow. These patterns of airflow were similar for both causeway and bridge sections of the road. The main differences between these two cases are the presence of slopes on the windward side of the causeway (instead of airspace under the bridge model); and the lack of a leeward CTB on the causeway. Figure 4 shows CFD generated airflow patterns simulated over the bridge model, with a 15 and 30 degrees wind. As the wind angle becomes more oblique, the height of deflected air is lower, and its velocity also decreases (as does the size of the vortex behind the median CTB).
Brown Pelican Flight
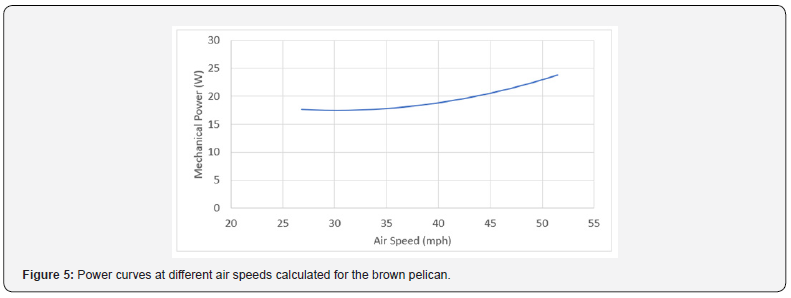
The models of Pennycuick [2] abstract bird flight into a series of equations that we used to understand the specific physiology of Brown Pelican flight. Figure 5 illustrates the output of the model when parameterized for the Brown Pelican. The model outputs an estimate of the amount of mechanical power required for flight at different airspeeds. Our interpretation of this graph is based on thinking about the mechanical power required for a Pelican to fly through strong headwinds. Ground speed is the speed of the bird relative to a fixed point on the ground. Airspeed is the speed of the bird relative to the air. Pennycuick’s models predict that Pelicans will have maximum mechanical efficiency (for normal horizontal flight) at air speeds of around 30 mph. Under zero wind conditions, maximum efficiency will, therefore, be achieved when both the groundspeed and airspeed are 30 mph (at zero wind ground speed equals airspeed). A small headwind of 5 mph will translate this 30 mph airspeed to a 25 mph ground speed. Following that, to make forward progress when flying into a headwind of 30 mph, a pelican will be required to generate an airspeed greater than 30 mph (therefore increasing the energy demands for flight). For example, for headwinds of 35 mph, the model predicts that the pelican will require an extra 15% more energy to attain a ground speed of 5 mph. To attain the same 5 mph ground speed against a 45 mph headwind, pelicans will require an air speed of 50 mph and a 36% increase in energy.
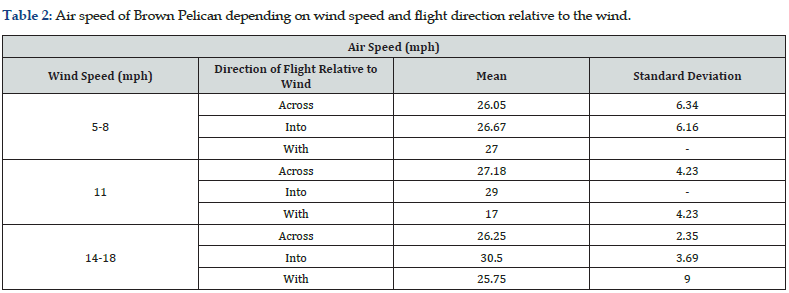
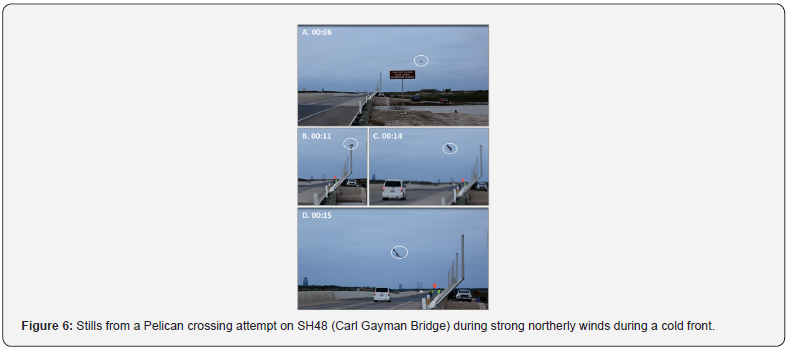
Schnell and Hellack [3] estimated the air speeds of pelicans engaged in horizontal flight to be between 17 and 35 mph, depending on the strength and direction of the wind under which measurements were made (Table 2). Hainsworth [4] also studied pelican flight and estimated that pelicans, flying low to the water (at a typical low flying altitude of 13 inches), require 49% less energy than birds flying at higher altitudes because of the ground effect. Figure 5 shows a series of stills taken from video recordings of pelicans attempting to fly across the Carl Gayman Bridge during a cold front, with sustained wind speeds and gusts of approximately 35 and 45 mph respectively (December 2016). In the last frame of these stills, the pelican abandons the crossing attempt by turning into the wind, and flying back toward the ship Channel. Using stills from this and other attempted crossing, we estimated the ground speed of birds to be between 1 and 5 mph (1.67 mph in this example) or an air speed of between 42 and 47 mph (assuming a 40 to 45 mph prevailing winds).
Taken together, we believe that Pennycuiks model, and the direct measurements of pelican flight under various flight conditions present a consistent view of the limits of Brown Pelican flight. Specifically, the results suggest that 35-45 mph headwinds may require considerable amounts of extra energy to navigate, and this will ultimately place an upper limit on the forward progress (measured as ground speed), and the length or duration of sustained flight, that pelicans can achieve ( note the difference between wind gusts referred to here compared to average daily wind conditions used in the statistical model) (Figure 6).
Conclusion
This paper presents a series of research methods useful for understanding why Brown Pelican mortality occurs on SH48. Based on qualitatively piecing together the independent results of this research, we provide the following explanation of this mortality: i. Pelican crossings on SH48 frequently occur because of the juxtaposition of the roadway, roost islands in the Bahia Grande, and the Brownsville Ship Channel. Crossings (and mortality) may be concentrated near the Carl Gayman Bridge and Channel because of the predisposition of birds to fly over water. Additionally, since pelicans often prefer to fly low over the water, the Carl Gayman channel may predispose them to attempt crossings at low altitudes.
ii. The strong northerly winds that occur during cold fronts create difficult flight conditions for pelicans that must fly into headwinds for reaching to safe roost sites. In these strong winds, video footage shows that birds have difficulty controlling flight, especially in gusts. The modeling study shows that such a flight is also energetically demanding. Any bird that is situated on the south side of SH48 when a storm occurs, must fly into strong, predominately northerly headwinds in order to reach the Bahia Grande roost site.
iii. SH48’s road infrastructure causes a stratification of air flow over the bridge. Pelicans attempting to cross the bridge will experience a range of wind conditions as they move horizontally across the road (from right to left in Figure 4). Pelicans attempting to cross at altitudes above 15 ft will experience fast-flowing air with a strong downward component as they move across the leeward lanes. If they struggle to maintain altitude during a crossing, there is a high risk that they will transition into a zone of much slower air, causing them to stall in flight.
iv. Vortices behind the CTB’s may greatly limit the ability of birds to resume flight and escape traffic. Video footage shows the vortices cause downed birds to be blown around on the road deck, further increasing increase the probability of a collision with passing traffic. The physical presence of the median windward barrier also effectively prevent birds from exiting the roadway on foot.
The research team considers that the mortality on SH48 occurs through interactions of these factors. Crash landings occur because of the interaction between high winds and road infrastructure. It is important to note that the pattern of airflow around the bridge (velocities relative to the input speed) does not change with wind velocity (at least for incompressible flow). Instead, we suggest that high wind speeds (at the limit of pelican flight) affect the ability of pelicans to safely traverse the bridge because they have less control over flight, must expend more energy during the flight, and are unable to respond to airflow patterns over the bridge. Additionally, mortality can only occur if pelicans regularly attempt crossings. We suggest the proximity of the road to roost sites (or vice versa) may be a contributing factor to the timing and magnitude of these mortality events, especially if the pelicans preferentially use these roost sites during storms. The propensity for pelicans to fly over water bodies, often at low altitudes may also influence the altitude at which crossings are undertaken, and therefore their exposure to disturbed air. Pelicans crossing at low altitudes run the risk of traversing into slower air streams and stalling in flight; and will have little time (or energy or control) to correct their flight if this happens.
Brown pelican mortality has occurred in the Laguna Madre region in the past, but we suggest that the reasons for this mortality, and the need for mitigation are subtly different to the SH48 case study. Owens and James [5] and Shafer et al. [6] studied pelican mortality on the Queen Isabella Causeway (QIC), which connects Port Isabel, TX to South Padre Island. Owens and James [5] studied this mortality through direct observation, and by testing 72:1 and 16:1 scale models of the QIC in a wind tunnel. As in our study, the authors concluded that a zone of turbulence and reversed flow occurred above the bridge deck up to a height of between 13.5 to 27 ft above the bridge deck. Based on these results, the authors suggested that pelican mortality on the bridge most likely occurs when birds misjudge the altitude they need to fly safely over zones of turbulent air, but there was no direct evidence of crash landings on the road surface. Similarly, Shafer et al. [6] documented brown pelican mortality and weather on the QIC between 1995 and 1997. They also observed that brown pelican mortalities appeared to be related to weather conditions (especially cold fronts), but did not employ a statistical model to assess this hypothesis formally, or to determine the most important weather variables. In both cases, there was no direct evidence for crash landings on the roadway, or the mass mortalities observed on SH48. Additionally, both studies were conducted at a time when the significant focus was on mitigation because the Brown Pelican was, at the time federally listed (the SH48 problem is probably better defined as an environmental, welfare and human safety problem). In contrast, during the course of this research, we have received video footage of Pelicans crash landing on a road close to Corpus Christi under conditions that more closely resemble SH48 (Beau Hardegree, U.S. Fish & Wildlife Service personnel communication).
We believe that documenting the SH48 mortality will be useful to researchers and practitioners dealing with wildlife-vehicle collision problems in general - not just pelican mortality. Pelican mortality is unlikely to become a major transportation problem, but the more general problem of road ecology and the impact of transportation on the environment and for human safety is of increasing concern to transportation engineers, ecologists and natural resource managers. Our experience studying Brown Pelican and other road ecology problems is that most are unique and cannot be defined by species, region or the particular societal problems they present (e.g., safety, environment). Accordingly, we suggest that researchers and practitioners will benefit from a detailed scientific research literature, with cases that describe specific problems, research tools that have been employed to determine causality, and ideas or strategies for mitigation. To this end, we suggest that some of the factors that cause SH48 mortality, and research techniques to understand the specific phenomenon, may also be broadly useful for other species. For example, CTB’s are a ubiquitous presence on bridges across the state, and our flight models and have the potential to cause issues for other large bodied birds, especially when roads bisect locations where such birds cross frequently and at low altitudes.. We also suggest that CFD may be a useful general tool for road ecologists (or other natural resource managers). CFD can be used for understanding the effects of transportation structures on air or water flow, and the research team is already working on other road ecology problems for which it may provide valuable insights.
Future Research
The research methods used in this study were performed largely independently, but when assembled qualitatively, they provide plausible explanations of when and why mortality occurs on SH48. However, there are still major gaps in our understanding of this pelican mortality, and these prevent the implementation of cost-effective mitigation. Specifically, the ZIP model (and other statistical models) suggest that environmental variables contribute to mortality. But the model we have described works only on daily estimates of these variables, wheres there is anecdotal evidence that cold fronts (and mortality) occur on finer temporal scales – during the hours that cold fronts move into a region. We are currently monitoring wind and temperature conditions on the bridge to test this idea, and developing models to more accurately predict conditions that predispose mortality. that the ZIP model also suggests that the ecology of the pelicans is also important factor in the mortality, and the research team is currently conducting GPS monitoring of pelicans in the region to determine their daily movements, and their seasonal population dynamics. We are also conducting additional CFD research into improving aerodynamics over the bridge by replacing the solid CTB with alternate bridge railing designs, and are developing more explicit flight models capable of simulating flight through the patterns of air predicted by CFD.
Acknowledgments
We thank the Texas Department of Transportation Environmental Affairs Natural Resource Management Section for providing funding. We also thank John Maresh, and Dr. Stirling Robertson for their support and reviewing a draft manuscript.
References
- https://Tidesandcurrents.Noaa.Gov/Tide_predictions.html.
- Pennycuick C (2008) Modelling the Flying Bird.
- Schnell GD, Hellack JJ (1978) Flight Speeds of Brown Pelicans, Chimney Swifts, and Other Birds. Bird-Banding 49(2): 108.
- Hainsworth FR (1988) Induced Drag Savings from Ground Effect and Formation Flight in Brown Pelicans. Journal of Experimental Biology 135(1): 431-444.
- Owens L, James R (1991) Mitigation of Traffic Mortality of Endangered Brown Pelicans on Coastal Bridges. Transportation Research Record 1312.
- Shafer M, Jasek D (1997) Evaluation of Innovative Monitoring Systems for the Queen Isabella Causeway to Assist in the Preservation of Endangered Brown Pelicans.


