Effect of System Reliability on Design of Metal Building Roof Purlins
Shahabeddin Torabian1*, Sanjay R Arwade2 and Benjamin W Schafer3
1Simpson Gumpertz & Heger, Inc.; Department of Civil and Systems Engineering, Johns Hopkins University, United States
2Department of Civil & Environmental Engineering, University of Massachusetts, United States
3Department of Civil and Systems Engineering, Johns Hopkins University, United States
Submission: March 14, 2023; Published: March 29, 2023
*Corresponding Author: Shahabeddin Torabian, Simpson Gumpertz & Heger, Inc.; Department of Civil and Systems Engineering, Johns Hopkins University, United States Email: torabian@jhu.edu
How to cite this article: Shahabeddin Torabian, Sanjay R Arwade and Benjamin W Schafer. Effect of System Reliability on Design of Metal Building Roof Purlins. Civil Eng Res J. 2023; 13(4): 555869. DOI 10.19080/CERJ.2023.13.555869
Abstract
This paper provides a framework to incorporate structural system reliability effects in the design of roof purlins in a typical metal building. Today, every roof purlin is considered as a separate component, and the effect of spatial variation in the demand loads and potential redistribution and load sharing in the roof system capacity is ignored in design. Component reliability is established by first-order reliability methods implemented through load and resistance factor design. Based on recent work in load-bearing cold-formed steel framing systems, the load and resistance factor design framework is extended from components to systems through an additional resistance factor to account for system influence. An archetypical metal building is designed and selected for this study. Monte Carlo simulations of a segment of the metal building roof are performed with consideration of both randomness in the demands and capacity and employing geometric and material nonlinearity in the response model of the roof. The simulations indicate that the system effect in metal building roofs is beneficial, and increases in the design capacity when evaluated against demands may be justified. Sensitivity to the target reliability (allowed probability of failure), deflection limits, and modeling assumptions are observed and discussed. Preliminary factors to account for roof system reliability are provided.
Keywords: Reliability; Metal buildings; Roof; Purlin; Monte Carlo
Introduction
In conventional metal building design, every component in the building employs a separate design check. If any component fails the design check, the component reliability governs the whole system design. One can readily consider a more involved framework. Engineers establish the desired system reliability (i.e., desired system failure probability), and the reliability of a component matters only insofar as it influences the system. One approach to realize this vision, that allows current workflows to largely continue, would be to embed the influence of the system within the engineer’s individual component checks - this approach is explored herein for metal buildings.
In today’s design framework (e.g., ASCE7-16 [1] for demand, AISI S100-16 [2] for capacity), component reliability, β, is established through first-order second-moment reliability methods implemented through load and resistance factor design, generally expressed as follows,

where φ is the resistance factor, Rn is the nominal strength of the component, c is a factor that converts load demand to load effect (axial force, moment, etc.) and can be understood as the Result of conducting a linear structural analysis, γ is the load combination effect (e.g., 1.2 in 1.2D), and  is the nominal demand (e.g., D). The component reliability, β, is established as follows,
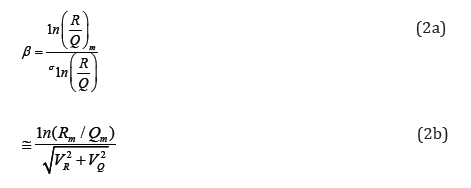
where R and Q are random variables, subscript m denotes mean, and σ standard deviation, Rm is the mean resistance, Qm is the mean demand (load) effect, VR is the coefficient of variation for the resistance, and VQ is the coefficient of variation for the load effect. The mean factors are connected to the nominal values in Eq. (1) by:

where M, F, and P are the material, fabrication, and professional factors where subscript m refers to their mean values, and B is the bias factors between the nominal loads and the mean load. For the case where demand = capacity, substituting Eq. (1) into Eq. (3) we can see that Rm may also be expressed as:

Eq. (5) shows that the resistance factor, ϕ, may be used to calibrate Rm and, as a result, β. Substitute Eq. (4) and (5) into (2b) for the direct expression.
For a system, a direct approach to calculating β becomes more complicated. While Eq. (2a) still holds, the resistance is now a function of a nonlinear analysis and the conversion from demand (D, L) to demand effect (force, moment) is also no longer linear. For an existing design, we seek a modification to Eq. (1) to account for this effect:

where ϕ and other variables are unchanged from before, but Rsys is a repetitive member factor accounts for the difference between component and (sub)system reliability. If failure of the component equates to failure of the system, then Rsys=1. If the system is “brittle” and system failure probability is generally higher than that for the individual component (such as the classic linked chain that fails when the weakest link fails), then Rsys<1, while if there is a beneficial system effect, for example, through load redistribution, then Rsys>1. The most straightforward approach is to select an Rsys and then use simulation to assess the statistics of the demand/capacity (R/Q) ratio for use in Eq. (2a).
This approach has been studied for floors framed with repetitively placed cold-formed steel joists [3-6]. For this system Rsys was found to be significantly greater than 1.0. A value of 1.25 was recommended from the analysis in [6], where it was assumed that the floor target reliability would be the same as the member component reliability (β=2.5). The source of the beneficial system effect included (a) excess component reliability through the use of the same member across the floor, (b) beneficial load redistribution from joist-to-joist under overload conditions, (c) beneficial decreases in the variation of the strength due to a large number of inter-connections between joists and sheathing which braces the joists, and (d) benefits from spatial variation in the demands. Note, wood design also uses a similar repetitive member factor of 1.15, which corresponds to a 15% increase in capacity [7].
Metal buildings could be designed as a whole system using analysis-based approach and abandon traditional component checks. This approach has been explored for steel building frames and racks [8-9]. While this is a promising long-term approach, in the near term, it is considered more likely that (a) only well-defined subsystems will leverage system reliability and (b) component checks will remain. Thus, the notion of the component level system reliability effect of Rsys in Eq. (6) is pursued here. For metal buildings, the roof purlin system is closest to the previously studied cold-formed steel framing floor system and is thus selected for the studies described herein.
It is worth noting that expectations for the benefit of system reliability are lower for metal building systems than typical coldformed steel framed building systems. Of the four system benefits observed in cold-formed steel floor systems, only two are likely for metal building roofs: beneficial load redistribution and spatial variation in the demands across the subsystem. Compared with cold-formed steel framed building roofs, metal building roof purlins have larger spacing, fewer and lighter inter-connects to sheathing, and are optimized member-by-member, bay-by-bay, across load cases in a manner different from cold-formed steel light frame construction.
Archetype Metal Building
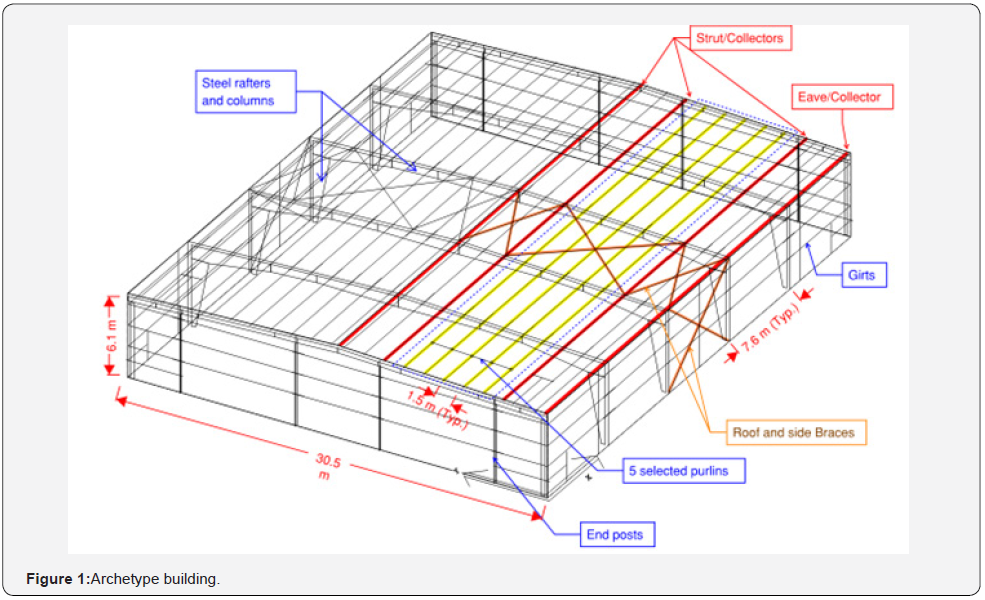
An archetype building was specifically designed for this study by a member of Metal Building Manufacturers Association (MBMA) [10]. This archetype building is focused on the roof and diaphragm. Frame members and lateral load resisting systems are not explicitly studied unless they have some effects, such as the strut forces in the roof.
The specifications of the archetype metal building are summarized below:
i. The building is 30.5 m (clear span) × 38.1 m (length) × 6.1 m (eave) with a 1:24 roof slope.
ii. Design loading is based on IBC-2018 [11], ASCE 7-16 [2], Risk Category II for the Washington D.C. geographical location.
iii. The frame spacing is 7.6 m, and purlins are continuous (lapped connections) over 5 bays of 7.6 m.
iv. The seismic force in the Washington D.C. area is SDC B, and it is all “R=3.0” systems for the moment and braced frames.
v. The LRFD method is used in the design.
vi. The roofing is a standard Through-Fastened Roof (TFR) with self-drilling screws, over purlin spacing of 1.5 m. Additional sub-purlins are placed in the corner zones for high wind uplift.
vii. Non-proprietary connections or clips are used.
viii. The longitudinal, lateral force resisting system is braced frames in two side-walls and roof-truss diaphragm. (Designated roof and side braces in Figure 1). All are designed as tension-only X-diagonals.
ix. Secondary framing, purlins, and girts are 216 mm deep Zee-sections, but with different thickness, as needed.
x. Pattern loads are not combined with wind, and seismic loads and the live load are applied as the uniform live load. The same assumption is true for the snow loads.
xi. End post spacing was increased slightly, to force wider strut space in the roof plane. As a result, there are 5 identical purlin lines between strut/collector lines.
Roof Model
The roof model in this study is a sub-model consisting of five purlins, along with cross-elements representing the through-fastened roof (TFR) and intermediate supports at the location of the frames. The numerical modeling has been performed in MASTAN 2 [12], and the pre-processing and post-processing has been done via a MASTAN batch file in MATLAB to enable Monte Carlo (MC) simulations.
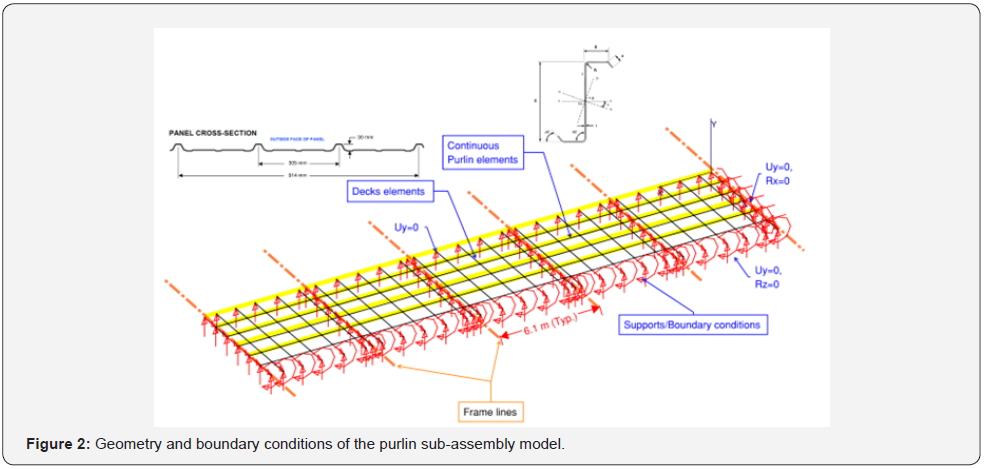
Figure 2 shows the geometry and boundary conditions of the purlin sub-assembly. The TFR passing over the purlins is also modeled to enable load redistribution between the purlins. The roof distributed loads are applied to the TFR. The TFR is modeled as beam elements connected to the purlins to transfer the loads. The hinge level of the purlins is set equal to their nominal capacity. Boundary conditions for the TFR are pin-roller, as indicated in Figure 2.
The “2nd-order Nonlinear” analysis module in MASTAN provides a load factor at which the displacements become very large, and the structure is thus unstable. The load factor calculated in MASTAN is the ratio of the reserve capacity of the system for the loads applied in the model. For an applied load, MASTAN’s load factor can be understood as a resistance-to-demand factor.
Purlin nominal capacity in the roof model
Figure 3 shows the purlin nominal flexural capacity along the length in positive and negative bending moments, extracted from the original beam design. The variable strength of the purlin along the length is due to different unbraced lengths and different thicknesses of the purlin along the length. The effect of lap splices at supports are also considered in flexural capacities, typically as double the capacity of the smaller cross-section.
Load combinations
For the simulations, we desire the mean demand, i.e. Eq. (4), not the nominal. The bias factors (B) are summarized in [13] and provided in Table 1. Accordingly, the design and mean load combinations in the analyses, including bias factors, are provided in Table 2.


Resistance variables
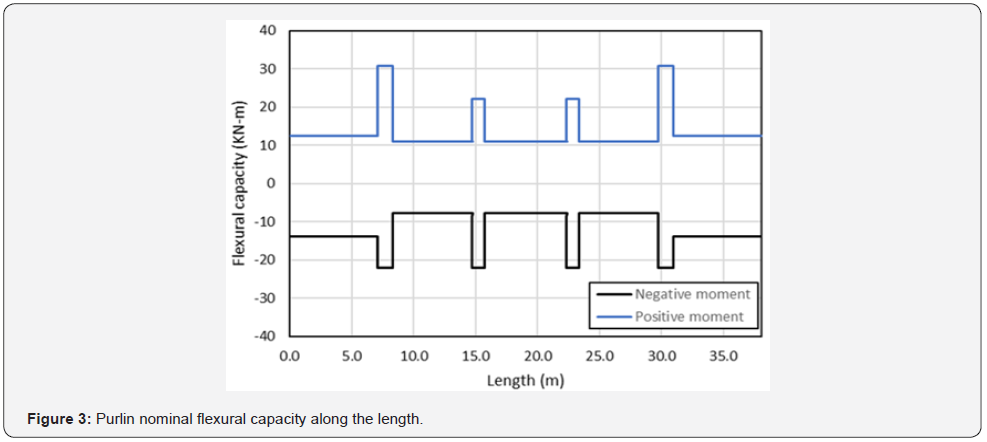
As shown in Figure 3, for positive and negative pressure design load combinations, the strength pattern along the length is different due to different moment distributions and different unbraced lengths of the purlins in positive and negative pressures. The nominal flexural capacity along the length are extracted from the original beam design. While the distribution of the capacity is assumed to be deterministic (not probabilistic), the purlin capacity in each bay and the connection region is assumed to be an independent random variable with the capacity equal to the nominal capacity multiplied by material (Mm), fabrication (Fm), and professional factors (Pm), equal to 1.1, 1.0, and 1.0, respectively, per AISI-S100-16 Chapter K [1], for cold-formed steel (CFS) flexural members. Accordingly, the mean capacity is 1.1 times the nominal capacity as follows:

The coefficient of variation (COV) for the resistance, VR, is estimated
to be 0.15  where COV of the material
and fabrication factors (VM and VF) are set per AISI-S100-16
Chapter K for flexural members [1], and variation in the professional
factor is estimated. Rm and VR are used to generate random
strength variables of each purlin along the length. The strength
of adjacent purlins is assumed to be independent, and also the
strength along the length of each purlin is segmentally independent,
including the splice region.
Load variables
To study the effect of spatial load variability, two different sets of load variables are considered. In the first set, the load pattern is considered a deterministic input, but the load magnitudes for each bay and each purlin are considered independent random variables. This analysis considers the spatial variability of the load on each bay and purlin. The second set assumes that the load pattern is not changing due to spatial variability and all bays and purlins are dependent variables, but the magnitude of loading on all bays and purlins is a random variable. In other words, the load pattern is not changing due to spatial variability, but the magnitude is changing. Load random variables for each load type are generated using the bias factor and a coefficient of variation in the literature, as described in the following sections.
Dead and live loads
Dead and live loads are uniformly distributed loads, but to include the spatial load variability in the first set, the load magnitude in the tributary area of each purlin is assumed to be an independent random variable. The distributed gravity loads are taken from a pool of random variables generated with the normal distribution for each analysis. For dead loads, a bias factor and a coefficient of variation of 1.05 and 0.10, respectively, are considered per [13]. For live loads, a bias factor and a coefficient of variation of 1.0 and 0.25, respectively, are used to generate random variables with the normal distribution. In the second set of load assumptions, the load pattern is always uniform, but the magnitude of dead and live loads are the only random variables. All other assumptions are similar to the first set.
Snow load
Per controlling design load combinations, the 2nd and 3rd bay of each purlin is subjected to 100% of the mean snow load, and the rest of the bays are subjected to 50% of the mean snow load. In the first set, there are five independent random loads for each beam, for a total of 25 independent random loading variables. A bias factor and a coefficient of variation of 0.82 and 0.26, respectively, per [13], is used to generate random variables with a normal distribution. In the second set, the only random variable is the magnitude of the snow load, and the pattern is similar to the first set. Accordingly, no spatial variability is included.
Wind load
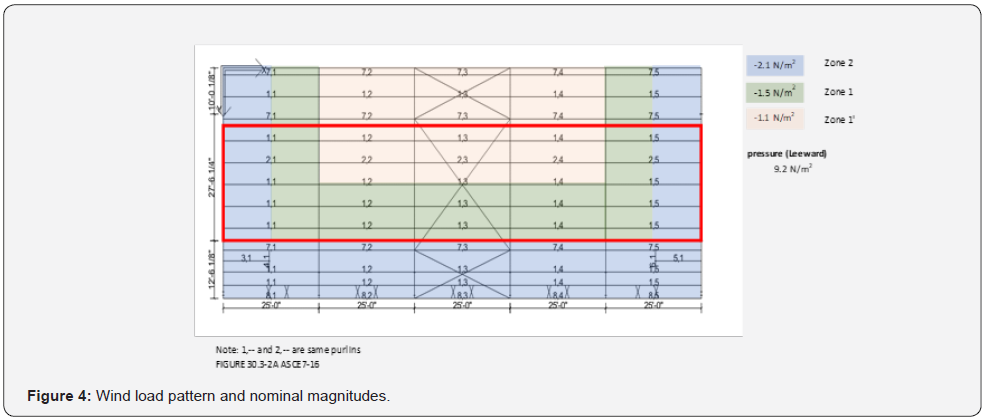
The wind load pattern is taken per ASCE 7-16 load patterns, as shown in Figure 4 [2]. The wind load pattern is taken as a deterministic input, but the magnitude of the wind pressure in each bay is a random variable in the first set. The wind bias factor for ASCE 7-10 is 0.575, and the coefficient of variation is 0.37 [2,13-14]. It is assumed that ASCE 7-16 has the same bias and standard deviation. For simplicity, the wind random variables are generated with a normal distribution. In the second set, the only random variable is the magnitude, and the wind pattern is similar to the first set.
Load summary
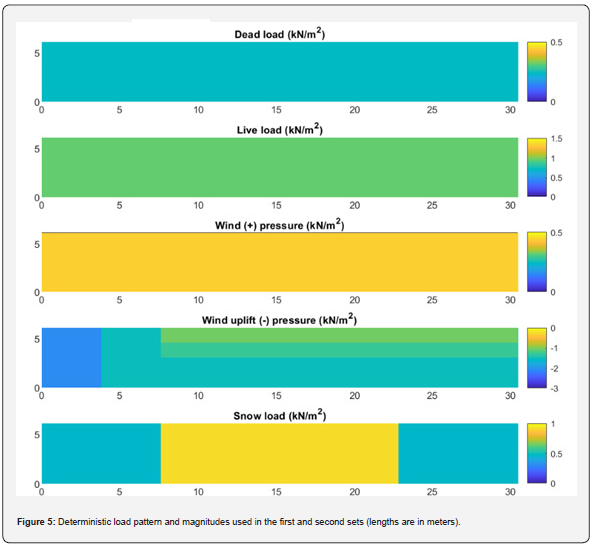
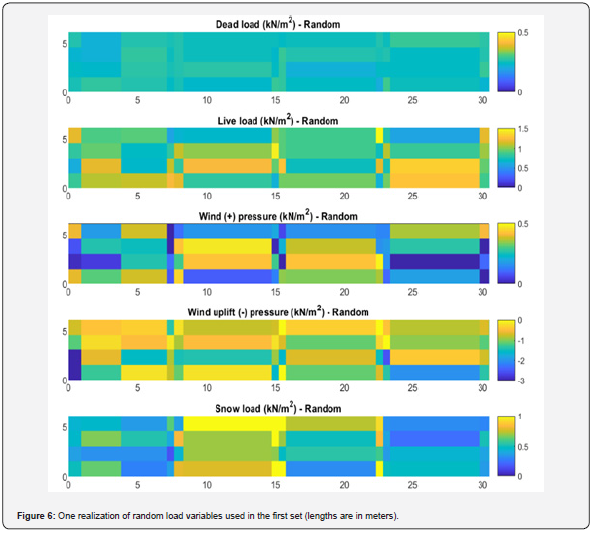
Figure 5 summarizes all the deterministic load patterns and magnitudes over the roof region under study. Figure 6 shows a single realization of the simulation for the same load patterns. All variables are generated with magnitudes following a normal distribution. As shown, the loading is variable for adjacent purlins and along each purlin. Each model in the MC analysis is subjected to a different realization of the random loads (similar to Figure 6), and averages across simulations converge to the original deterministic distributions (Figure 5). The first set uses a full spatial variability, as shown in Figure 6, but in the second set of analyses, the spatial variability is not considered, and the load magnitude is the only random variable.
Reliability analysis approach
The load effect, Q, and the resistance, R, are random variables, and the probability of exceeding a limit state assuming a lognormal distribution can be calculated as Eq. (2a), as follows,
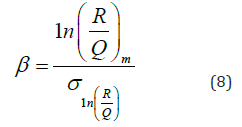
where, m refers to the mean and σ the standard deviation of the natural log of the resistance-to-load (R/Q) ratio.
The probability of failure can be calculated as follows [15].
This study considers a direct approach to addressing the system reliability of the roof purlins. This approach can be summarized in the following main steps:
Step 1: Generate independent random variables for resistance (R) of all purlins, including initial guess for Rsys
Step 2: Generate independent random variables for all applied loads (Q)
Step 3: Perform a series of 2nd-order nonlinear analyses and determine the R/Q ratios (or load factor in MASTAN) at which collapse or other performance criteria is met
Step 4: Calculate ln 
Step 5: Calculate the reliability factor β from Eq. (8)
Step 6: If β>βo, (where βo = target reliability) increase Rsys and go back to Step 1
To incorporate the system reliability effect on the member design, the initial Rsys factor is assumed to be 1.0 and if the reliability index (β) is larger than the target reliability index (typically βo=2.5 for members and systems), then the whole loop can be repeated with slightly higher Rsys as long as the increased Rsys results in reliability, β, which is not smaller than the target reliability index, βo. The number of random variable samples needs to be large enough to ensure the calculated logarithmic mean and logarithmic standard deviation of the results are stable with less than 1% error.
The selection of the target reliability requires judgment and consideration of past performance and practice. AISI S100-16 currently employs βo=2.5 for member limit states. ASCE 7-16 recommends βo =2.5 for “Failure that is not sudden and does not lead to widespread progression of damage” in a risk category I structure. For the work provided herein βo=2.5 is assumed.
Simplified Example
Before performing MC simulations, the merits of using the system reliability approach instead of the component reliability approach are studied using a simplified example as follows. Consider the following estimation of the reliability index for the roof under the uplift load combination. The applied load to the beam is an entirely uniform wind dominated unfactored load of 1.05D-0.575W. The load pattern is defined in Figure 5. The resistance of the purlins along the length is defined as 1.10 times the nominal capacity of the purlin, as shown in Figure 3.
MASTAN 2nd-order nonlinear analysis has been performed, and the resistance-to-load ratio is calculated to be 2.561 at collapse, as shown in Figure 7. The figure shows the location of the plastic hinges and the load factor at which the plastic hinge formed. Accordingly, the reliability index can be approximated from Eq. (2b) and calculated using VQ=0.31 [13], Rm/Qm =2.561, and VR=0.15.

The calculated system reliability is 2.73, which is larger than the target reliability index of 2.5, and therefore, it is expected that it may be possible to achieve a system reliability factor, Rsys, larger than 1.0. The Rsys factor is determined in the following section using a large number of models in MC simulations.
Monte carlo Simulations
Monte Carlo simulations have been performed following the steps explained in Section 5. To determine the minimum number of models required to get a stable standard deviation (STD) or Coefficient of Variation (COV) of the R/Q or load factors, a large number of simulations have been performed for one load combination. After about 100 simulations, COV and STD are stable and not changing with a higher number of simulations. To make sure that an adequate number of models are used in the simulations, 200 simulations are considered for each load combination.
Figure 8 shows the load factor (R/Q) distribution at collapse for different load cases and Rsys factors, changing between 1.0 and 1.35. The figure has summarized the results of the first set where spatial load variability is included. As expected, the average R/Q factors decrease as the Rsys factor is increased. The histograms of the R/Q distribution show less spread for the gravity dominated load case (1.2D+1.6L+0.5W), and more spread for snow and wind dominated load cases.

In the 2nd-order nonlinear simulations in MASTAN, there is a possibility that the model converges at extensive/unrealistic deformations. In these cases, it is required to limit the deformations to avoid unrealistic results. Accordingly, a deflection limit of L/40, which corresponds to about 1.25% total plastic hinge rotation, is considered. The 1.25% total plastic hinge rotation is generally achievable for cold-formed steel members (see [16] for more information) but is not the focus of this study.
Figure 9 shows the load factor (R/Q) distribution at collapse for different load cases and Rsys factors. The figure has summarized the results of the second set with no spatial load variability.
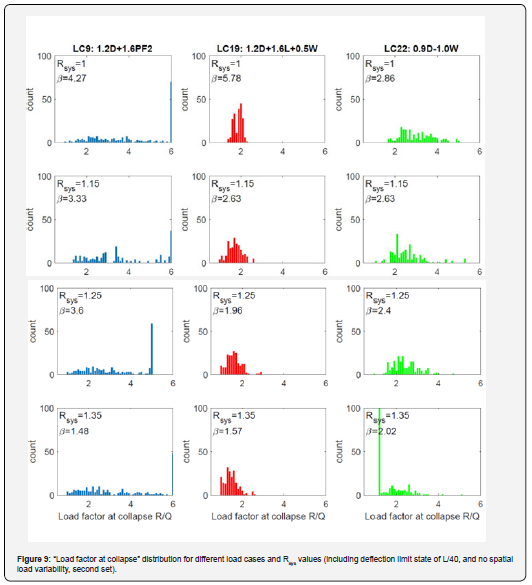
By assuming an equal likelihood of occurrence for each load combination, the combined probability of failure of the independent extreme events is a summation of the probability of failures of the independent events, as calculated in Table 3 for the first set and in Table 3 for the second set. The system reliability index, β, is calculated using Eq. (8); and the probability of failure Pf is calculated using Eq. (9).
If spatial load variability is considered, as in the first set, the results in Table 3 show that for Rsys=1.0, the system reliability index of 5.27 is significantly higher than the target reliability index of 2.5. This shows the potential merits of using the system reliability approach rather than the member reliability approach. By increasing Rsys to 1.25, the reliability index is still larger than the target index of 2.5. However, by increasing Rsys to 1.35, the reliability index is smaller than the target reliability index. It can be concluded that the strength of the purlins can be increased by 25% to account for the system reliability effect if spatial load variability is considered. As shown, design with a Rsys >1.25 results in failing to meet the target reliability index.
If spatial load variability is not considered, as in the second set, the results in Table 3 show that for Rsys=1.0, the system reliability index of 2.85 is higher than the target reliability index of 2.5. By increasing Rsys to 1.15, the reliability index is smaller than the target reliability index. It can be concluded that the strength of the purlins cannot be increased if no spatial load variability is considered. It should be noted that not having any spatial load variability is a conservative solution and provides lower-bound results.

Discussion
Adoption of an Rsys factor for use in design would require a careful definition of the “system” and ensuring that the system and the nonlinear load and response of the system were faithfully represented in the analysis justifying the selected Rsys. The preliminary analysis provided herein suggests that even though metal building system purlins are highly optimized to existing load cases and relatively sparsely spaced in the roof, it may benefit from system reliability.
The roof model employs plastic hinges for the purlins that assume elastic perfectly-plastic (EPP) response. Although total plastic rotations allowed are small, the EPP assumption is not strictly true. Further, the model does not capture out-of-plane demands that result as the purlins collapse and attempt to twist under load. Panel-to-purlin connections, which may limit the benefits of the roof panel under large deformations, are not considered in the developed model.
The use of independent random variables (even though mean-centered about the deterministic values) for the load magnitude may artificially increase the spatial variation. Given that a significant amount of the system reliability benefit derives from the manner in which the spatial load variation is considered correlated random variables or other more sophisticated treatments of the spatial load variation may be warranted.
The controlling load cases were selected from a large number of considered load cases through the use of conventional design. The impact of load cases not included in the final MC simulations remains unknown. Additional examination of the best methods to limit the number of considered load variation, but still capture the large number of load cases commonly considered in the design, is needed.
The single system analysis approach of Section 6 provided an estimated response similar to the more involved MC simulations with a single nominal collapse analysis. This suggests that simpler means to utilize load redistribution may be possible. If a single nonlinear collapse analysis was completed for every load case, this might be as useful as the MC simulations performed herein on a small number of load cases – further work in this regard is needed.
The scope of the provided study is limited in nature. Additional factors that may be useful to consider in future studies include: the impact of ASD vs. LRFD in the design selection, impact of the most up to date wind provisions from ASCE 7, further examination of the spatial variation of loads, and the sensitivity of any selected Rsys factors.
Summary and Conclusion
This study has provided an analytical approach to incorporate system reliability effects in the design of roof purlins in metal buildings. It is intended to reflect the system effects in a component design factor, namely Rsys, that can be used to increase the design capacity of the purlins. Based on an archetype metal building design, Monte Carlo simulations have been performed to study the reliability of a group of roof purlins connected via through-fastened profiled steel roof panels. The geometric and material nonlinear collapse analyses of the roof segment have been performed in MASTAN to find the ultimate resistance-to-capacity ratios, and the results have been used to calculate the reliability index for a group of five purlins designed with different Rsys factors. The results showed the beneficial effect of including system reliability effects in the design of the roof purlins. The Rsys factor is conservatively estimated to be about 1.15, which means a 15% increase in the purlin capacity in design. A deflection limit of L/40 was considered in the simulations, which corresponds to about 1.25% total plastic hinge deformation at failure. More studies are required to establish a path to evaluate the rotational capacity of the purlins and incorporate the nonlinear behavior of the connecting roof panels into the simulations. The results provided here can be interpreted as a proof of concept for the effect of system reliability on the design of steel roof purlins, but more research is required to provide an Rsys factor that reflects all characteristics of the actual roofing system.
Acknowledgment
This work was seeded by a small gift from the Metal Building Manufacturers Association (MBMA) and the American Iron and Steel Institute (AISI). A portion of the work was conducted through a contract with Simpson Gumpertz & Heger (SGH). Any opinions, findings, and conclusions or recommendations expressed in this publication are those of the authors and do not necessarily reflect the views of MBMA, AISI, or SGH.
References
- AISI-S100 (2016) North American Specification for the Design of Cold-Formed Steel Structural Members. American Iron and Steel Institute, Washington, DC ANSI/AISI-S100-16.
- ASCE/SEI 7(2016) Minimum design loads for buildings and other structures. ASCE/SEI 7-16. Reston, VA.
- Chatterjee A (2016) Structural system reliability with application to light steel-framed buildings. Ph.D. dissertation, Virginia Polytechnic Institute, Blacksburg, VA.
- Chatterjee A, Arwade SR, Schafer BW, Moen CD (2017) System reliability of floor diaphragms framed from cold-formed steel with wood sheathing. J Struct Eng 04017208.
- Smith BH, Arwade SR, Schafer BW, Moen CD (2016) Design component and system reliability in a low-rise cold-formed steel framed commercial building. Eng Struct 127: 434-446.
- Smith BH, Chatterjee A, Arwade SR, Moen CD, Schafer BW (2018) System Reliability Benefits of Repetitive Framing in Cold-Formed Steel Floor Systems. Journal of Structural Engineering 144(6): 04018061.
- AWC (American Wood Council) (2012) National design specifications for wood construction. ANSI/AWC NDS 2012, Leesburg, VA.
- Buonopane SG, Schafer BW (2006) Reliability Implications of Advanced Analysis in the Design of Steel Frames. ASCE, Journal of Structural Engineering 132(2): 267-276.
- Zhang H, Liu H, Ellingwood BR, Rasmussen KJR (2018) System Reliabilities of Planar Gravity Steel Frames Designed by the Inelastic Method in AISC 360-310. ASCE. J of Struct Eng 144(3): 04018011.
- MBMA (2019) Metal Building Archetype for Roof System Reliability Studies. (Private communication).
- (2018) International Code Council (ICC). International Building Code (IBC), Falls Church, Virginia, USA.
- Ziemian RD, McGuire W. MASTAN2, Version 3.5.
- Meimand VZ, Schafer BW (2014) Impact of load combinations on structural reliability determined from testing cold-formed steel components. Structural safety 48: 25-32.
- (2010) ASCE. Minimum design loads for buildings and other structures. ASCE/SEI 7-10, Reston, VA.
- Reliability in Biomechanics, First Edition. Ghias Kharmanda and Abdelkhalak El Hami. © ISTE Ltd 2016. Published by ISTE Ltd and John Wiley & Sons, Inc.
- Ayhan D, Schafer BW (2017) Characterization of in-plane backbone response of cold-formed steel beams. J Const Steel Res 132: 141-150.


