Phase Change Materials - An Opportunity
David W Yarbrough1* and Gary Gray2
1R&D Services, Inc., Watertown, TN, USA
2Syndego, LLC, Atlanta, GA, USA
Submission: January 12, 2023; Published: January 25, 2023
*Corresponding Author: David W Yarbrough, R&D Services, Inc., Watertown, TN, USA
How to cite this article:David W Yarbrough, Gary Gray. Phase Change Materials - An Opportunity. Civil Eng Res J. 2023; 13(4): 555867. DOI 10.19080/CERJ.2023.13.555867
Background
The discussion about to upfold involves ordinary materials and traditional physics. Phase changes, an important part of our existence, include rain, refrigeration and the production of ice, steam heating and power, and “dry” ice for packages that are commonplace examples of phenomena present in everyday life. Phase change materials also provide an opportunity for conserving energy used for the heating and cooling of buildings. If we forget about nuclear reactions, plasmas , and sub-atomic species, then we can think in terms of solids, liquids, and gases as being the three forms (or phases) of matter. A specific atomic or chemical species can exist in all three phases depending on the conditions. When a material changes from solid to liquid (melts), liquid to vapor (vaporizes), solid to vapor (sublimes), or liquid to solid (freezes), a “phase change” has occurred. This phase change is a “physical change” not a “chemical change”. There are phase changes in addition to those listed above that occur at a specific temperature for pure materials ( a pure material here means only one chemical species is present). When more than one chemical species is present (a mixture), then the phase change generally takes place over a range of temperatures. Pure ordinary water (H2O), for example melts (solid to liquid) at 32°F. Heavy water (D2O) melts at ~38.8°F while super-heavy water (T2O) melts at ~40.1 °F. In the case of a mixture of these “waters”, the phase change would take place over a temperature range from 32 to 40°F. The occurrence of heavy water or super-heavy water in a sample of water is rare so their impact is not noticed. This rather unusual example is intended to illustrate that a discussion of a phase-change material should include a description of the chemical composition.
The organic compounds commonly called paraffins include a more down-to-earth example of a useful phase change material (PCM) for controlling heat flow in buildings. The paraffin n-octadecane is often identified for use as a PCM for use in buildings. This is partly because the melting point for this compound is approximately 82°F, a temperature that is observed in the building envelope and the heat of fusion is 105 BTU/lbm. This means that a pound of n-octadecane will absorb 105 BTUs at a constant temperature of 82°F when it melts and discharges a like amount of energy when it freezes (or solidifies) at 82 °F. In order to provide some context for 105 BTUs, consider a section of wall with a thermal resistance (R-value) of 20 ft2 ∙h∙°F/BTU with a 40°F temperature difference between the outside surface and the inside surface. The heat flow rate would be 2 BTUs/hr per square foot. A PCM product containing ¼ lbm would store 26.25 BTUs as it melts, an amount of heat that would be transferred over a period of 13 hours for the stated conditions. It is not economical, however, to consider pure n-octadecane for use in the building envelope. An inexpensive grade of n-octadecane would most certainly contain compounds such as n-hexadecane, n-heptadecane, n-nonadecane, and n-eicosane that would create a temperature interval for the phase-change phenomena rather that a single temperature. The resulting heat effect would be determined by the composition of the mixture. Aqueous salt solutions often with two or more inorganic salts represent another useful class of PCMs that have melting points in the temperature range 50 to 122 °F and heats of fusion ranging from 40 to 115 BTU/lbm . Salt solutions have an obvious advantage of being non-combustible. Syndego PCM, for example, is an aqueous salt solution that changes from solid to liquid over the temperature range 74 to 88 °F with a heat effect of 53 Btu/lbm (48 Btu/ft2) for the PCM product (PCM material and containment material).
Keywords: Phase Change Materials; PCM; Heat of Fusion; Energy Storage
Introduction
The Heat Effect for the Liquid↔Solid Phase Change
PCM materials of all types have a common desirable property; they absorb (charge) or desorb (discharge) heat at a constant temperature or over a relatively small temperature range, usually a few degrees Fahrenheit. This means that they can be used to direct the flow of energy across the building envelope to reduce the heating or cooling required to maintain a comfortable indoor environment. In addition, the time at which the maximum heat flow occurs can be shifted and the magnitude of the maximum can be reduced (peak load reduction and shift). The concept of energy (or heat) storage in massive building materials like stone or concrete has been widely utilized for centuries. There is a dramatic difference between storing heat in a heavy concrete wall and storing heat in a small amount of PCM. Using a Δh=100 BTU/ft2 (100 BTUs required to melt the PCM in one square foot of building enclosure) and 0.20 BTU/lbm∙°F for the specific heat of concrete at density 120 lbm/ft3, an equivalence between the melting of the PCM and the heating of a six-inch thick concrete slab can be calculated. As a basis, consider the installation of sufficient PCM to absorb 100 Btus per square foot of wall to change phase. The PCM will absorb 100 Btus while melting at a constant or near constant temperature. One square foot of the concrete wall described above without PCM will increase 8.32 °F in absorbing 100 BTUs. (Mass of wall: 60 lbm, temperature change 8.32 °F. (Δh = m∙cp∙ΔT = 60 ∙0.2∙ 8.32 ≈100) . The entire 60 lbm of concrete would increase by over 8 degrees as a result of absorbing 100 BTUs. The installation to provide 100 Btu/ft2 can be accomplished by adjusting the amount of PCM present in one square foot of product.
PCMs are used in the building envelope to reduce the utility load for heating and cooling by absorbing and desorbing heat from the PCM. When used in cooling dominated climates the PCM is applied in a way that favors rejection of heat to the outside air. In heating dominated climates the PCM is applied in a way that favors rejection of heat to the interior of the building. The presence of PCM in the building envelope can be applied to shift the time at which the demand for electrical power is a maximum (the time of day of the peak use) and reduce the peak load. Reduction in the peak load benefits the home or building owner. A shift in the peak load and reduction in the peak load benefits the Utility and when time of day utility pricing is in effect, the consumer also benefits from the peak load shift.
PCM applications are divided into two distinct groups, distributed or localized PCM. As the words suggest, distributed applications involve PCM mixed with another building material. Examples of this are: Insulation: PCM mixtures, drywall: PCM, or concrete: PCM. This type of use often underutilizes the PCM since regions with PCM that don’t cycle through the phase change temperature region can occur. On the positive side, distributed systems usually have some portion of the installed PCM being utilized. Localized application when positioned properly can be 100% or near 100% utilized. If not positioned properly, however, the that may not pass through the phase-change temperature region in which case it is not effective. The cycling of temperature in the building enclosure is driven by the changing exterior air temperature (the daily weather cycles). It is also possible to provide some assist to the PCM cycling by varying the interior setpoint temperature on a daily schedule. The objective is to have temperatures cycling through the phase-change region in order to charge and discharge heat from the PCM.
Benefits of PCM in Buildings
a. Reduction in building energy use
b. Reduction in peak load
c. Shift in the time when peak loads occur
d. Reduction in HVAC equipment sizing
PCM use is being considered in some cases for use with airhandling systems or hot water distribution systems.
Thermodynamic Basis for PCM Performance
The overall heat effect, Δh (Btu/lbm ) when a PCM absorbs energy and changes from temperature T1 < TmL to a temperature T2 > TmU is given by Equation 1 for the solid-to-liquid phase change. The phase change contribution in this case is Δhfusion(Tml,Tmu) where Tml to Tmu is the temperature interval in which the phase change occurs. The phase change from liquid-to-solid (freezing) has Δh = -Δhfusion.

The heat effect for “m” pounds of PCM is

There are three terms on the right side of Equation 1a. The temperature TmL denotes the beginning of the phase-change region while TmU represents the end of the phase-change region. When T < TmL, the PCM is a solid, while the material is a liquid when T > TmU . The material undergoes phase change in the temperature interval TmL < T < TmU.
The heat of fusion in Equation (1a) is usually much larger than the two sensible heat terms unless the temperatures T1 and/ or T2 are significantly different from TmL or TmU. In many cases, the phase change takes place over a temperature interval that depends on the chemical composition. When phase change is absent, the “sensible” heat change is

where x identifies the phase (solid or liquid). The mass of material is represented by “m” and c is the specific heat in Btu/lbm ∙ °F. When a phase change material is enclosed or encapsulated, there is an additional heat storge term related to the enclosing material. Laboratory tests exist for evaluation of the thermal properties of phase change material alone or PCM with enclosing material. The technique known as “differential scanning calorimetry” is useful for evaluating a small specimen of phase change material while the test method described in ASTM C1784 is used to evaluate a phase change product. The enclosure material is generally included in the C1784 test [1].
Figure 1 is an example of a curve showing how H (the enthalpy or in this case the heat content) increases as the temperature increases. The phase change region in the example extends from 70 to 87.5 °F. The product is a solid below 70 °F. The curve in Figure 1 is for a specimen being heated. The curve for cooling is often above the heating curve in the phase change region.
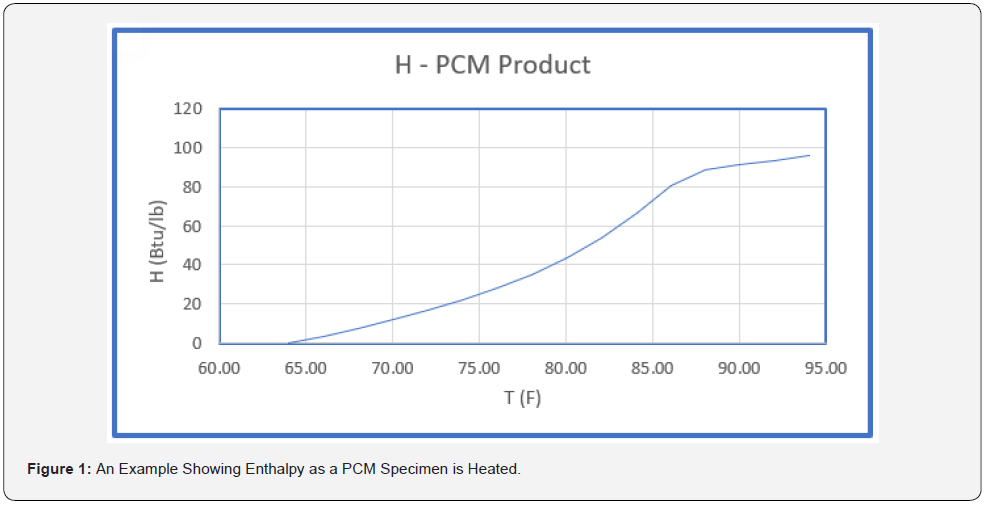
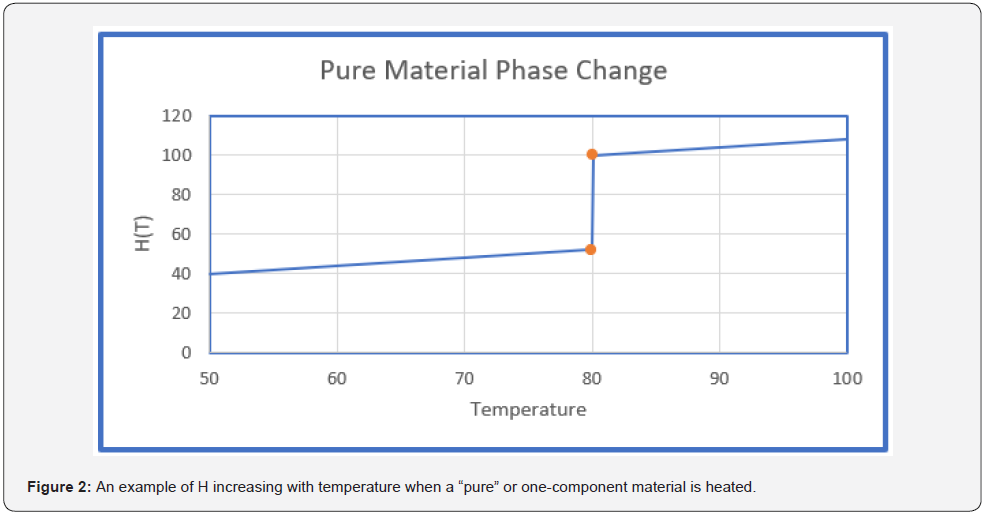
Figure 2 shows the same type of data as Figure 1 except that in Figure 2 the material is single component or pure. The phase change region in this case is a single temperature. Laboratory results are often reported in terms of Btu per pound of PCM or Btu per pound of product. The useful metric for PCM products is BTU/ft2. The area term is taken to be perpendicular to the heatflow direction. When data are provided with units Btu/lbm then Equation 3 can provide Btu/ft2.

Equation 3 is useful since a manufacturer can control the amount of phase change material in a product (lbm/ft2). When there is enclosure material, the adjustment includes the thermal properties of the enclosure material.
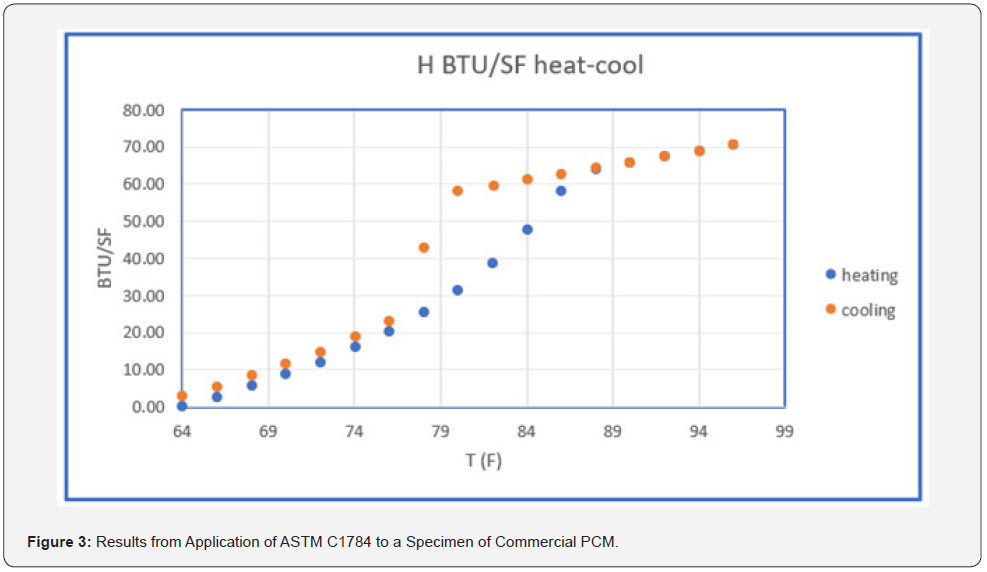
Figure 3 contains results obtained with a typical phase change product PCM [2] obtained using the ASTM Standard Test Method C1784 to obtain H(T) with units Btu/ft2 . There are two sets of data in Figure 3. The lower set of data points were obtained as the test specimen was heated from 64 to 96°F (melting curve) while the upper (freezing curve) starts at 96°F and cools to 64°F. The H values are based on H(64) = 0. The heating or melting curve and cooling or freezing curve do not coincide in the phase change region from 74 to 88°F. This is at least partly due to the process of obtaining the data using relatively small times between the data points. The process of freezing (creating a crystalline structure) is more complex than melting (destroying the crystalline structure). The test method represents a compromise between the time for the freezing process to take place and the test equipment parameters for determining steady-state conditions. The design of the phase change material contains additives to assist the crystallization process. The ΔH between 74 and 88°F obtained from the two data sets is within the measurement uncertainty (they are basically the same, 48 Btu/ft2 ). C1784 provides the heat storage value for the product. The thermal data obtained using C1784 is an important characterization of the product being the heat storage available and the temperature over which it is obtained.
PCM Applications Impact Heat Flow
PCMs are most commonly installed in the building enclosure. The positioning of the PCM is important since the location selected must be subject to temperature cycling in order to change and discharge heat. Cycling means that the temperature at the location of the PCM must periodically pass through the phase change temperature interval. The following is an example of performance that can be anticipated from a PCM application. The period of time, t, that a localized PCM can interrupt heat flow across an element of building enclosure is a useful metric for PCMs. Consider a wall with surface-to-PCM resistance of R (ft2∙h∙°F/Btu) and temperature difference ΔT (°F) between the outside surface and the PCM. The minimum time, tmin, can be calculated for m (Btu/ft2) required to achieve complete change of phase by Equation 4.

The following contains tmin for m=10, a relatively small amount of PCM properly positioned can interrupt heat flow for a major part of the daily 24-hour cycle. The minimum time in this case is the period required to move through the phase change region. The PCM changes for all solid to all liquid. The value for tmin is increased if there is heat exchange between the localized PCM and the interior side of the envelope. This example is included to show that analysis to determine the amount and positioning of PCM needs to be undertaken for local weather conditions. It should be clear that with a modest amount of analysis a PCM application can be designed to reduce, interrupt, and direct heat flow for extended periods. This is done by adjusting the thermal resistance values in the heat flow path and the amount of PCM installed.
The Design of a PCM Application
A primary consideration for the design or placement of a PCM product is location in the building enclosure. The location will generally be such that there is thermal resistance on both sides of the PCM product. Figure 4 contains a schematic of such an assembly that could be used in ceilings, walls, or floors. The location of the PCM depends partly on geographical location and the climate. In heating dominated climates, the PCM is likely to have less thermal resistance on the interior side than on the exterior side of the product. This is to support discharge of heat from the PCM to the interior. The opposite is true is cooling dominated climates where the PCM is place with less thermal resistance on the exterior side to discharge heat to the exterior transfer. The position of the PCM in the building enclosure impacts the energy savings that can be achieved. Consideration is also given to shifting the time and magnitude of peak loads.
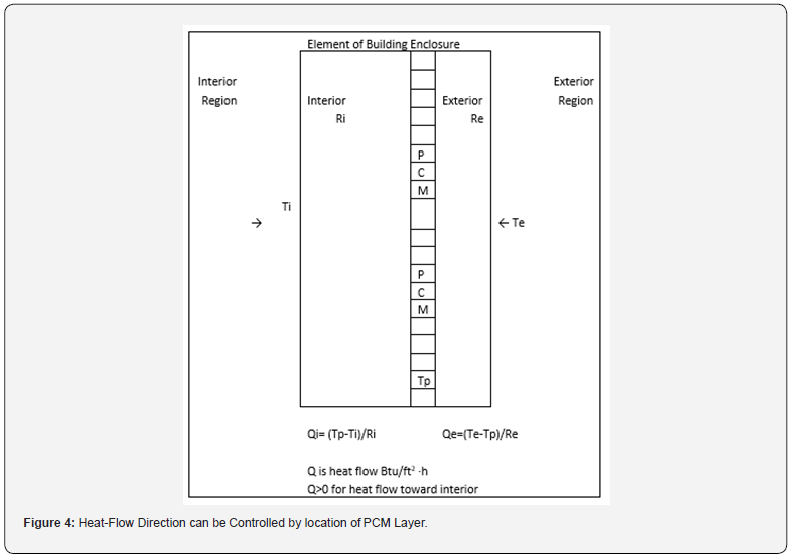
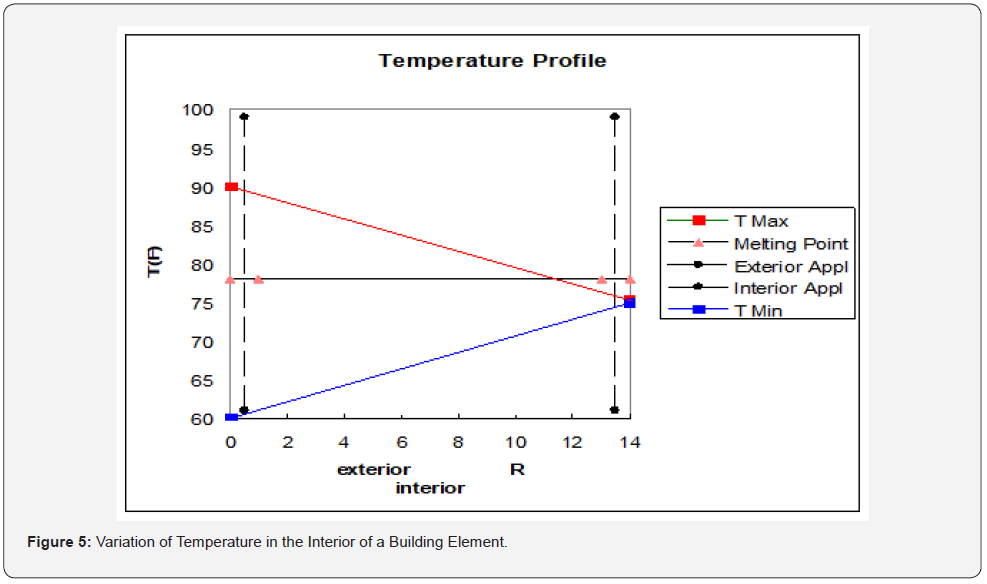
The design of the PCM application involves specification (or determination) of Ri and Re. In practice a major part or perhaps all of the two resistances are provided by existing insulation and building materials. The amount of PCM is the second term to be specified. The equations for heat flux to the interior and heat flux to the exterior, Qi and Qe, are included in Figure 4. If the purpose of the PCM is primarily to conserve heat, then Ri will be small and Re will be large. The opposite will be the case if the primary purpose is reduction in cooling load (discharge of heat to the exterior). The selection of the PCM will identify the appropriate value for Tp. The selection of Ri and Re are further discussed by the lines in Figure 5. The diagonal lines in Figure 5 represent the steady-state temperature profile in the section of building enclosure under consideration. The lines intersect at the temperature maintained by the HVAC system.
In Figure 5, the exterior surface cycles between 60 and 90 °F while interior is maintained at 75 °F. The phase-change temperature in the diagram is 78 °F (indicated by the .horizontal line with small triangles). An interior PCM application is located at R=13.5 (cavity side of the interior sheathing) while an exterior application is proposed for R=0.5 (cavity side of exterior sheathing). The maximum variation of temperature for the application is the region between the T Max line (red) and the T Min line (blue). The temperature variation for the interior application (R=13.5) does not include the PCM melting point line. There will be no charging or discharging of the PCM. The exterior application located at R=0.5 has temperature variation that includes the PCM melting point line. Charging and discharging of the PCM can occur on the exterior side of the wall. The diagram is designed to show if a phase change will occur. If a phase change is initiated, then the temperature profile changes. This example shows a limitation of a localized PCM application. A poorly chosen location can result is failure of the PCM to perform any useful function. An appropriate PCM location can be determined from an examination of climate data for the geographical location. The diagram in Figure 5 can be manipulated by input of data for T Max, T Min, Melting Point, and the location of the PCM.


There are two levels of design for a PCM application:
a. Material selection and packaging for long term durability and consistent thermal performance.
b. Positioning of PCM in the building envelope for optimal or at least measurable performance.
The first bullet is the responsibility of the manufacturer. The second bullet is the responsibility of the building designer. The use of PCM in tract houses or manufactured homes is especially attractive since there will be a number of units with the same or similar design. This reduces the time needed to “engineer” placement and amount of PCM to be used.
Utilizing an Enclosed Reflective Air Space
PCM enclosure material with a low-emittance surface material (aluminum) is an important feature of SydegoPCM products. The PCM sheets that form pouches the inorganic salt solution can be installed to provide enclosed reflective air spaces. Enclosed air spaces with one or more low-emittance (highreflectance) surfaces perpendicular to the heat-flow direction provide reflective insulation that provides thermal resistance (R-value). Reflective insulation belongs to the family of air-based thermal insulation materials. Air has a relatively low thermal conductivity (high thermal resistivity) that is the basis of the thermal resistance of insulations such as fiberglass, cellulose, rock wool, or particulates like perlite. In these type insulations, air is the insulation. The fibers or particles prevent air movement that would result in convective heat transport and reduction of radiative heat transfer. Reflective insulations reduce radiate heat transfer to near zero but allow convection in many cases. PCMs provides an unusual opportunity when installed in the path of vertical or near vertical heat flow. This occurs, for example, in attic floor applications, below roof deck, and below floors. There is a significance difference in the magnitude of an enclosed reflective air space when the heat flow direction is changed from downward to upward. This illustrated in Table 2 for a 3.5-inch air space with a panel of PCM forms one surface in the enclosure perpendicular to the heat-flow direction. The R-value numbers in Table 2 are for an average air-space temperature of 75 °F and a temperature difference of 15 or 25 °F. A space with a significant change in thermal resistance due to an external condition (such as temperature) is called a thermal switch.
Using the data in Table 2 as an example, the most favorable thermal switch occurs for vertical heat flow (up and down). Two cases are shown in Table 2: exterior variation 60 to 90 °F (red font) and exterior variation 50 to 100 °F (blue font). The air space R changes by 7.22 R-units in the first case and 7.00 R-units in case 2. As an example of the significance of the switch in R value consider an application in a cooling dominated climate with PCM in the roof or attic region. During the day, the heat flow direction is downward and the thermal resistance of the enclosed reflective air space that is part of the PCM application is large. This opposes the transfer of heat into the conditioned space. As the exterior temperature changes, the heat flow direction changes and the thermal resistance of the enclosed reflective air space becomes small. This assists the movement of heat toward the exterior. The PCM discharges heat to the surrounding. This is an example of the added feature of PCM with low-emittance surface material. Thermal resistances for enclosed air spaces like those in Table 2 can be calculated for a wide range of orientations, dimensions, and temperatures.
What about Savings
The previous section introduced the initial equations for determining heat flow between a PCM application and the adjacent interior and exterior boundaries. The exterior temperature varies with time. This means that a series of calculations perhaps for one hour or quarter-hour segments is undertaken to establish total heat flows in and out of the condition space for a specific application. Weather data for the location provides the needed temperature data for the evaluation. A thorough evaluation involves use of a typical year of data for the location of interest. The calculation of heat flow with and without the presence of the PCM layer provides the anticipated reduction in heat gain and heat loss due to the PCM application. The inclusion of the reflective air space is an additional benefit of the annual modeling exercise. The annual calculation can be performed with and without the presence of the reflective airspace thermal resistance.
Summary
This paper has described the purpose of PCM in the building enclosure and factors that impact the savings potential. The thermodynamic data needed to evaluate performance, specifically savings in thermal load are readily determined. The engineering calculations are straightforward but tedious since annual evaluations are the norm. The added benefit of an adjacent enclosed reflective air space has been described for vertical or near vertical heat flow situations. A comprehensive review on this subject has been published by Kosny et al. [4].
References
- ASTM C1784-20 (2021) Standard Test Method for Using a Heat Flow Meter Apparatus for Measuring Thermal Storage Properties of Phase Change Materials and Products. Annual Book of ASTM Standards, pp. 1144-1161.
- Syndego, LLC Phase Change Material, Atlanta, GA, USA.
- Yam KW, Khar San The, Loi P, Yarbrough DW (2020) Reflective Insulation for Above Ceiling Applications. J of Building Physics 44(3): 272-283.
- Kosny J, Miller WA, Yarbrough D, Kossecka E, Biswas K (2020) Application of Phase Change Materials and Conventional Thermal Mass for Control of Roof-Generated Cooling Loads. Applied Sciences 2020(10): 6875.


