Fragility-Based Flood Risk Modeling to Quantify the Effect of Policy Change on Losses at the Community Level
Omar M. Nofal* and John W. van de Lindt
Department of Civil and Environmental Engineering, Colorado State University, USA
Submission:April 22, 2021; Published:June 08, 2021
*Corresponding Author:Omar M. Nofal, Center for Risk-Based Community Resilience Planning, Department of Civil and Environmental Engineering, Colorado State University, Fort Collins, CO, USA
How to cite this article: Omar M. Nofal, John W. van de Lindt. Fragility-Based Flood Risk Modeling to Quantify the Effect of Policy Change on Losses at the Community Level. Civil Eng Res J. 2021; 11(5): 555822. DOI 10.19080/CERJ.2021.11.555822
Abstract
Flooding is a devastating natural hazard whose consequences include loss of life, and damage to community infrastructure, with even further impacts resulting from interdependencies of physical and non-physical systems. Flood risk prediction is a critical component of a comprehensive risk-informed decision framework and is used in combination with information on community resilience planning strategies, flood impacts, and recovery. In this research, a physics-based flood risk model was developed to determine flood hazard characteristics and their corresponding level of damage at the community level. Fragility functions for the impacted buildings from an extensive past field study were used to capture the effect of policy change in terms of increasing first-floor elevation on flood losses to the building stock in the illustrative example community. The unique point about this study is overcoming the flood-related data scarcity by considering different resources, models, and modern technology using Google Street Map View to collect buildings information. In addition to, the algorithm that was developed to handle the spatial characteristics of these data. Therefore, the provided framework can provide policymakers the ability to explore the financial effect of policy changes and allow them to better mitigate flood risk and increase the community resiliency.
Introduction
Floods are one of the costliest yet also the most common natural disasters in the United States, claiming lives, disrupting businesses, straining the financial agencies that respond, often leaving cities destroyed with families being dislocated for days, months, and sometime never to return. The U.S. financial losses due to flood are estimated to be $2.4 billion annually which is more than 75% of the losses for all federal disasters [1]. Hence, flood risk prediction with the goal of studying the impact of the policy change on the total loss of a community is a prospect research point for future resilient communities that could ultimately absorb strong flood events and easily get recovered from them. There are different techniques to avoid flood damage at building level [2] including water avoidance [3], water exclusion [4], and water entry [5]. Building first-floor elevation (FFE) is controlled by the community policy of issuing new permits. Therefore, if the policy is changed for the sake of increasing FFE in the flood-prone area, the amount of the expected flood losses will be ultimately decreased. However, the current advances in the flood risk mitigation policies and guidelines [6-8] including the elevation increase for the buildings within the flood plain, the feasibility of these guidelines and the impacts of these policies on the total flood losses in monetary terms are not confirmed. Additionally, the flood-related data scarcity always makes the flood loss analysis process more difficult as it needs different types of data from different resources to capture accurate results.
In this research, the residential buildings within the city of Lumberton, NC were chosen as a testbed to investigate the impact of policy change in terms of elevating the first-floor elevation on the total buildings flood losses along with their consequences on the overall community losses. The flood losses were calculated based on 2016 Hurricane Matthew which drove a strong rainfall event that impacted a wide part of the city. The rainfall data were collected from NOAA [9] and the discharge data were collected from USGS [10]. The exposure information was collected based on navigation through Google Street Map View across the whole community. The buildings vulnerability in terms of empirical fragility functions were collected from the Lumberton field study [11]. Then, hydrologic and hydrodynamic models were developed to capture the spatial distribution of the flood hazard characteristics across this community. The flood hazard information was then combined with the exposure information and buildings fragility functions in a GIS environment. Then, different flood loss scenarios based on different FFE for the buildings on the flood plain were investigated to capture the relationship between flood losses at a community level and the policy change in terms of increasing the FFE of the impacted buildings located on the flood plain.
From Hazard to Risk
Flood hazard is the probability of a certain flood event to occur with a certain frequency. Flood risk is the probability of physical damage to occur due to a certain flood event. Flood hazard mitigation methods usually control or reduce the hazard frequency by building flood levees, gates, barriers, and exits [12]. On the other hand, flood risk mitigation plans control the hazard frequency, the exposure characteristics, and the vulnerability of community components. Therefore, flood hazard characteristics and their intensities are not enough to give inferences or indices about the flood consequences. Other information about community exposure and the susceptibility of its components are still needed. To that end, flood risk mitigation plans encompass different levels of mitigations starting from the community level to building level mitigation. That is why the current research trend of flood mitigation policies is shifting from hazard level mitigations to risk level mitigations. Consequently, this research will tackle a building level flood mitigation strategy to capture its impact on the overall community losses.
Case Study: Lumberton, NC
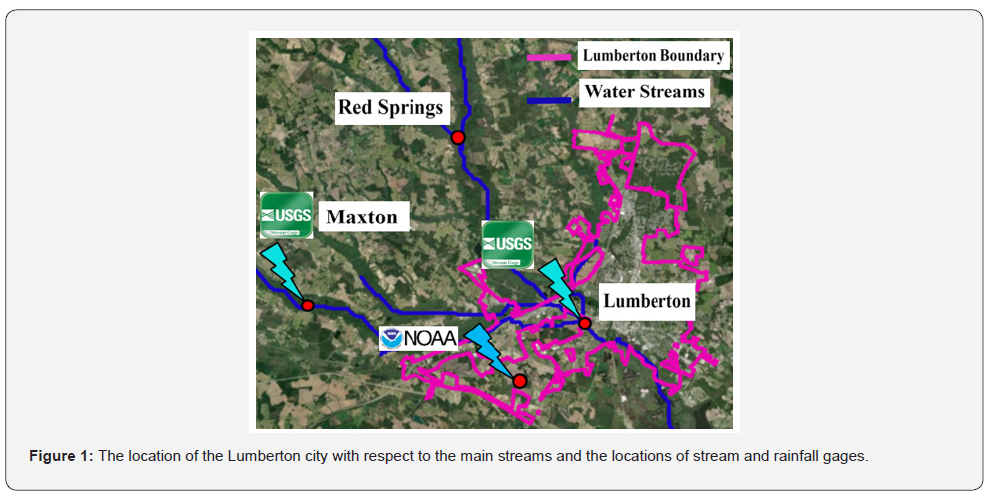
Lumberton, NC was selected to be the case study for this research to leverage the on-going longitudinal field study in progress as part of the Center of Risk-Based Community Resilience Planning at Colorado State University. Also, the cascading flood events that impacted this city in the last three years (Matthew 2016, and Florence 2018) made it a perfect case study for future researches related to flood risk and recovery. (Figure 1) shows a map for the city of Lumberton that shows the location of the city with its boundaries in magenta color.
Flood Risk Assessment Methodology
Using the rainfall information provided by NOAA [9], a hydrologic analysis study was conducted to predict the mainstream discharges that deliver the water to the study area. This calculated discharges in the mainstreams were numerically calibrated with the available observed one provided by USGS [10]. The location of these gages is fully illustrated in (Figure 1). Then, a hydrodynamic analysis was conducted using the finite difference method to solve the unsteady full momentum 2D Saint-Venant flow equations for a predefined domain with 150×150 mesh size. The resulted discharges in the mainstreams from the hydrodynamic analysis were used as boundary conditions for this domain. The hydrodynamic analysis enabled capturing the spatial distribution of the flood hazard characteristics including water depth and velocity.
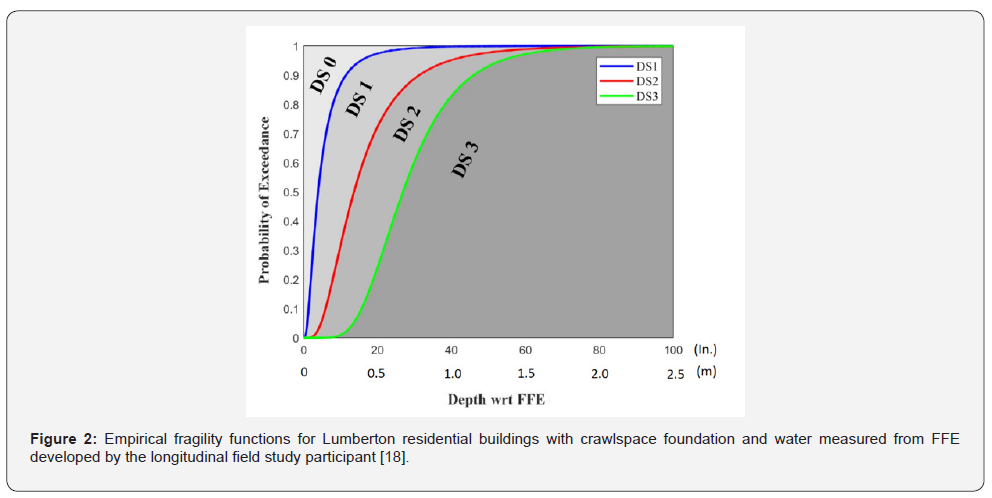
The exposure information of the residential community of Lumberton was collected using Google Street Map View to accurately capture the different building characteristics including building archetype, occupancy, number of stories, foundation type (slab on grade, and crawlspace), and qualitative assessment of the building maintenance (fair, good, well maintained). Then, this information was overlayed with the hazard characteristics information in a GIS environment to capture the flood hazard characteristics at each building. Then, fragility functions developed from past extensive longitudinal field study for the Lumberton area was used to predict the probability of exceedance of a certain predefined damage state. The readers are referred to [11] for more information about the damage states and the procedures used to develop these fragilities. (Figure 2) shows a fragility function for a building with a crawlspace foundation and the flood water level measured from FFE. The replacement value for each damage state in this fragility function was calculated based on HAZUS flood loss estimation for each building subassembly [13] to capture flood loss in monetary terms. Then, different first-floor elevations for the impacted buildings was used as a tool for policy change to capture the corresponding changes in the flood losses.
Results
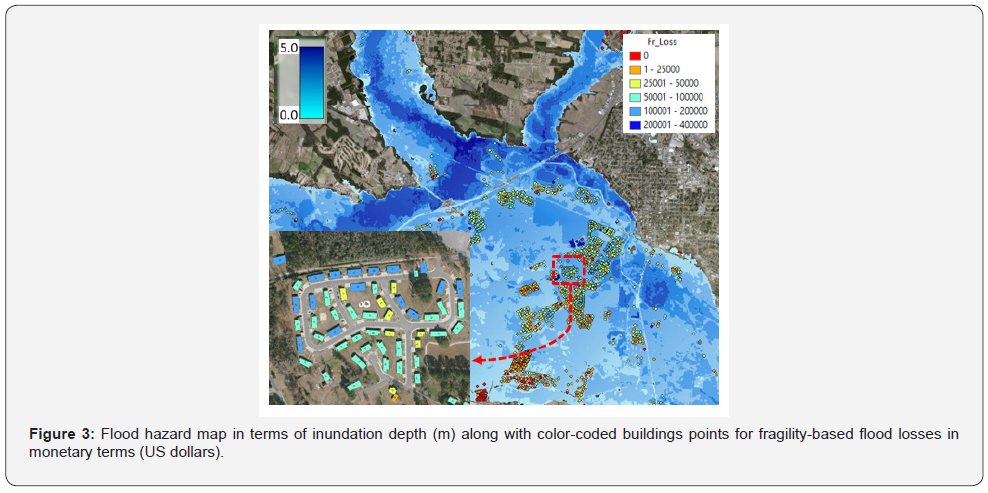
In this section, flood losses to residential buildings only will be presented for simplicity. The flood loss analysis started by hydrologic and hydrodynamic analysis of the 2016 Hurricane Matthew rainfall event which enabled capturing the spatial distribution of the flood hazard characteristics across the impacted area. The resulted flood inundation map along with the flood extent with respect to the study area is shown in (Figure 3). The flood inundation depth was then combined with the exposure information and vulnerability functions in a GIS environment. It should be mentioned that the resulted flood inundation depth from the hydrodynamic analysis was not used directly to calculate the flood losses as it is measured from the ground elevation. Therefore, the water surface elevation was used to calculate the flood depth by subtracting the FFE from it. The probability of exceedance of each damage state for each building was then calculated using the corresponding fragility curve. These probabilities were interpreted in losses using a similar concept to HAZUS methodology that has been used for the earthquake fragility-based losses. Equation 1. was then applied to capture the flood losses for each building based on the exceedance probability of each damage state and the replacement cost ratio for each damage state.

Where is the fragility-based flood losses expressed in monetary terms which is the replacement or repair cost needed to recover the building.is the exceedance probability of damage state (i). is the replacement cost ratio forandis the total building replacement cost. An algorithm was developed to calculate these flood losses for each building within the flood plain based on different empirical fragilities according to the foundation type of each building (e.g. crawlspace or slab on grade). Then, the resulted losses were brought to the same GIS environment that contains the flood hazard map and the exposure information. The buildings were then categorized based on their amount of flood losses and color-coded according to each loss category. (Figure 3) shows a color-coded map for the buildings located in the flood plain with colors ranging from red color at zero loss up to blue color at $400 thousand losses.
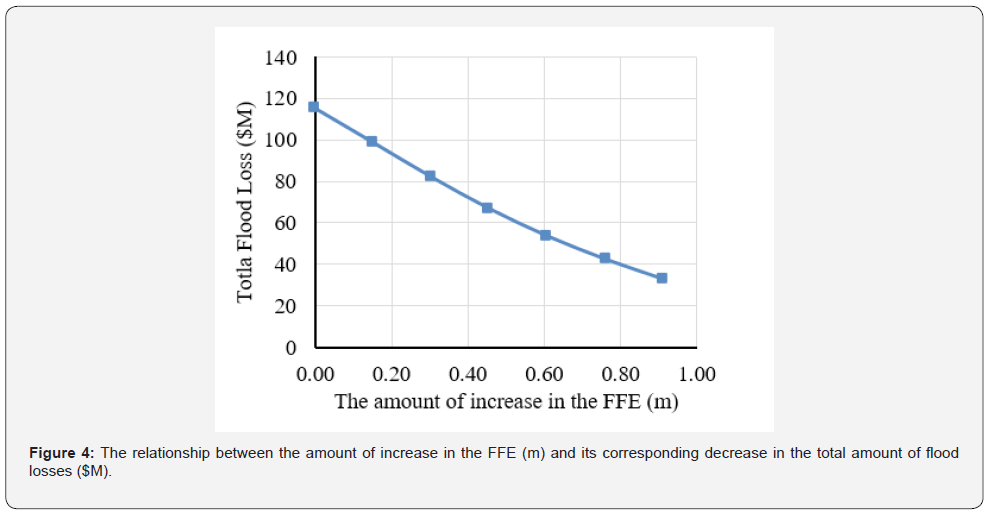
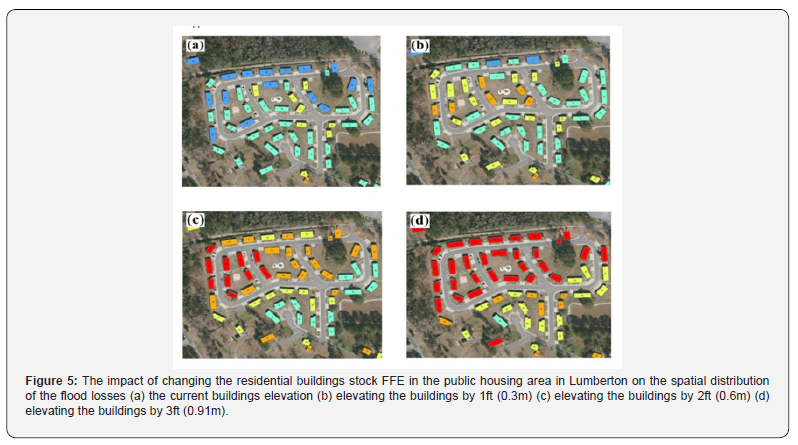
To that end, the flood losses resulted from the 2016 Hurricane Matthew rainfall event were captured for the residential buildings at the current FFE. Assuming that the policy changed in the flood plain area in terms of increasing the FFE of the impacted buildings, the flood losses for residential building stock located on the flood plain were calculated at different FFEs. The analysis captured the flood losses at 0.5ft (0.15m), 1ft (0.3m), 1.5ft (0.45m), 2ft (0.6m), 2.5ft (0.75m), and 3ft (0.9m) increase in the current FFE. The analysis showed that the total flood losses for the whole residential building stock dropped significantly by more than 70% from $115 million losses at the current FFE to $33 million at an elevated FFE by 3ft (0.9m). (Figure 4) captures the relationship between the amount of increase in the FFE and its corresponding decrease in the total amount of flood losses which was almost linear. More contrast was spotted on the residential buildings in the public housing area which is one of the most vulnerable spots in Lumberton. The location of this spot is boxed in (Figure 4) along with the state of flood losses based on the current FFE. (Figure 5) shows different flood loss scenarios based on the amount of increase in the FFE. As the FFE get increased, the amount of flood losses will get decreased which was interpreted on the buildings color-coded map by a transform in the colors from blue (high losses) to red (zero losses). The color code is the same one used for (Figure 4).
Summary and Conclusion
The main objective of this study is to improve the resiliency of the current and future communities by providing a framework to quantify the amount of flood risk. Then this framework was used to study the impact of one of the policy flood protection measures that could be adopted to decrease this risk. Therefore, a flood loss analysis was conducted using information about the rainfall amount, discharges in the mainstreams, buildings exposure information and the developed empirical fragility functions. Overcoming the flood-related data scarcity is what makes this research unique by utilizing different resources of data. The hydrologic analysis was conducted using the rainfall information to predict discharges in the mainstreams. These discharges were used as an input for the hydrodynamic analysis to predict the flood hazard characteristics across the flood plain. Then, the resulted flood hazard characteristics in terms of inundation depth were overlaid on the exposure and the vulnerability information of the Lumberton residential building stock in a GIS environment. A color-coded map was developed to distinguish the different level of losses. Then, the impact of policy change in terms of increasing FFE was investigated. The analysis showed that the total flood losses get decreased significantly by 70% from $115 million to $33 million if the impacted buildings were elevated by 3ft (0.9m) and an example of the public housing loss decrease was provided.
Acknowledgment
This research was conducted as part of the NIST Center of Excellence for Risk-Based Community Resilience Planning under Cooperative Agreement 70NANB15H044 between the National Institute of Standards and Technology (NIST) and Colorado State University. The content expressed in this paper are the views of the authors and do not necessarily represent the opinions or views of NIST or the U.S Department of Commerce.
References
- Nofal OM (2021) High-Resolution Multi-Hazard Approach to Quantify Hurricane-Induced Risk for Coastal and Inland Communities. Colorado State University, USA.
- Li Y, van de Lindt JW (2012) Loss-based formulation for multiple hazards with application to residential buildings. Engineering Structures 38: 123-133.
- Nofal OM, van de Lindt JW (2020) Understanding flood risk in the context of community resilience modeling for the built environment: research needs and trends. Sustainable and Resilient Infrastructure 5(1).
- Scawthorn C, Flores P, Blais N, Seligson H, Tate E, et al. (2006) HAZUS-MH Flood Loss Estimation Methodology. II . Damage and Loss Assessment. Natural Hazards Review 7: 72–81.
- Nofal OM, van de Lindt JW (2020) Minimal Building Flood Fragility and Loss Functions Portfolio for Community-Level Resilience Analysis. Water 12(8): 2277.
- Nofal OM, van de Lindt JW, Do TQ (2020) Multi-variate and Single-Variable Flood Fragility and Loss Approaches for Wood Frame Buildings. Reliability Engineering and System Safety 202: 106971.
- Nofal OM, van de Lindt JW (2020) Probabilistic Flood Loss Assessment at the Community Scale: Case Study of 2016 Flooding in Lumberton, North Carolina. ASCE-ASME Journal of Risk and Uncertainty in Engineering Systems, Part A: Civil Engineering 6(2).
- Environment Agency (2001) Damage Limitation: How to Make Your Home Flood Resistant. Environment Agency.
- Nofal OM, van de Lindt JW. (2020) High-resolution approach to quantify the impact of building-level flood risk mitigation and adaptation measures on flood losses at the community-level. International Journal of Disaster Risk Reduction 51: 101903
- Bowker P (2007) Improving the flood performance of new buildings: Flood resilient construction. London: RIBA.
- Beddoes DW, Booth C (2015) Reducing floodwater ingress rates through an exterior masonry wall of a domestic building: A pilot investigation. Structural Survey 33(3): 196-209.
- Fidler J, Wood C, Ridout B, Heritage E (2004) Flooding and historic buildings: technical advice note.
- Bowker P (2002) Making properties more resistant to floods. In Proceedings of the Institution of Civil Engineers-Municipal Engineer. Thomas Telford Ltd 151(3): 197-205.
- FEMA P-348 (2017) Protecting Building Utility Systems From Flood Damage. Washington, DC.
- SERRI Report 80024-01. 2011. Floodproof Constructon: Working for Coastal Communites.
- NOAA 2018. Advanced Hydrologic Prediction Service. Retrieved from https://water.weather.gov/precip/
- 2018. National Water Information System: Mapper. Retrieved from https://maps.waterdata.usgs.gov/mapper/index.html
- van de Lindt JW, Peacock WG, Mitrani-Reiser J, Rosenheim N, Deniz D, Dillard MK (2018) The Lumberton, North Carolina Flood of 2016: A Community Resilience Focused Technical Investigation.
- e Costa CAB, Da Silva PA, Correia FN (2004) Multicriteria evaluation of flood control measures: The case of Ribeira do Livramento. Water Resources Management 18(3): 263-283.
- Nofal OM, van de Lindt JW (2020) High-Resolution Flood Risk Approach to Quantify the Impact of Policy Change on Flood Losses at Community-Level. International Journal of Disaster Risk Reduction.
- HAZUS-MH FEMA 2003. Flood Model: Technical Manual. Federal Emergency Management Agency.


