Experimental Study of the Impact of Drift, Depth, and Lateral Restrictions on Inland Ship-Induced Waves under Small and Moderate Ship Speeds
Razgallah I*, Kaidi S, Smaoui H and Sergent P
Center for Studies and Expertise on Risks, the Environment, Mobility and Planning (CEREMA-DTecEMF), France
Submission: April 16,2021; Published: May 3, 2021
*Corresponding Author: Razgallah I, Center for Studies and Expertise on Risks, the environment, mobility and planning (CEREMA-DTecEMF), 134 rue de Beauvais ‑ CS 60039, 60280 Margny Les Compiegne, France
How to cite this article: Razgallah I, Kaidi S, Smaoui H, Sergent P. Experimental Study of the Impact of Drift, Depth, and Lateral Restrictions on Inland Ship-Induced Waves under Small and Moderate Ship Speeds. Civil Eng Res J. 2021; 11(4): 555818. DOI: 10.19080/CERJ.2021.11.555818
Abstract
The study of ship-induced waves is essential to prevent bank erosion and optimize the ship’s maneuverability. Inland ship-induced waves are in general affected by many factors divided into ship related parameters (form, draft, speed, drift, and navigation environment parameters (depth, distance to banks, and offset of the sailing line from the channel middle). Based on a set of towing tank experiments, this article depicts the effects of a number of these parameters on inland ship generated waves. To account for real navigation conditions, the ship speed is chosen so as to comply with the regular range of inland navigation speed which is close enough from the maximum allowable speed supported by the experimental setup. To study the effect of ship form, the experiment was carried out on a containership, a pusher-barge and a pusher-two barges. The study is achieved for two different ship’s draft (T =0.1 m and T=0.04 m) and repeated for different configurations of water depth (h between 0.24 m and 0.12 m). The lateral confinement is studied by varying the channel width (W=2.88 m, 1.44 m and 0.72 m). Special attention is paid to the study of a restricted waterway combining both depth and lateral confinement. Besides, to identify the influence of drift, three drift angles were imposed (between 0 and 5°). Finally, the influence of the eccentricity is identified through varying the offset distance (offset = 0.44 m and 0.55 m). The ship wave maximum amplitude is validated by comparison to literature.
Keywords: Ship induced waves; Towing tank experiments; Confinement effect; Ship speed effect; Ship drift; Ship-bank distance effect; Ship form effect
Introduction
Any form of energy consumption involves losses. The elements of the network cause so-called direct losses, while the use of inappropriate equipment, oversizing etc. lead to indirect losses. Direct losses can be reduced by properly selecting the mode of operation, while indirect losses can be prevented or limited with the help of multidimensional calculations and considerations. These include the so-called: life cycle cost analysis. The energy costs representing the largest share of costs, which may reach 85%, can be reduced with the use of both planning and operating tools. The energy indicators of the new or upgraded systems can be optimized with planning tools. The energy efficiency of existing systems can be increased by the appropriate selection of the control mode, the operating parameters and the operation. This study aims to highlight the relationship of these latter ones based on actual measurements, and to allow a comparison, an assessment of the operating pumping stations by presenting the rating parameters defined for pumping systems [1].
Introduction
Inland navigation is strongly affected by restricted waters. Due to the huge increase of resistance observed when the depth to draft ratio decreases and the increase of the interaction between the hull-propeller and rudder [1], the ship’s safety could rapidly become endangered because of the difficulty of maneuvering. In fact, the increase on resistance is in part a result of the increase in wave making resistance provoked principally by the ship waves [2]. In addition, the ship bank interaction is also known to affect the steering ability [3]. Combining these two phenomena is a very interesting case to be considered carefully in order to ensure the safety of inland navigation and to improve inland navigation simulators. Moreover, the ship waves are according to [4-7] one of the main causes of bank degradation and erosion of bottom. Indeed, in order to overcome the resistance force, the ship transfers energy to water through the generated waves and the water is displaced from the front to the back of the ship which provokes return currents that erode the banks. In addition to this, the significant drawdown and surge of water caused by the ship wake induces the increase in bottom water velocity and results on sediment suspension. Besides, unlike river currents or wind driven waves, ship wakes can attack all banks and are often focused on the soft sediment on the inside of bends and not only the outside of bends. For all these reasons, ship waves are regarded as a very interesting research issue.
Previous Studies
Ship induced wave analysis review shows that the waves are affected both by the ship characteristics including hull form, speed, load condition and draft and by environmental factors such as water depth, distance to banks, currents, tidal movement [8] and even vegetation [9]. In 1972 [10] applied a wave pattern analysis in order to suggest form improvement of the ship. Using towing tank experiments, Toda et al. (Toda, et al., 1988) investigated that the influence of the propeller on the generated waves depends on the distance from the propeller. Indeed, they showed that the effect of the propeller is felt starting from a distance of about two diameters upstream of the propeller. The wave profiles were captured through visual observation techniques using both 35mm and video cameras. With the development in photo-analysis technology, this method was employed by [11] to study the generated waves by conventional and high speed ferries, and more recently by [12] to obtain divergent wave angles of a fishing vessel using field measurements in a river. During the experiments, the ship was subject to tidal rise and fall, currents and wind. This optical method has the advantage of being non-intrusive. In order to enhance this method, suspended particles in association to a laser projection are employed by [13]. Restricted to measuring steady ship waves, another technique used by [14] relies on sequentially projecting laser sheet into the water surface and using the fixed cameras to measure the point of impact. To study the ship wakes from a distance, some authors used radar to estimate free surface elevation [15]. Others used satellite photography to characterize the ship wake. For instance, using this technique, [16] showed that the apparent wake angle is inverse proportional to the speed of the ship. Other authors like [17,18] used a submerged pressure measuring technique to study the ship waves.
A different category of measuring techniques relies on using wave probes to measure the wave elevation. This method consists in registering water elevation at a single point over time which gives a cross section of the ship’s wake in the direction of the sailing line. For instance, relying on this method [19] characterized wave of highspeed patrol. [20] used a wave slope meter to apply this technique. This choice was due to the high sampling rate of the wave slope meter (400 Hz). An echo-sounder was employed by [21-22]. Although it can be used to record autonomously a large amount of data, the echo-sounder has a very low sampling rate (5 Hz). [23] presents a database for resistance, squat, ship wave and wake of a DTMB 5415 model benchmarked by the ITTC and the wave elevation was recorded using capacitance probes. According to [23] the use of capacitance probes at high Froude number is not advised because of the occurrence of intense wave breaking phenomena. However, this type of probes allows to measure the elevation of large amplitude waves. [24] studied the effect of limited distance to banks using field observation on Shingashi river and a 2D numerical model. [25] has also carried an experimental study on VLCC ship in shallow, medium and infinite water depth. Its main interest was on characterizing the hydrodynamic forces applied on the ship at various ship speeds and drift angles. The wave cut profiles have been registered using capacitance probes but not deeply analyzed. Another valuable study by [26], shows the effect of shallow water and speed variation on ship wakes and the wave half angle.
Even with the great progress in CFD methods and computing capacities, the experimental approaches are still widely requested today as they are indispensable for results validation. This article represents a contribution to the experimental database on ship waves’ analysis for the case of a 135m inland containership, a 104.5m length pusher-barge and a 181m pusher-two barges system under different channel configurations, ship speed and load. This will allow the study of ship form effects on generated waves and verify which parameters are best suited to characterize the shape of the hull. Besides, in order to permit a better accuracy and control of the experiment, the wave height measurements were carried out using capacitance probes. The ship’s speed is imposed using a traction trolley and varied between 0.22 and 0.89 m/s (corresponding to real ship speed between 0.38 knots and 8.65 knots) such as to avoid grounding and to respect the limits of inland navigation speed. The study is carried out for two different ship’s draft (T equal 0.1 m and 0.04 m) obtained by modifying the loading condition of the ship. And repeated for different configurations of water depth (h varying between 0.24 m and 0.12 m). The depth confinement is characterized using the ratio h/T relating the water depth to the ship’s draft and the depth Froude number or the dimensionless depth parameter. The lateral confinement is studied by varying the channel width (W=2.88 m, 1.44 m and 0.72 m). By using the blockage coefficient, it is possible to characterize the lateral confinement. Special attention is paid to the study of a restricted waterway combining both depth and lateral confinement. To identify the influence of drift, three drift angles were imposed (between zero and five degrees) and to characterize it, a modified Froude number was used. Finally, the influence of the ship’s offset from the middle of the channel is identified through varying the offset distance (offset = 0.44 m and 0.55 m).
Ship Geometries
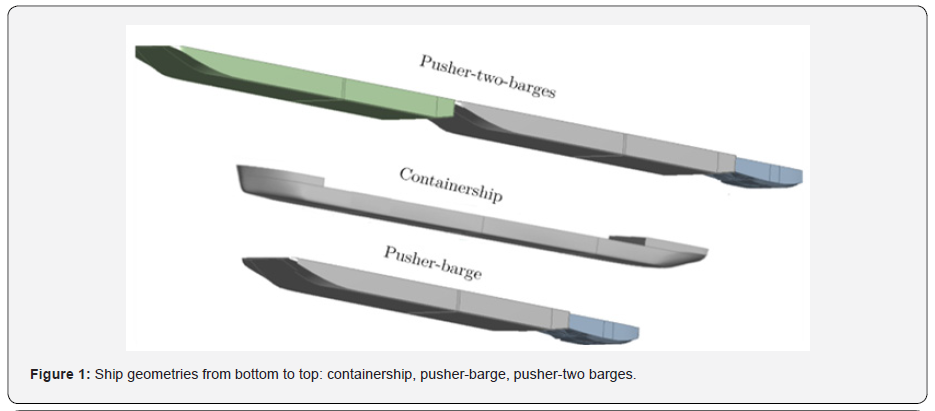
Three geometries were used to investigate the free surface elevation under different configurations. These, fabricated out of polyurethane foam and fiberglass at a scale of 1:25, include a pusher barge, a pusher-two barges system and a containership (Figure 1). The pusher and the barge lines are shown in (Figure 2) while these of the containership are given in (Figure 3). All the ship models are tested under two different load conditions. Those are given in Table 1 along with ship’ characteristics.
Experimental Test Procedure and Uncertainty Assessment
Conducted at University of Liège towing tank, the experiments were carried out under different channel configurations. This towing tank is characterized by the following dimensions:
• Length = 100 m
• Width = 6 m
• Depth = 3.5 m
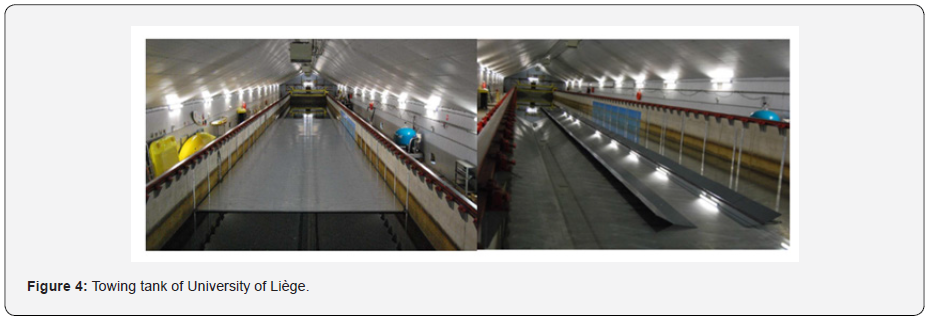
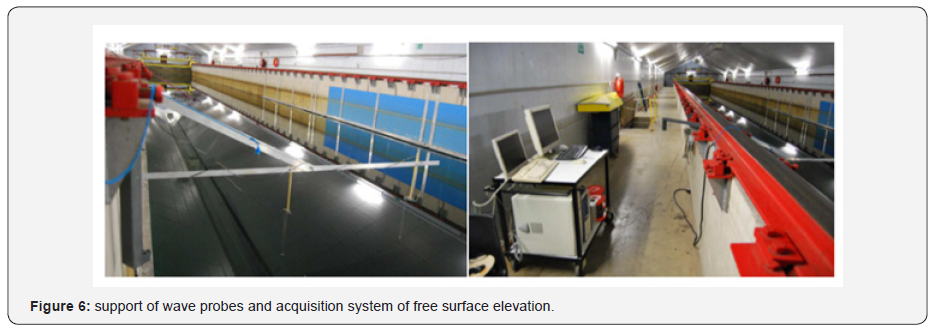
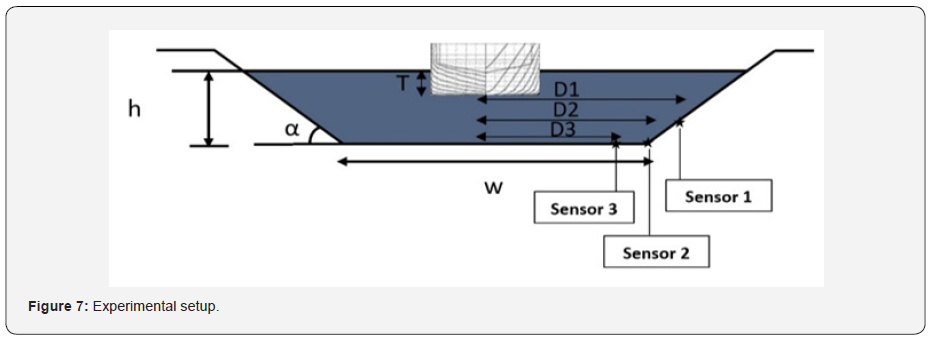
The tank is equipped with an automated trolley to pull the model hull with a constant speed. In order to fix the water depth of the tank, a movable aluminum bottom of 30 m length was used and to set the distance to banks, PVC sponge layers were chosen for their capacity to reduce the reflection at the tank walls (Figure 4). These artificial banks are placed on the bottom and fixed using triangle supports enabling the modification of the bank angle (Figure 5). In this study, the channel slope α is set to 2:1 (27°). A towing system to tow the models at the desired speed is needed. For this purpose an electric winch connected to a grooved drum was used. The measures start after insuring a uniform ship speed. The wave elevation measurement was achieved using three capacitance probes placed at the center of the channel respectively at a transversal distance of D1, D2 and D3 from the ship’s gravity center. These distances are adjustable using a movable cross slide positioned transversally to the direction of the ship, and on which the sensors are assembled (Figure 6). A diagram of the experimental setup is given in (Figure 7). It is assumed that the origin of the tank-fixed reference frame is fixed at the mean water level.




Using a single insulated wire partially submerged in water, the capacitance probe works by measuring the capacitance based on the linear relationship between capacitance and surface height. The displacement accuracy of the probes is estimated to 1 mm. With a frequency of 100 Hz, the acquisition starts at the time that the ship passes by the ideal line of the probes giving a time history of the wave elevation signal at the transversal position on which the probe is fixed. The signal recorded by each probe is filtered and converted from volts to meters using MATLAB. To ensure calm water conditions, a sufficient time was accorded between successive runs. To convert the time history into longitudinal displacement, the following expression is used: where and are the initial position and corresponding time. The longitudinal displacement is then expressed under dimensionless form by dividing it by the ship length.
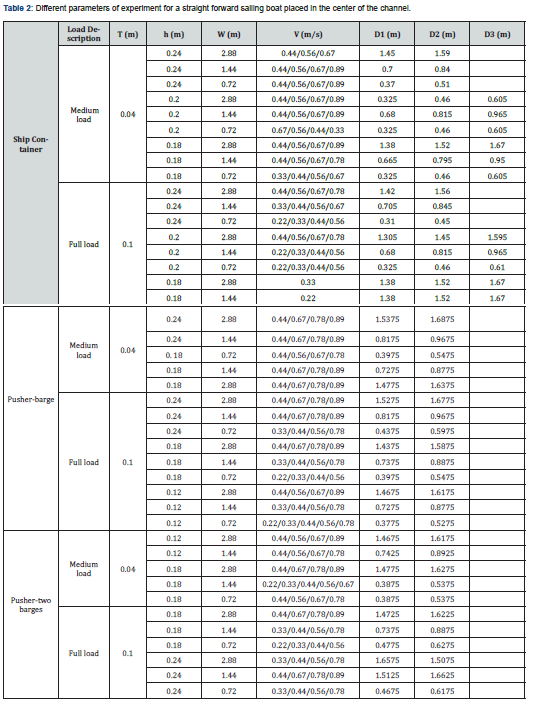
This protocol is repeated for various conditions of ship load, water depth, distance to banks, speed and hull geometries. Note that the maximum speed is set up to almost the maximum speed offered by the facility. This set of experiments is presented in Table2. The drift effect is also investigated by testing three drift angle values on pusher-barge system under both medium and full scale load conditions without any offset of the sailing line from the middle of the channel (Table 3). Furthermore, to study the effect of sailing line offset, additional tests are carried out on the containership as shown in Table 4. In these cases, the ship’s sailing line is moved away from the center of the channel.


Experimental Results
The free surface deformation is induced by the fluid motion. The difference in wave behavior at different length scales is due to the fact that short waves are closely related to surface tension whereas the gravity is very important for long waves. Both capillarity tension (described by the Weber number) and gravity (described through the Froude number) tend to exert a stabilization effect against the disrupting effect produced by turbulence kinetic energy [27]. The Froude and Weber numbers are given below:

Where g is the gravity acceleration andis the surface tension. For the studied problem, the Weber number is very high so that the inertial effects outweigh the capillary effects. Whereas, the Froude number is relatively small meaning that the gravitational energy overcomes the kinetic energy produced by inertial effects, which means that the ship wake is mainly caused by gravitational waves. The analysis of ship waves can be handled using different methods. These latter can be classified according to (De Roo, et al., 2010) into global ship wave pattern interpreting methods and separating ship wave patterns into primary and secondary wave system methods. Indeed, the wave train generated by the ship is composed of primary and secondary waves. The primary wave system is characterized by a significant water level depression. The secondary waves system, caused by pressure variation due to the discontinuities in the hull shape, is composed of transverse and divergent waves. In general, to characterize vessel wave wakes, it is possible to rely on two important parameters: maximum wave height “Hm” and its wave period “Tm”. The wave period is calculated as twice the time between a consecutive crest and trough (Figure 8). In addition to these parameters, the wave profiles are also characterized by a significant depression of water level called the mean water level drawdown and referred to as “Hd”.
The ship’s speed is usually characterized using the Froude number. Three regime types are identified according to (Lewis, 1988) depending on length-based Froude number. These regimes are planning hull (FrL>0.5), semi-displacement hull (FrL=0.5) and displacement hull (FrL<0.399). Since the length-based Froude number doesn’t exceed 0.2 for all the studied cases, the regime is considered a displacement hull. To investigate the effect of speed variation on ship waves, a cut of the wave elevations at different FrL is presented in (Figure 9) for respectively two channel depths and at constant ship draft (T=0.04m). The data presented here concern mainly the containership. Unfortunately, only a fraction of the wave train is captured for h/T=4.5.
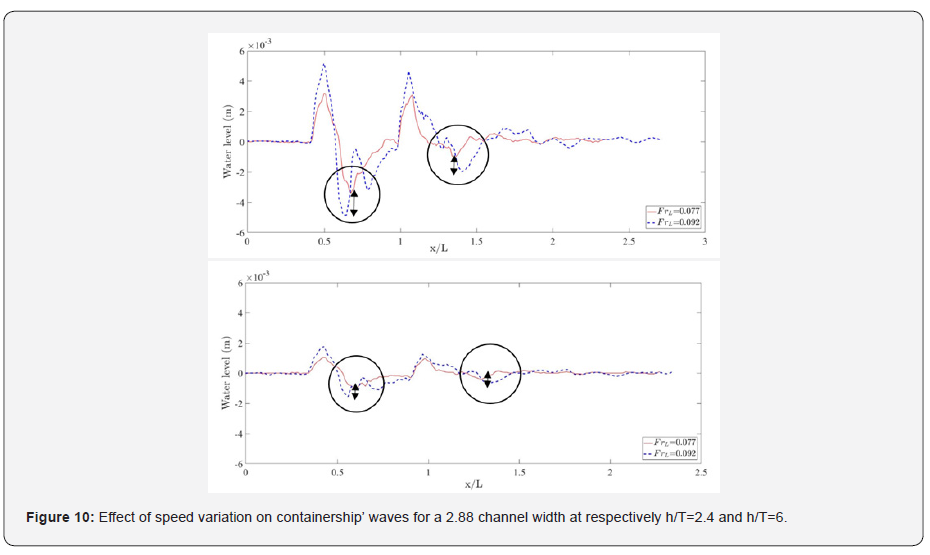
A look at the figure shows that a small change in speed results in large modifications of wave amplitude. This fits well the remarks of [28]. The ship’s speed variation affects also the wave period. Indeed, when the speed increases, the length-based Froude number increases and the period decreases. In addition to this, the drawdown of the water level increases with the increase of length-based Froude number. In fact, at a constant draft, when the water depth decreases from 0.2 to 0.18 m, the ratio h/T varies between 5 and 4.5 and the mean water level drawdown decrease when the length Froude number varies from 0.122 to 0.06 is estimated to 1.36 times. At a constant Froude number, the maximum wave amplitude increases with the water depth increase. It is estimated, when h/T decreases from 5 to 4.5 and when the Froude number is equal to 0.122, to a factor of 1.02 for the primary waves and a factor of 1.99 for secondary waves. To look more closely at the effect of speed variation both on deep and medium shallow water, (Figure 10) presents a comparison of wave cuts at two length-based Froude numbers (FrL=0.077 and FrL=0.092).
The figure shows that, for h/T=2.4, the primary wave amplitude increases 1.53 times whereas its period decreases 1.45 times when the length-based Froude number increases from 0.077 to 0.092. In addition to this, the maximum amplitude of secondary waves increases 1.99 times and its period increases 1.11 times. When the draft decreases to 0.04m, (i.e. h/T=6), the ship is navigating in deep water. Under these conditions, the primary wave amplitude increase between FrL=0.077 and FrL=0.092 is estimated to 1.56 times against 1.54 times for the shorter secondary waves. And their corresponding period decreases respectively by 1.71 times and 1.23 times for the same range of length-based Froude numbers. The change in frequency and the modification in wave elevation when the speed is varied can be explained by the increase in displaced water volume when the speed increases. The influence of turbulence at higher speeds can also contribute to these effects. Besides, the difference on the mean water level drawdown for respectively 0.077 and FrL=0.092 is shown to increase 2.8 times when the ratio of water depth to ship’s draft decreases from h/T=6 to h/T=2.4. Also a comparison of maximum wave amplitude at FrL=0.092, shows that it increases three times when the draft varies from 0.04 m to 0.1 m. The maximum wave elevation is extracted and shown in Table 5 for different Froude numbers and compared to BAWAK correlation given here below (Federal Institute of Hydrology Koblenz & Federal Waterways Engineering and Research Institute Karlsruhe, November 2016) [29]:

With V is the ship speed, is the gravity,is the distance to banks,is the lateral distance from the measurement point to the vessel sailing line and , is a correction to the increasing of speed influence in critical regime. For the studied speed range, it is supposed equal to 1. is the wave height coefficient related to the ship’s shape, draft and water depth. For the containership sailing in deep water and medium load (i.e. h/T=5), Aw is supposed equal to 0.22. The coefficientis proven to decrease when h/T increases. Indeed it is estimated to 0.14 for h/T=6 and to 0.78 for h/T=2. The comparison between experimental results of maximum wave height and the correlation of BAWAK, shows a good agreement in general. It is also noticed that the error seems to decrease when the Froude number increases. The maximum wave height increases with the increase of Froude number which joins the earlier remarks.


Channel water depth and ship’s draft effects
Based on [30], the effect of water depth and the change in draft are described using the ratio h/T. For h/T>5, the ship is travelling in deep waters. When this ratio is about 3, the ship is sailing in intermediate water. When this ratio decreases further (less than 2), the bottom effect increases and starts to affect significantly the ship resistance. The characterization of the water depth effect relies not only on h/T, but also on the depth Froude number. For small depth Froude number (Frh<0.6), the regime is subcritical. For (0.6<Frh<1.2), near critical regime is observed. When Frh increases further, the supercritical regime takes place [31]. Since the maximum studied Frh is not greater than 0.67, the supercritical regime is not discussed in this article. [32] define also the finite water depth starting a dimensionless depth:

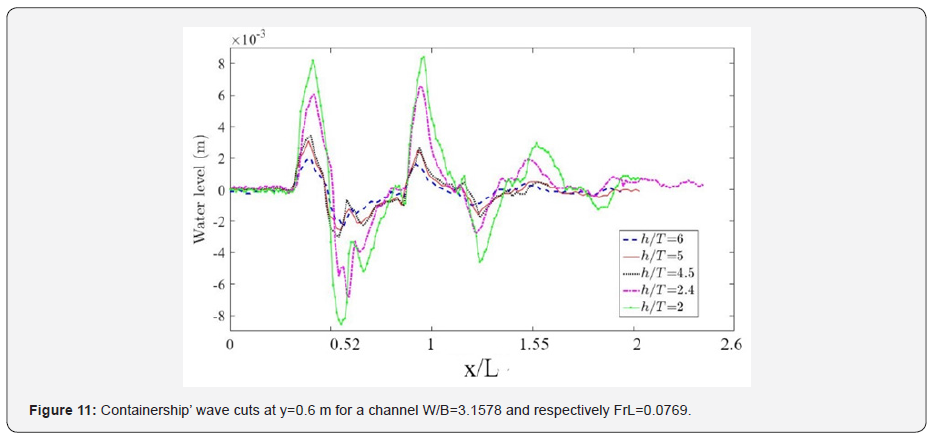
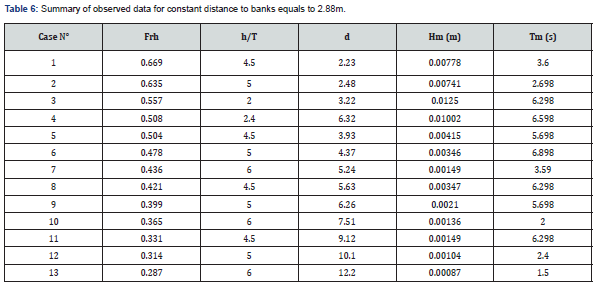
Based on the previously presented adimensional numbers, a summary of the obtained data from ship induced wave’s analysis for the containership is presented in Table 6 for different depth and draft configurations at a constant channel width. A look at cases 10 and 12 shows that for similar depth Froude numbers, a great increase is registered in the maximum wave amplitude. This implies that the depth Froude number is insufficient to characterize the confinement of a channel. The same applies to the coefficient h/T (see cases 12 and 2) and to the coefficient d (see cases 4 and 9). A good characterization relies on the combination of two of these three parameters including inevitably the coefficient h/T. (Figure 11) shows wave cuts of the containership at y/L=0.1 in subcritical regime (0.36<Frh<0.42) at different configuration of channel depth and draft for a distance to banks equals to 1.44 m. The features of ship induced waves in shallow channels differ from those created in deep open water (Dam, et al., 2008). This is slightly seen when comparing the wave cuts at h/T=6 and h/T=2.
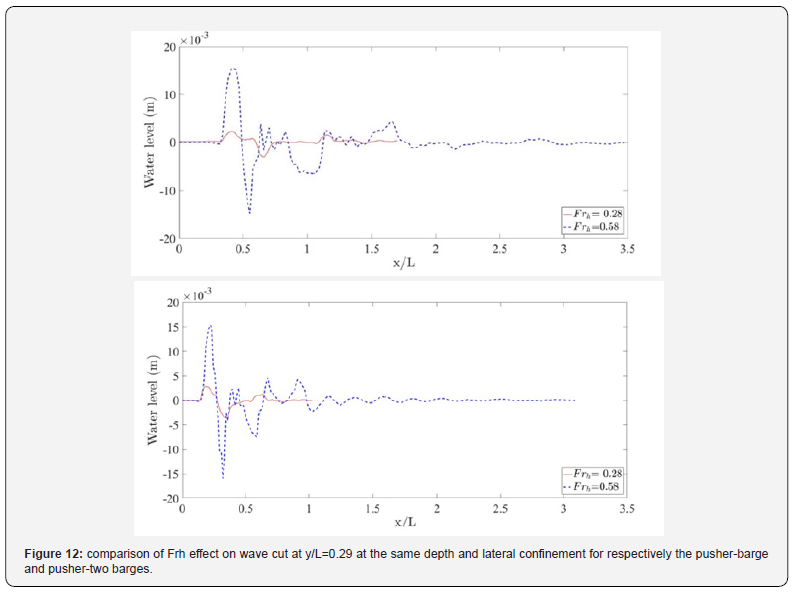
As expected, the wave elevation shows in general a nonlinear increase with the decrease of depth to draft ratio. It increases by 85.1% between h/T=6 and h/T=4.5 against an increase of 138.2% between 4.5 and 2. This increase is closely related to the increase of the immersed volume of the ship when the draft increases. This induces the increase of the volume of water displaced by the ship motion compared to the total volume of water in the channel. When the water depth decreases at a constant draft, (blue, red and black curves), the area of the channel cross-section decreases. This increases the drawdown and return flow which explains the increase in wave amplitude. With the decrease of water depth, the period also decreases. Yet the change in period is less spectacular than the change in maximum wave elevation when the depth Froude number changes. Indeed, it is estimated to 2.8 seconds for h/T=4.5. The estimation increases to 3.6s for h/T=6. In attempt to examine the near critical regime, (Figure 12) shows two wave cuts for respectively the pusher-1 barge and pusher-two barges at two different depth based Froude numbers for h/T=2.4 and at W=1.44m. The waves generated by these two ships are quite similar. They both show a change in the wave feature between subcritical and near-critical regimes. Indeed, in the case of subcritical regime, the wave amplitudes are much smaller than in near-critical regime characterized by v shaped waves [33]. This shape can be explained by the difference in wave periods.
Distance to banks effects
The ship’s distance to banks affects the lateral confinement. The latter is characterized by the blockage coefficient defined as the ratio of the ship’s underwater cross section to the section of the waterway. According to the ITTC (ITTC, 2008), the confinement effect can be neglected if:

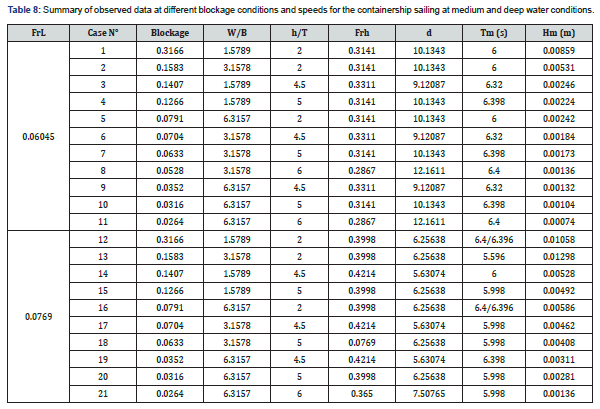
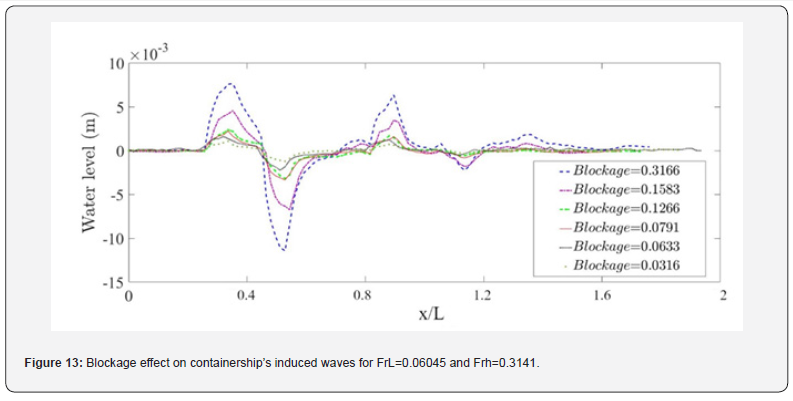
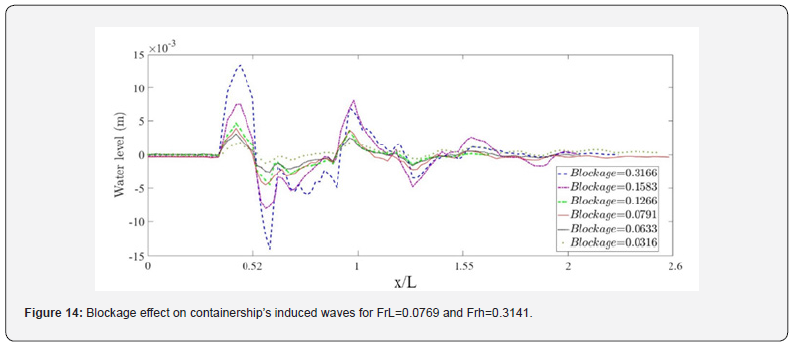
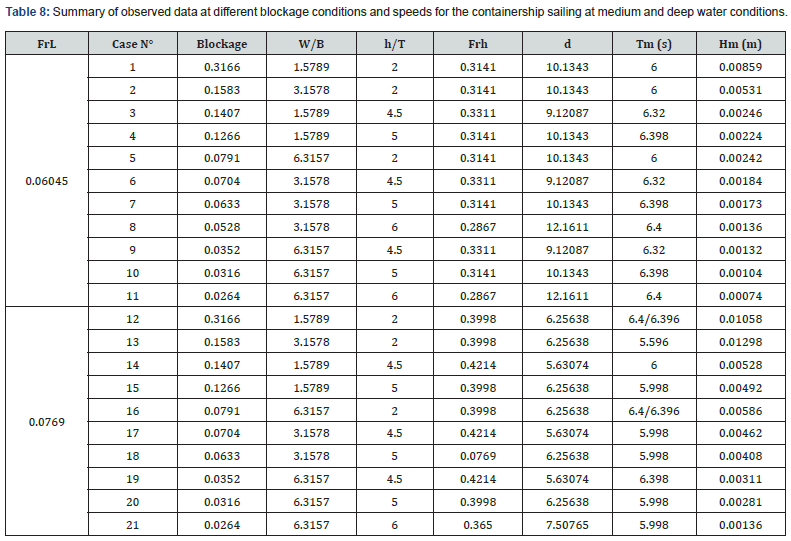
where  is the effective midship section area, W is the width of the towing tank and h is the water depth. For a constant h/T ratio, it is possible to use the ratio W/B to characterize the blockage. In this study, three values of w were tested for both a fully loaded and medium loaded containership (Table 7). The corresponding wave cuts are presented in (Figures 13 & 14) for two different speeds. It is observed that for a constant speed (FrL is constant), when the blockage coefficient increases, the wave amplitude increases too while the wave period remains almost constant. For more details, the maximum amplitudes of secondary waves are estimated in Table 8 for different blockage coefficients. For instance, the wave amplitude is estimated at FrL=0.06045 to increase 11.6 times when the blockage coefficient increases from 0.0264 to 0.3166 (cases 1 and 11 in Table 8). Cases 12 and 13 corresponding to blue dashed and purple dash-dotted curves in (Figure 14), show some discrepancies to the earlier mentioned features. Indeed, the registered secondary wave amplitudes are higher when the blockage decreases. These results are not physical and should be due to certain perturbations occurring during the experiment. At a constant depth, draft and speed (example: cases 1, 2 and 5), the lateral confinement have no effect on wave period. Cases 4 and 15 shows that at a constant channel width (W/B is constant) and for the same depth to draft ratio, when the dimensionless water depth d increases, the wave amplitude decreases and the period increases slightly. Now if W/B is constant at different (h/T) (see for example cases 3 and 4), when the blockage decreases, the period increases and the amplitude decreases. Cases 12, 16 and 19 are an exception to the previous statement probably due to some perturbations during the experiment.

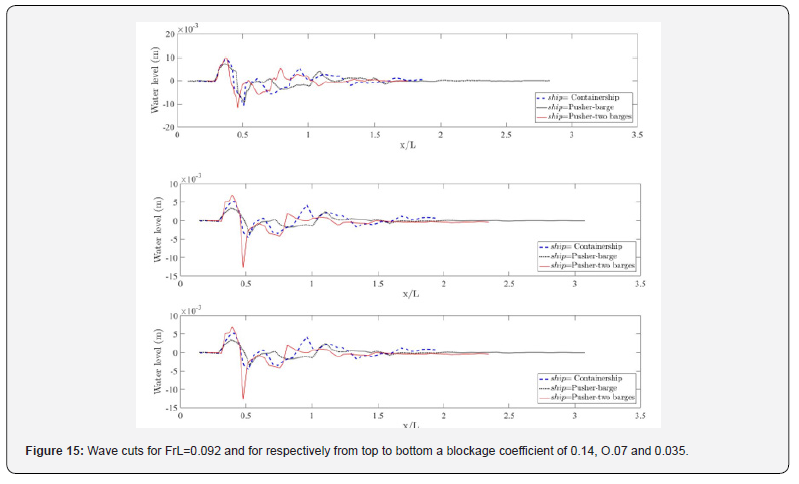
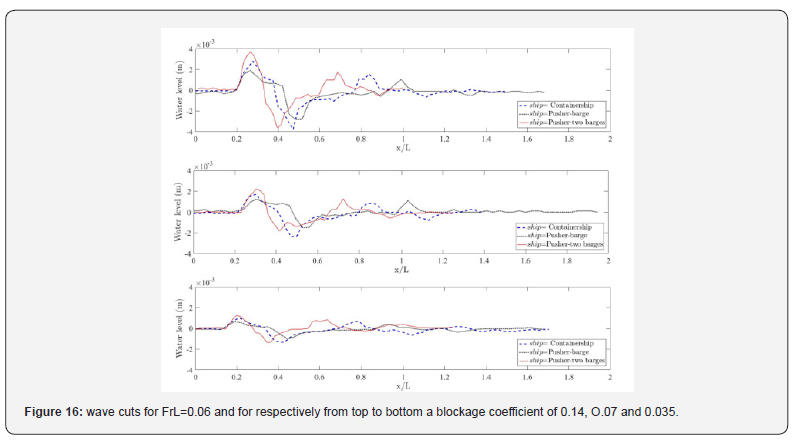
Besides, it is clearly seen that the speed increase generates a huge increase in wave amplitudes and affects slightly the amplitudes resulting in a small decrease of this quantity. This is mainly caused by the strong increase in the interaction between the ship and the banks. Also, interferences caused by the wave reflections on the banks increase when the blockage increase. To study the effect of the ship geometry on the ship generated waves under different water restriction, the same tests were carried out on a pusher –barge, a pusher two barge and the containership. Cuts of the ship waves at blockage coefficients of 0.1407, 0.0704 and 0.0352 are presented in (Figures 9 &10) for length Froude numbers of 0.06 and 0.092. According to the present experimental results, comparing the wave train generated by the studied containership, pusher-barge and pusher-two barges by relying only on the block coefficient as a unique parameter to characterize the geometry seems unsatisfactory. Indeed, the pusher-barge and pusher-two-barges configurations have the same block coefficient. The block coefficient of the containership is slightly bigger. It is expected based on the previous remarks to observe almost three superposed waves. However, it can be seen from (Figures 15 & 16), that the three geometries don’t have exactly the same wave profiles. It is the pusher-two barges that has the greatest wave amplitude. This is probably due to the difference in T/L and B/L ratios (Table 9). As a matter of fact, the increase of the waterline length is responsible for the increase in wave amplitude. This is supported by the remarks of [34] who describes the maximum wave height as a function of length displacement ratio.

Drift effect
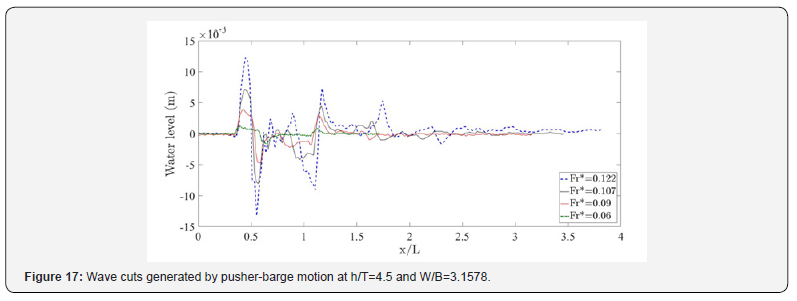
Accurate estimation of the hydrodynamic forces, when a ship is operating at a certain angle of drift, is essential to estimate the ship’s course keeping ability and so, its maneuvering quality. Yet, an accurate estimation of the hydrodynamic forces includes a good estimation of the ship’s wake. According to [35], even when a ship is sailing straight stretch, it is common that a nautical drift angle (about 1 or 2° according to the ship’s form) is observed between the ship’s axis and the channel axis. This angle can reach much higher values when the ship is undertaking a bend trajectory. To study the effect of the drift on the ship’s wake, wave cuts of a pusher-barge system at different drift angles and speed are given in (Figure 17). To characterize the influence of the drift angle, the wave elevation is drown as a function of a modified Froude number inspired from [36]. It is defined as:

With  is the drift angle. Another, possibility to characterize the effect of drift, is to use the notionally enlarged plunged midship section


Where B is the beam of the ship, L is its length, is the drift angle and
  is the plunged midship section.
This number decreases when the speed and the drift decreases. The figure shows that the wave amplitude seems to increase when the modified Froude number increases and the wave period decreases. To confirm these observations the maximum amplitude and its corresponding period are shown in Table 10. For instance, the wave amplitude increases 13.2 times when Fr* increases from 0.0608 to 0.1227 (see cases 1 and 4). The period, on the other hand, decreases by a factor of 2. This is in good agreement with [36] remarks that investigated surface waves and heat transfer in inclined turbulent open channel water flows. In order to explain the increase observed in wave amplitude when the modified Froude number increases, it is possible to rely on the effect of both the drift and speed modification on the pressure distribution around the hull. Indeed, when the drift angle increases, the plunged ship’s cross-section is modified. Furthermore, when the speed increases, as explained in section 3.2, the frequency decreases as a natural response to wave dispersion. This means that low frequency waves travel faster than low frequency waves.

Effect of waterline offset: eccentricity effect
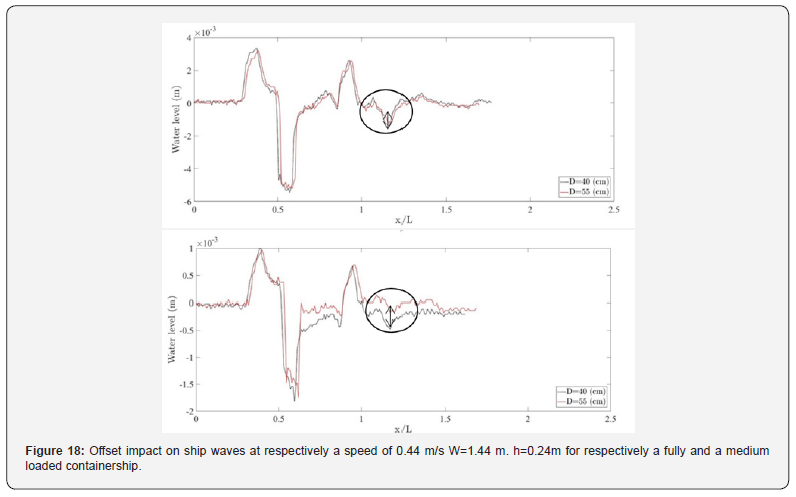
This part of the study was carried on the containership (Table 4). The flow induced by the proximity to the bank is asymmetrical around the ship. This is mainly due to the modification of the pressure distribution between the port and starboard sides which provokes a modification in the generated waves. Indeed, it is observed that the variation of the containership’s offset from the middle of the canal affects the generated wave cuts. Some examples are shown in Figures 18 and 19 for a containership sailing at different speeds and draft conditions. It can be clearly observed that when the eccentricity increases the mean drawdown of water level is less significant and the wave seems to spread further away. This is mainly due to the dispersion phenomena related to the wavelength and wave direction [37]. The closer the ship to the bank, the shorter is the wave length and the higher is the hydraulic load. The latter is affected by the cross section area between vessel and bank compared to canal cross section. Moreover, the eccentricity impact depends also on the ship draft and its speed. In fact, (Figure 18) shows that, at constant speed, the difference in the mean water level drawdown between waves induced by a ship sailing respectively at a distance of 40 cm and of 55 cm from the center of the channel decreases 3.6 times when the draft decreases from 0.1 to 0.04 m. The delay in the wave amplitude between time profiles of the water surface elevation at a sailing distance of 55cm and 40 cm from the channel center is estimated to 0.3 s at a draft equal to 0.04 m whereas it is estimated to 0.2 s when the draft equals 0.1 m. These remarks demonstrate that the eccentricity effects are more pronounced when the ship’s draft increases. Similarly, for a constant draft, when the speed increases (Figure 19), the difference between the mean water level drawdown increases by 7.7 times when the speed goes from 0.44 m/s to 0.56 m/s. The discrepancy in wave periods decreases from 0.3s to disappear completely starting a speed of 0.56 m/s. It is then possible to conclude that the eccentricity effects are more striking when the ship speed increases. The maximum wave height was compared to the following formula [35]:


Where V is the ship speed, g the gravity, D the eccentricity, B the ship’s breadth and Aw a coefficient dependent on the ship form, its draft and the water depth in the channel. At h/T=2.4, and for the studied containership Aw=0.65. The comparison is shown in Table 11. It shows a good agreement in general between experimental and empirical results with relative error ranging between roughly 1% and 10%. A strong perturbation of the measures is suspected for the cases 7 and 8 explaining the slight increase in maximum secondary wave amplitude when the eccentricity increases which is against the general observation that the wave height increases as the distance to the nearest bank decreases [38-54].

Conclusion
Wave measurements are crucial to reduce the risk of bank wash and to ensure the safety of the ship. This experimental study allowed the identification of measure features of ship waves under different configuration of the channel and ship parameters. The study showed in particular that:
a) The ship’s speed is an important parameter that affects the propagation of lateral wave level depression and the shape of the wave. It is apprehended in this study using the depth Froude number.
b) The depth confinement is affected by a combination of water depth, draft, speed and ship’s length. The wave height is magnified when the length-based Froude number and the depth based Froude number increase and when the ratio of depth to draft decreases and the finite water depth confinement coefficient decreases below 3.
c) The lateral confinement is suitably described using the blockage coefficient. The speed is proven to affect the lateral confinement and increase the manifestation of huger wave amplitudes when the blockage increases.
d) The drift effect is described properly using drift modified Froude number. When the drift and/or the speed increase the modified Froude number increases resulting in higher amplitude waves with smaller periods.
e) The characterization of the hull’s shape is suitably performed when introducing the ratios T/L and B/L in addition to the block coefficient.
The present measurements represent a valuable database to be used in the validation of future numerical work. Although it permitted to draw the remarks above the need for numerical approaches is basically related to their ability to provide more information about the flow and the generated wake at the vicinity of the ship at a lower cost. It is possible, based on this work, to develop an empirical expression to estimate Aw as a function of ship form, its draft and the water depth.
References
- Kaidi S, Smaoui H, Sergent P (2018) CFD Investigation of Mutual Interaction between Hull, Propellers, and Rudders for an Inland Container Ship in Deep, Very Deep, Shallow, and Very Shallow Waters. Journal of Waterway, Port, Coastal and Ocean Engineer 144.
- Razgallah I (2018) The impact of free surface modelling on hydrodynamic forces for ship navigating in inland waterways: water depth, drift angle, and ship speed effect. Journal of Marine Science and Technology p. 1-22.
- Kaidi S, Smaoui H, Sergent P (2017) Numerical estimation of bankpropeller- hull interaction effect on ship manoeuvring using CFD method. Journal of Hydrodynamics 29(1): 154-167.
- Nanson GC (1994) Experimental measurements of river‐bank erosion caused by boat‐generated waves on the Gordon river, Tasmania. Regulated Rivers: Research & Management 9: 1-14.
- Ji S (2013) Numerical modeling of Sediment resuspension induced by the compounding effects of ship-generated waves and the ship propeller. Journal of Engineering Mechanics 140: 04014034.
- Smaoui H (2018) Safety priorities determination for hydraulic structures relevant for navigable waterways in France: the case of Voies Navigables de France [Conference], 34th PIANC World Congress. Panama.
- Bilkovic DM (2017) Review of boat wake wave impacts on shoreline erosion and potential solutions or the Chesapeake Bay [Report]. STAC Review Report 17-002 p. 68.
- Mao L, Chen Y (2020) Investigation of Ship-Induced Hydrodynamics and Sediment Suspension in a Heavy Shipping Traffic Waterway. Journal of Marine Science and Engineering 8(6): 424.
- Macfarlane GJ, Renilson MR (1999) Wave Wake-A Rational Method for Assessment. International Conference on Coastal Ships and Inland Waterways 1: 1-15.
- Thuy NB (2017) Effect of river vegetation with timber piling on ship wave attenuation: investigation by field survey and numerical modeling. Ocean Engineering 129: 37-45.
- Baba E (1972) An application of wave pattern analysis to ship form improvement. Journal of the Society of Naval Architects of Japan 132: 29-39.
- Toda Y (1988) Mean-Flow Measurements in the Boundary Layer and Wake of a Series 60 Block Coefficient. 6 Model Ship with and without Propeller [Report]. Iowa City: Iowa Inst of Hydraulic Research, IIHR- 326.
- Velegrakis AF (2007) Field observations of waves generated by passing ships: A note. Coastal Engineering 54(4): 369-375.
- Suprayogia DT (2014) Field Measurement of Fishing Boats Generated Waves. Journal Teknologi 66(2): 183-188.
- Gomit G et al. (2013) Free surface measurement by stereo-refraction. Experiments in fluids 54(6): 1540.
- Gomit G et al. (2015) Large-scale free surface measurement for the analysis of ship waves in a towing tank. Experiments in Fluids 56(10): 184.
- Reed AM, Milgram JH (2002) Ship wakes and their radar images. Annual Review of Fluid Mechanics 34(1): 469-502.
- Rabaud M, Moisy F (2013) Ship wakes: Kelvin or Mach angle? Physical review letters 110(21): 214503.
- Stumbo S (1999) The prediction, measurement, and anlysis of wake wash from marine vessels. Marine Technology and SNAME News 36(4): 248-260.
- De Roo S, Troch P (2010) Analysis of ship-wave loading on alternative bank protection of a non-tidal waterway: first results. 1st European IAHR Congress. International Association for Hydro-Environment Engineering and Research (IAHR).
- Ghani MPA, Rahim MARMA (2008) The prediction of wake wash in the towing tank. Jurnal Mekanikal 26(2): 129-140.
- Wyatt DC, Hall RE (1988) Analysis of ship-generated surface waves using a method based upon the local Fourier transform. Journal of Geophysical Research: oceans 93: 14133-14164.
- Parnell K (2008) Far-field vessel wakes in Tallinn Bay. Estonian Journal of Engineering 14(4): 273-302.
- Kurennoy D, Parnell KE, Soomere T (2011) Fast-ferry generated waves in south-west Tallinn Bay. Journal of Coastal Research 64: 165-169.
- Oliviari A, Pistani F, Avanzini A (2001) Towing tank experiments of resistance, sinkage and trim, boundary layer, wake, and free surface flow around a naval combatant INSEAN 2340 model [Report]. Iowa Univ Iowa City Coll of Engineering.
- Dam K T, Tanimoto K, Fatimah E (2008) Investigation of ship waves in a narrow channel. Journal of marine science and technology 13(3): 223-230.
- Fabbri L et al. (2006) An experimental maneuvrability study of the effect of water depth for blunt ships: the effect of the water depth. International conference on ship and shipping research (NAV).
- Tunaley JK (2004) Ship wakes in shallow waters. LRDC Report.
- Brocchini M, Peregrine DH (2001) The dynamics of strong turbulence at free surfaces. Part 1. Description. Journal of Fluid Mechanics. Cambridge University Press 449: 225-254.
- Lewis EV (1988) Principles of naval architecture – Vol. II: resistance, propulsion and vibration [Book]. Jersey City, USA.
- Macfarlane GJ (2012) Marine Vessel Wave Wake:Focus on Vessel Operations within Sheltered Waterways [Report]. Australian Maritime College, University of Tasmania.
- Federal Institute of Hydrology Koblenz & Federal Waterways Engineering and Research Institute Karlsruhe Examinations of
Technical-Biological Bank Protections on Inland Waterways: Determination of Ship-Wave Heights at the Bank [Report]: R & Project. (BAW - BfG) p. 1-9.
- Pianc Overview of simulation techniques, capability ship manoeuvring simulation models for approach channels and fairway in harbours [Report]. Report of Working Group p. 49- 77.
- Patel PK, Premchand M (2015) Numerical investigation of the influence of water depth on ship resistance. International Journal of Computer Applications 116: 10-17.
- Caplier C (2014) etude experimentale des effets de hauteur d’eau finie et de confinement lateral sur les sillages de navire en bassin des carenes. 14eme Journée de l’Hydrodynamique. - Val de Reuil.
- Parnell KE, Soomere T, Zaggia, L, Rodin A, Lorenzetti G (2015) Ship-induced solitary riemann waves of depression in Venice lagoon. Phys Lett A 379(6): 555-559.
- ITTC Recommanded Procedures and Guidelines 7.5-02-05-01 [Report].
- Macfarlane GJ (2002) The measurement and assessment of sub-critical vessel generated waves [Report]. Australian Maritime College: Master of Philosophy thesis.
- BAW Principles for the Design of Bank and Bottom Protection for Inland Waterways [Report]. Bulletin n°88 of the Federal Waterways Engineering and Research Institute (Bundesanstalt für Wasserbau).
- Freeze B (2003) Characterization of the effect of Froude number on surface waves and heat transfer in inclined turbulent open channel water flows [Journal]. International Journal of Heat and Mass Transfer 46(20): 3765-3775.
- Lighthill J (1978) Waves in fluids [Book]. Cambridge University Press.
- Degiuli N, Werner A, Doliner Z (2003) Experimental determination of wave pattern resistance of a trimaran. In Proc. 17th IMEKO World Congress. Dubrovnik, Croatia.
- Ji S (2013) 3D simulation of wake waves generated by the passage of boats and associated sediment transport processes [Report]. Doctoral dissertation, University of Technology of Compiè
- Kose K, Misiag WA, Xiong X (1996) Systematic approach for ship manoeuvrability prediction. Marine simulation and ship manoeuvrability. rotterdam.
- Kume Kenichi, Hasegawa, Jun, Tsukada, Yoshiaki (2006) Measurements of hydrodynamic forces, surface pressure, and wake for obliquely towed tanker model and uncertainty analysis for CFD validation. Journal of marine science and technology 11: 65-75.
- Marrone S, Bouscasse, B, Colagrossi A, Antuono M (2012) Study of ship wave breaking patterns using 3D parallel SPH simulationsComputers & Fluids 69: 54-66.
- Milgram JH (1988) Theory of radar backscatter from short waves generated by ships, with application to radar (SAR) imagery.Journal of ship research 32(1): 54-69.
- Munk W H, Scully-Power P, Zachariasen F (1987) The Bakerian Lecture, 1986 Ships from space. Proceedings of the Royal Society of London A: Mathematical Physical and Engineering Sciences pp. 231-254.
- Noblesse F, Delhommeau G, Liu H, Wan DC, Yang C (2013) Ship bow waves. Journal of Hydrodynamics 25(4): 491-501.
- Pethiyagoda R (2016) Mathematical and computational analysis of Kelvin ship wave patterns [Report]. Doctoral dissertation, Queensland University of Technology.
- Robbins A, Thomas G, Macfarlane GJ, Renilson MR, Dand I (2007) The decay of catamaran wave wake in shallow water. 9th Intl. Conf. on Fast Sea Transportation. Shanghai, China.
- Shakeri M, Tavakolinejad M, Duncan JH (2009) An experimental investigation of divergent bow waves simulated by a two-dimensional plus temporal wave marker technique. Journal of Fluid Mechanics 634: 217-243.
- Sprenger Florian, Hassani, Vahid, Maron, Adolfo et al. (2016) Establishment of a validation and benchmark database for the assessment of ship operation in adverse conditions. Proceedings of the 35th International Conference on Ocean, Offshore & Arctic Engineering. - Busan, South Korea.
- Zhang C, He J, Zhu Y, Yang CJ, Li W (2015) Interference effects on the Kelvin wake of a monohull ship represented via a continuous distribution of sources. European Journal of Mechanics-B Fluids 51: 27-36.
- Rock Manual (2007) The use of rock in hydraulic engineering. Centre d’études maritimes et fluviales (CETMEF); Civieltechnisch Centrum Uitvoering Research en Regelgeving (CUR) & Construction Industry Research and Information Association (CIRIA) (Eds.), 2. ed., London.


