Impact of Geometry and Traffic on Urban Arterial Accidents
Hashem R. Al-Masaeid* and Anaal A. Al-Zghoul
Department of Civil Engineering, Jordan University of Science & Technology, Jordan
Submission: September 28, 2020; Published: October 06, 2020
*Corresponding Author:Hashem R. Al-Masaeid, Department of Civil Engineering, Jordan University of Science & Technology, Jordan
How to cite this article: Hashem R. Al-Masaeid, Anaal A. Al-Zghoul. Impact of Geometry and Traffic on Urban Arterial Accidents. Civil Eng Res J. 2020; 10(5): 555798.DOI 10.19080/CERJ.2020.10.555798
Abstract
Major urban arterial streets in large cities are experienced a serious traffic accident problem. This study attempts to investigate the possible effect of traffic volumes and arterial geometry on traffic accidents, where arterials in Amman city were selected as a case study. Based on a set of predefined criteria, eight major urban arterial segments were selected. The number of traffic accidents and traffic volumes were obtained from the Public Security Directorate and Greater Amman Municipality, respectively, for the period from 2015 to 2017. Other geometric and operational data were obtained through field survey. The total sample sizes for daily and hourly accidents consisted of 1407 and 33768 observations, respectively. Negative Binomial regression model was used to investigate the impact of urban arterial traffic volumes and geometric design variables such as, segment length, number of horizontal curves, lane width, median width and land use on hourly and daily traffic accidents. Two models were developed to predict hourly and daily traffic accidents using Negative Binomial regression. The results indicated that traffic accidents increase with the increase in traffic volume and arterial segment length. On the other hand, the results revealed that an increase in lane and median widths would reduce the expected number of accidents. Compared with residential areas, the results showed that arterials straddle commercial areas had higher number of accidents.
Keywords: Urban arterials; Traffic volume; Accidents; Geometry; Negative binomial; Jordan
Introduction
During the past years, there has been a fast increase in demand for transport, which led to growth in traffic volume and aggravation of some problems in society like a substantial increase traffic accidents and air pollution. Traffic accidents constitute a serious problem facing all countries in the world due to its direct and significant effects on human losses and limited economy resources. In 2015, the World Health Organization (WHO) reported that 1.2 million deaths and 20-50 million injuries were caused by traffic accidents in the world [1]. In Jordan, the Jordanian Traffic Institute indicated that the number of registered traffic accidents for the year 2017 was 150226, which resulted in 685 deaths and 16246 injuries, in addition to 308 JOD million (435 million US$) as the financial cost of these accidents. Thus, road traffic accidents (RTA) are a major health and safety problem in Jordan. Reducing RTA has always been one of the most important tasks for traffic engineers in Jordan. However, more than 60% of these accidents have occurred in urban areas, specifically along major arterials. As such, it is instructive to study traffic accidents along major urban arterials in urban areas, which are subjected to high traffic volumes. Identifying the impacts of traffic volumes and geometric characteristics on accident occurrences would help traffic engineers and urban planners to reduce accident and provide a safe environment. Thus, the objective of this study was to investigate the effect of traffic volumes and geometric design variables on traffic accidents along major urban arterials. The scope of this study is limited to major arterial in Amman city, the capital of Jordan. Traffic volumes and accident data during the summer period in 2015 through 2017 were investigated in the study.
Literature Review
Several studies have focused on accidents along urban arterials to reduce the problem of traffic accidents and develop measures to curb this problem. For example, one study investigated traffic accident frequency along arterials in Washington State [2]. The study concluded that accident frequency increases with the increase in the average annual daily traffic volumes (ADT) per lane. Also, other study investigated traffic accidents along central arterial in Central Florid [3]. The result of analysis revealed that an increase in average daily traffic per lane increases the likelihood of accident frequency. In Canada, a study was carried out to examine the effect of many traffic and geometric variables on the safety of urban arterials in the Greater Vancouver Regional District, British Columbia [4]. The results showed variables that had a significant impact on the occurrence of accidents were the traffic volume, length of the segment, un-signalized intersection density, driveway density, pedestrian crosswalk density, number of traffic lanes, type of median, and nature of land use. However, most of studies have demonstrated that AADT is the most important variable of the various arterial’s characteristics in terms of effects on road accidents [5].
Other studies have focused on specific types of accidents to explore possible measures to reduce the related accidents. For example, studies investigated the impact of traffic, geometric, and environmental / land use variables that contribute to increasing the frequency of pedestrian accidents on urban arterial midblock in Irbid city, Jordan [6]. The results indicated that urban arterial segment length, peak-hour volume, on-street parking, and percentage of space frontage had significant effects on the number of arterial accidents. On the other hand, previous studies highlighted methodological issues in traffic accident analysis. Previous studies have used a variety of models such as Poisson regression [7], Negative binomial regression [6,8], and regression analysis [5,9]. Moreover, studies indicated that, with most crash data being in the form of non-negative integers, Poisson regression is mostly a starting point for any regression model [10,11]. Poisson regression modeling is a technique that overcomes the ordinary least square requirement for constant variance and normal distribution. However, Poisson regression models restrict the mean to be equal to the variance, which may result in biased and inconsistent coefficient estimates in the presence of overdispersed data. The negative binomial (NB) regression model, which is an extension of the Poisson regression model, is able to overcome the deficiency of possible over-dispersion in the data. An over-dispersion parameter is introduced in the NB model to account for dispersion in the data.
Methodology and Data Collection
For the purpose of this study, eight 6-lane divided major urban arterial segments were selected. Segments were selected based on a set of predefined criteria. These criteria included; first, the selected segment should be located between two signalized intersections equipped with video camera that recorded traffic movements in a continuous basis. This criterion was adopted to obtain accurate volumes. Second, the segment should not be subjected to any physical improvements during the investigated period 2015 through 2017. Third, the segment and surrounding area should be mature. The last criterion was important to avoid any impact of work zone or change in land use on accident occurrences. Finally, traffic volumes and accidents were investigated in summer seasons to ensure high variability in traffic and avoid possible impact of weather conditions.
Based on the previous criteria, traffic volumes and accidents were obtained for each segment for two months in each summer of 2015 through 2017. To avoid the effect of intersection related accidents, each segment is started or end at 50 m from each signalized intersection. Traffic accidents on hourly and daily basis for the selected segments were obtained from the Public Security Directorate (PSD), Central Traffic Department (CTD), and Jordan Traffic Institute (JTI) based on Global Position System (GPS). Also, traffic volumes on hourly and daily basis were obtained from video camera records of Greater Amman Municipality (GAM). For all segments, the total collected data included 1407 daily records, which comprised 33768 hourly observations. Finally, geometric design variables for each segment were obtained through field survey; which included lane width, median width, segment length, number of horizontal curves, posted speed limit, density of access points, and land use. (Table 1) presents the characteristics of the selected segments [12].
In traffic accident modelling and analysis, traffic accidents data will be subjected to statistical analysis and the best model will be adopted. The Statistical Package for Social Science (SSPS) will be used in developing daily and hourly accident models and investigates the impact of the included traffic and geometric variables on traffic accidents.

Analysis and Results
Data Characteristic
(Table 2) presents the statistical characteristics of the collected data. As shown, the hourly traffic volume (HV) varied from about 98 to a maximum of 6432 veh/hr. Daily traffic volume (ADT) varied from 13013 to 79914 veh/day, while daily traffic accidents varied from 0 to 17 acc./day. On the other hand, half of the selected segments are straddle commercial areas (Comm.), and the remaining passed through residential areas. Most of selected segments had a straight alignment except two segments had 1 and 2 horizontal curves (HC). Also, the total length of all selected segments is more than 9 km, where the length (L) of each segment varied from 600 to 2000 m, with average segment length of 1.15 km. Median width (MW) varied from the minimum 1.2 to a maximum of 3.5 m, Lane width (LW) varied from a minimum 3.15 to a maximum value of 4.7 m, and density of access points (AP) varied from a minimum of 0 to 7.14 access per km. On the selected segments, speed limit (SL) varied from 40 to 70 km/ hr. Finally, correlation analysis revealed that there was a high correlation between speed limit and segment length, as well as between density of access points and lane width. Compared with residential areas, field observations revealed that density of access points are very large in commercial areas.

Variations of Traffic Volumes and Accidents
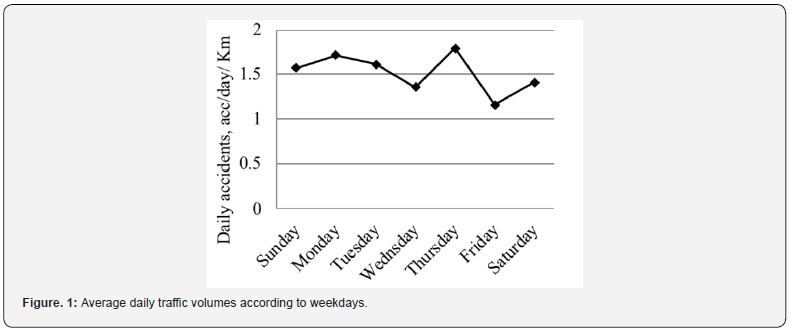
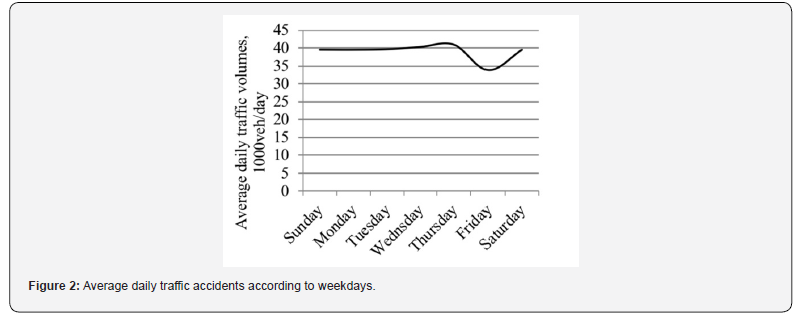
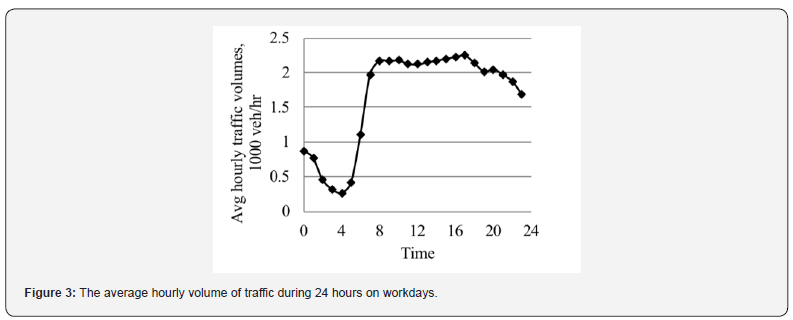
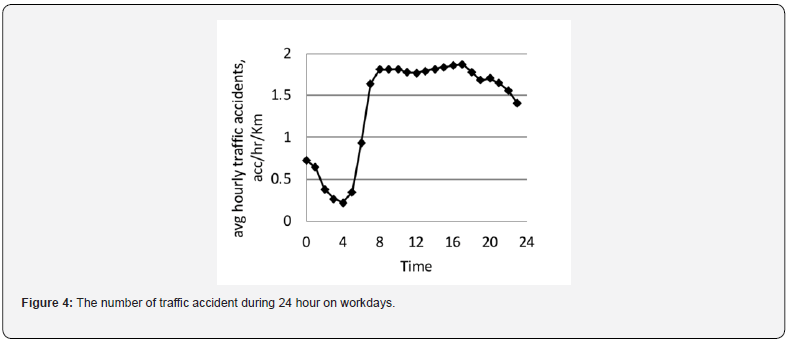
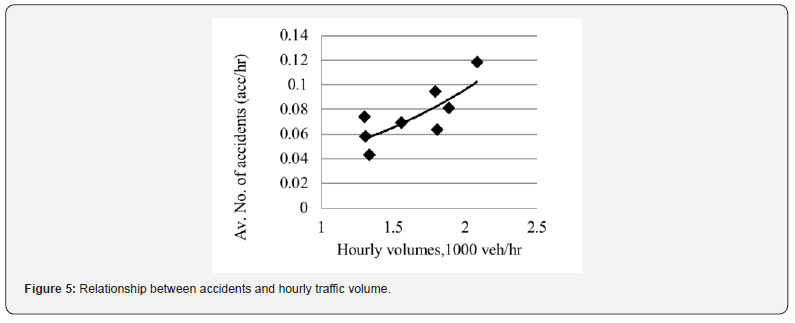
(Figure 1) shows daily traffic volume variations for the included urban arterials segments. It is clear that Friday exhibited the lowest daily traffic volume. On the other hand, (Figure 2) illustrates variations of daily traffic accidents on the investigated segments. Similar to traffic volume variations, Friday experienced the lowest accident rate, while Thursday had the highest accident rate. For the selected arterial segments, (Figures 3 & 4) show variations of hourly traffic volume and accidents on a typical workday. Clearly, there is a great correspondence between traffic volume variations and the resulted observed accidents. Thus, hours of high traffic volumes are associated with high hourly accident rate. Based on the collected data, (Figure 5) indicates that the relationship between hourly volume and traffic accidents had approximately an exponential form.
Development of Arterial Accident Models
Linear regression could be used if traffic accidents are normally distributed. Using Kolmogorov Smirnov test, it was found that hourly and daily accidents data did not fit the normal distribution. Therefore, generalized linear models, such as Poisson or Negative binomial should be tested to select an appropriate model. However, (Table 1) indicates that variances of daily accidents and hourly accidents means are larger than their corresponding means; thus, the use of Poisson will result in biased model coefficients. As such Negative binomial model is the best choice to model daily and hourly accidents. Using Negative binomial regression, the following daily and hourly accident models were developed:
DACC=EXP (.021(ADT))-.176(LW).832(L)-.331(MW)-.270(HC)
HACC=0.093*EXP(.001HV-.39LW+.671L-.562MW-.214HC+.475LU
Where:
DACC = Number of accidents per day
HACC = number of accidents per hour
ADT : Daily traffic volume, thousand veh./day
HV : Hourly traffic volume, thousand veh./hr.
LW : Lane width, m
L : arterial segment length, km
MW : Median width, m
HC : Number of horizontal curves, and
LU : Land use (0 for residential areas, and 1 for arterials straddle commercial areas).
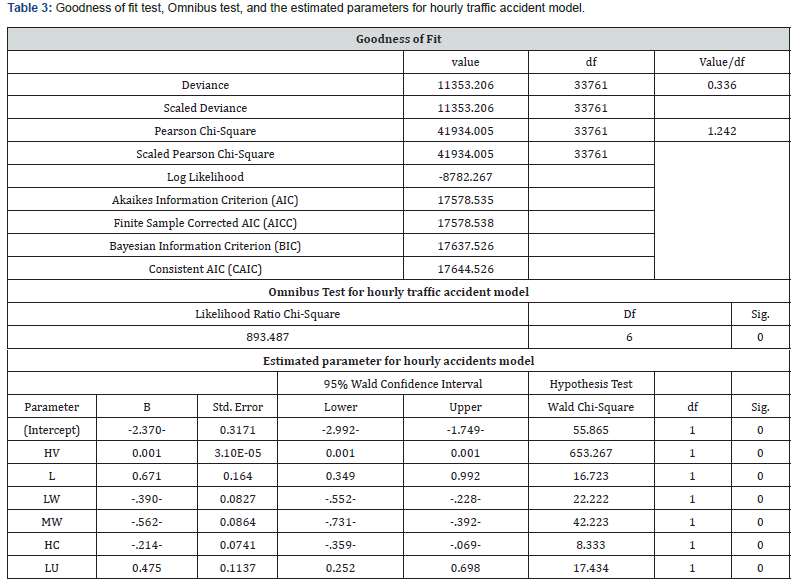
Both of the above regression equations and their parameters were found to be significant at 95 percent confidence level. (Table 3) illustrates the goodness of fit test, omnibus test, and parameters estimates for the hourly accident model. It is worth mentioning that the presence of multicollinearity between speed limit and segment length, and between density of access points and lane width or land use reduced the impacts of speed limit or density of access points on traffic accidents as a result of confounding effect.
Discussion
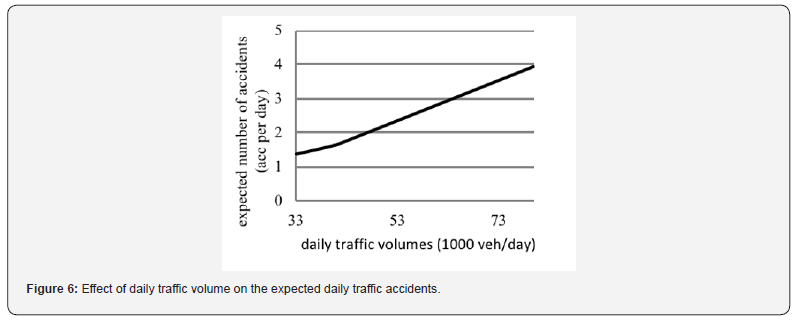
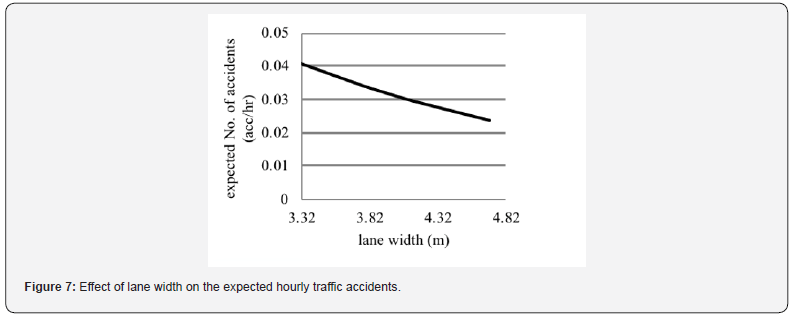
The results of modelling suggest that an increase in the traffic daily volumes, as shown in (Figure 6), would result in an increase in hourly accidents by a factor of 1.021, given that the other variables are held constant. This is an expected result as large traffic volume increases vehicle-vehicle interactions and ultimately would increase accident risk. This result is consistent with the cited findings [7-10 & 13-15]. The same results would be obtained if the hourly accident model was used. However, the factor would be 1.001 instead of 1.021. The parameter estimate for lane width was found to be significant with a negative coefficient, indicating that wider lanes are associated with lower number of accidents. These results are logical and suggest that an increase in the lane width as shown in the (Figure 7) will result in a decrease in traffic accidents by a factor of 0.677, given that the other variables are held constant. The result is reasonable since wider lane (WL) provide the freedom of vehicles movement and reducing the probability of side-swipe collisions. Clearly, this result is consistent with findings of several previous studies [14,16]. Also, the same results would be obtained if the daily number of accidents model is used, but the reduction in daily accidents would be 16% instead of 32%.
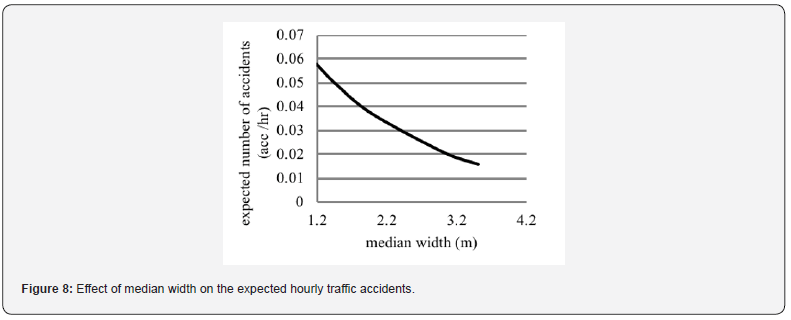
The median width variable was found to have a significant impact on the hourly number of accidents. The negative sign of the coefficient suggests that wider median decreases the number of accidents by 43% when increasing the median from 1.2 to 3.5 m, as shown in (Figure 8). Median prevents opportunities of opposite traffic collision as a result of errant vehicle from opposite side and gives more safety to pedestrian when crosses arterials. Again, this result is compatible with the results cited in literature [7]. The result of hourly accident model is consistent with the results of daily number of accidents model. However, daily traffic accidents would be reduced by a factor of 28% when increasing the median width from 1.2 to 3.5 m. Segments length was found to be significantly affected the expected number of hourly accidents. The results indicate that an increase in arterial segment length would increase the expected number of accidents. The result is expected since the level of accident risk is associated with the traveled distance as exposure measure [15].
The effect of the number of horizontal curves was investigated in this study. The results indicated that there is a negative association between the number of horizontal curves (HC) and the expected daily number of accidents. This result is intuitive because the presence of HC would reduce the vehicle speeds [5]. The positive sign of land use variable indicates that road segments straddle commercial areas would increase the number of crashes by a factor of 1.608. This result is consistent with the results of previous studies [2,10,17]. It is worth mentioning that commercial areas are characterized by a high number of access points. This variable was not included in modelling because it had high collinearity with lane width [18-23]. Probably, the increase in access points would increase the interactions among vehicles, and ultimately would increase the number of accidents.
Conclusion
This study explores the impact of geometry and traffic volumes on major urban arterial accidents. Results of analyses revealed that periods experience high traffic volumes at daily or hourly levels are associated with high traffic accidents. The study indicated that Thursday experienced the highest traffic volume and accident rates; while Friday had the lowest traffic volume and accident rates. The Negative binomial regression was found to be suitable to model hourly and daily traffic accidents along urban arterials. Empirical data and modelling indicated that urban arterial traffic accidents increase with the increase in traffic volume level, segment length and affected by the type of land use. Compared with residential land use, arterials straddle commercial areas had high accident rates. On the other hand, accidents were found to decrease with the increase in arterial median width, number of horizontal curves (HC), and width of traffic lanes. These results were found to be compatible with results cited in literature. These results would help traffic and planning engineers to adopt measures that reduce urban arterial traffic accidents.
References
- Abdel-Aty MA, Radwan AE (2000) Modeling traffic accident occurrence and involvement. Accident Analysis and Prevention 32(5): 633-642.
- Al-Masaei HR, Suleiman G (2004) Relationship between urban planning variables and traffic crashes in Damascus. Road and Transport Research 13(4): 63-73.
- Al-Masaeid H R, Obaidat MT, Gharaybeh FA (1997) Pedestrian accidents along urban arterial midblocks. Journal of traffic medicine 25(3-4): 65-70.
- Al-Zghoul A (2019) The impact of urban street traffic volumes on traffic accidents. MSc thesis, Civil Eng. Dep., Jordan Univ. of Science and Technology, Irbid, Jordan.
- Banihashemi M (2016) Effect of horizontal curves on urban arterial crashes. Accident Analysis and Prevention J 48(1): 20-26.
- Bowman BL, Vecellio RL (1995) Vehicle and pedestrian accidents model for median locations. J. of Transportation Engineering 12(6): 531-537.
- Bonneson J, McCoy P (1997) Effect of median treatment on urban arterial safety an accident prediction model. Transportation Research Record J. Transp. Res. Board 1581(1): 27-36.
- Das A, Abdel-Aty MA (2011) A combined frequency-severity approach for the analysis of rear-end crashes on urban arterials. Safety Science 49(8-9): 1156-1163.
- Dickerson A, Peirson J, Vickerman R (2000) Road accidents and traffic flows: an econometric investigation. Economica 67: 101-121.
- EI-Basyouny K, Sayed T (2009) Accident prediction models with random arterial parameters. Accident Analysis Prevention J. 41(5): 1118-1123.
- Gomes V (2013) The influence of the infrastructure characteristics on urban road accidents occurrence. Accident Analysis and Prevention J. 45(2): 289-297.
- Greibe P (2003) Accident prediction models for urban roads. Accident Analysis and Prevention J 34(1): 1-13.
- Shankar V, Milton J, Mannering F (1997) Modeling accident frequencies as zero -altered probability processes: an empirical inquiry. Accident Analysis and Prevention J 29: 829-837.
- Hadi A, Aruldhas J, Chow F, Wattleworth A (1993) Estimating Safety Effects of Cross-Section Design for Various Highway Types Using Negative Binomial Regression. Transportation Research Record J., 1500, TRB, National Research Council: 169-177.
- Sawalha Z, Sayed T (2001) Evaluating safety of urban arterial roadways. Journal of Transportation Engineering 31(2):151-158.
- Yanmaz-Tuzel O, Ozbay K (2010) A comparative full Bayesian before-and-after analysis and application to urban road safety countermeasures in New Jersey. Accident Analysis and Prevention 42(6): 2099-2107.
- Wang X, Liu H, Yu R, Deng B, Chen X et al. (2014) Exploring operating speeds on urban arterials using floating car data: case study in Shanghai. J. Transportation. Engineering 46(9): 401-444.
- Jones B, Janssen L, Mannering F (1991) Analysis of frequency and duration of freeway accidents in Seattle. Accident Analysis and Prevention J. 23(4): 239-255.
- (1981-2017) Jordan Traffic Institute. Yearly Reports of Traffic Accidents in Jordan (1996-2017), Ministry of Interior, Public Security Directorate, Amman, Jordan.
- Lord D, Mannering F (2010) The statistical analysis of crash frequency data: A review and assessment of methodological alternatives. Accident Analysis and Prevention J 42(5): 291-305.
- Miaou SP, Lum H (1993) Modeling vehicle, accidents and highway geometric design relationships. Accident Analysis and Prevention J. 25(6): 689-709.
- Moomen M, Rezapour M, Raja M, Ksaibati K (2019) Evaluating the safety effectiveness of downgrade warning signs on vehicle crashes on Wyoming mountain passes. Cogent Engineering 6(1).
- (2015) World Health Organization Global status report on road safety 2015. World Health Organization.


