Influence of Vegetation on Shear Stress and Flow Rate in Open Channel using Flow3D
Ali Reza Taheri Fard*
Peter the Great St. Petersburg Polytechnic University, Russia
Submission: December 30, 2019; Published: February 24, 2020
*Corresponding Author:Ali Reza Taheri Fard, Peter the Great St. Petersburg Polytechnic University, 29 Politechnicheskaya St., St. Petersburg, 195251, Russia
How to cite this article: Ali Reza Taheri Fard.Influence of Vegetation on Shear Stress and Flow Rate in Open Channel using Flow3D. Civil Eng Res J. 2020; 9(5): 555774. DOI: 10.19080/CERJ.2020.09.555774
Abstract
The flow in the composite channel is different from the simple channel due to the strong flow exchange between the main channel and the flood plain. In this study, the flow pattern of composite channels under non-vegetated and parallel vegetation conditions was investigated. To investigate the effect of vegetation density on flow pattern, the ratio of the distance between plants to their diameter (L / D) was used. This ratio was assumed to be 3, 8 and 16. The results showed that the longitudinal velocity and average depth velocity in the main channel for the vegetation-less state were less than vegetation-state and the opposite was observed in the floodplain. In the vegetation-free state, as the main channel moves toward the floodplain, the average deep velocity decreases, and then increases in the joint season between the main channel and the floodplain, and then continues downward. In a parallel arrangement, by decreasing the L / D ratio in the floodplain, the longitudinal velocity, average depth velocity, shear stress, and flow intensity are reduced by 69%.
Keywords: Open channel; Flood plain; Vegetation, Average depth velocity; Shear stress
Introduction
Flood accidents account for approximately one-third of all financial losses worldwide. Analysis of the trend of accidents shows that in recent years such incidents have increased dramatically. In recent years, river engineers have been looking for a suitable solution to reduce the impact of floods. The critical role of floodplains in flood relief is significant and their reconstruction is being promoted [1]. The hydraulic flow exchange between the river channel and its floodplain is complex. In a relatively high discharge that engulfs the adjacent floodplain, the exchange of flow between the main channel and the floodplain results in rotational currents [2]. Traditionally, the presence of vegetation on the floodplain as a problem that disrupts flow capacity has been the focus of river engineers [3]. The presence of vegetation in the floodplains adds a degree of complexity to the analysis of composite channel flows and the amount of drag force applied by the flow to the plant cannot be ignored. Observing the riverbanks shows that plant growth in a row on the edge of a flood plain is a common arrangement [4]. A range of coastal plants may be used for shore sustainability, promoting environmental diversity or for creating scenic landscapes. Hubble [5] et al. Knowledge about the impact of vegetation on the flow structure is scarce at present. In order to achieve simultaneous protection against floods and environmental requirements, better awareness of the hydraulic flow in composite channels with vegetation is required. High-momentum rotational currents transmit the current from the main channel to the floodplain, which results in a decrease in transmission in the main channel and its increase near the floodplain. This phenomenon is known as the kinematic effect [6]. The relative depth of Dr is defined as the ratio of the flow depth in the floodplain (Hfp) to the water depth in the main channel (Hmc) [7]. Strong exchange was observed at a relative depth between 0.1 and 0.3 [8]. In composite channels like simple straight channels, rotational currents are caused by non-isotropic perturbations and their properties are influenced by many factors such as channel transverse geometry, shape ratio, relative depth and turbulence value. Tominaga and Nezu [9] performed experiments on a rectangular composite channel and concluded that the size and position of secondary flows were highly dependent on channel geometry [10]. The researchers identified a weak secondary current in the main channel and floodplain at a relative depth of Dr = 0.5, and a rotational current near the free surface of the current along the side wall of the main channel [11].
For the ratio of Dr = 0.75 the rotational flow of the floodplain becomes stronger and reaches the free surface, and the secondary flow near the free surface dominates the rotational flow of the main channel. Shiono and Knight [12] investigated the effect of cross-sectional shape on secondary currents in symmetric wide composite channels. They observed that, irrespective of the cross-section, the eddy currents spread across the floodplain, in addition, small eddy currents were observed at the corner of the floodplain. James and Makoa [13] conducted experiments in a simple straight channel with different vegetation patterns. They conclude that in patterns that increase the number of common seasons between vegetated and non-vegetated areas, resistance and consequently depth of flow increase. White and Nepf [14] measured velocity in a simple channel with vegetation. For the vegetation, 6 mm diameter rods were used. Their results showed that the longitudinal and transverse velocities of the flow varied with time. Hamidfar [15] conducted experiments on composite canals in two conditions with and without rigid vegetation in floodplains at three different relative depths and concluded that flow transfer capacity in the presence of floodplain vegetation due to lack of vegetation conditions decreases up to 31% lower [16]. Although previous studies have investigated the effect of hydraulic flow on composite channels and the effect of vegetation on it, first of all these are more in vitro studies and in vitro studies of harvesting velocity near the stem and between the two rows of plant stems (especially at high vegetation density). Is limited, and secondly, numerical studies on the composite channels have been carried out in vegetative state [17]. Therefore, in this research, the effect of vegetation density with parallel arrangement and depth ratio on flow pattern, longitudinal and mean depth velocities, flood flow through flow rate and shear stress is investigated using Flow3D model.
Method and Experiments
The Flow3D model is one of the most powerful models in fluid dynamics. This model can analyze one-, two- and threedimensional flow fields and has a wide range of applications in fluid problems. The basic equations used in this model are Navier- Stokes equations and use five different turbulence models to solve the turbulent flow properties. The solution network in this model consists of rectangular cubic cells [18]. This type of network may be considered a limitation at first glance, however, because of its easy production of this type of network and secondly, proper order and less memory need to be resolved, this solution is an advantage. The Flow3D model is particularly applicable in the field of hydraulic structures and has provided acceptable answers in this regard. For model validation, the results of the experiments of Younesi et al. [19] was used. The researchers conducted their experiments in the prismatic composite channel with no vegetation. In this study the main channel width (Bmc) and flood plain (Bfp) were 0.4 m and main channel height was 0.18 m. Flow conditions for model validation are: Flow depth in main channel (Hmc) 0.027 m, Flow depth in flood plain (Hfp) 0.07 m, Flow discharge (Q) 0.0615 m3/s, Depth ratio (Dr ) Is 0.35 and the longitudinal slope of the channel is 0.00088. These parameters are shown in Figure 1. It should be noted that Figure 1 is associated with vegetation for the present study and Yonesi et al. [19] was without vegetation.

Flow 3D software considers the ks factor as equivalent roughness. . In research (3102) Yonesi et al. The average particle diameter of the wall was D50 = 0.65 mm, so using the Strikler (1923) and Ackers (1991) equations, the ks value is found to be 0.00219 m, which was used in the simulation. In the present study, since the composite channel cross-section is symmetrical, the simulation was performed in half of the cross-section and according to Figure 1, the origin of the coordinates in the center of the main channel was selected. Two RNG and LES perturbation models were evaluated. The boundary conditions at the inlet of the volumetric discharge, at the specified pressure output together with the determination of the water level, for the midsection of the main channel and model surface, the symmetry conditions and for the wall conditions, were selected. It should be noted that in the first few simulations the output discharge conditions were selected for the output, which was changed to the specified pressure due to the change in flow depth of this boundary condition. The simulation time was between 250 and 300 seconds until the stability conditions were reached. After validation, the model was run for different flow conditions with and without vegetation. Vegetation diameter (D) 3 cm and parallel arrangement were selected for vegetation cover. The spacing between the plants in each row is 12 cm and the distance between the rows (L) varies (Figure 1). In order to investigate the effect of vegetation density on flow pattern, the ratio of distance between plants to their diameter (L / D) was used. This ratio was chosen as 3, 8 and 16. The various flow conditions are shown in Table 1. N.V symbols indicate conditions with no vegetation and P.V with parallel vegetation.

Result and Discussion
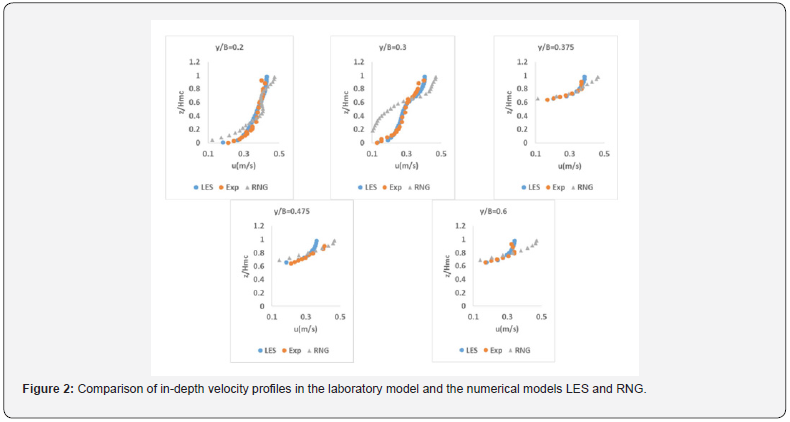
After selecting and executing the model with several cell sizes, which was a very time-consuming task, finally the cell size was selected in all directions in 1 cm vegetative state. In the initial simulation, several lengths were selected for the composite channel and finally 20 m for the channel was assured. Depth velocity profiles were used to validate the model. Figure 2 shows the comparison of the depth velocity profile in the laboratory and numerical models of RNG and LES at different distances from the coordinate center. The parameters z, B and y are half the width of the composite channel, the distance from the floor, and the distance from the center of the main channel, respectively, to the transverse direction. As shown in this figure, near the floodplain (y / B = 0.3), a deviation in velocity profile is created at the inlet edge of the floodplain (z = 56.0 = 56.0), which is well illustrated by the LES turbulence model. This has been proven by some researchers in previous research [15,19]. As illustrated in this figure, the LES turbulence model fits better with the experimental data Figure 3.

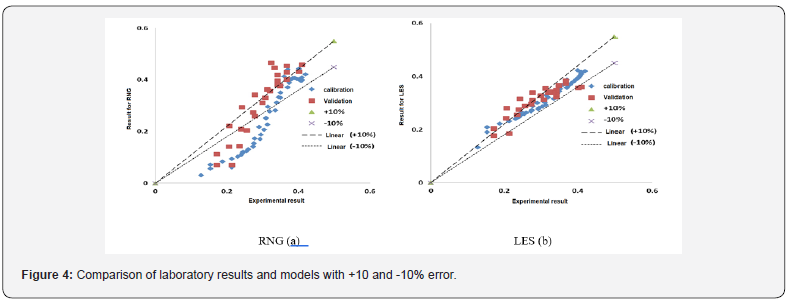
As shown in this figure, the results of the LES model are in better agreement with the experimental results than the +10 and -10% errors. In order to better evaluate the results of the two models, correlation coefficient (2R) and RMSE error function were used to compare the longitudinal velocities of the models with the experimental results. After investigation, the correlation coefficient and error function of RMSE at calibration stage for RNG model were 0.71 and 0.078 m / s respectively and for LES model were 0.95 and 0.015 m / s respectively Figure 4. The results are better than the LES model, so this model was chosen for the simulation. Since the calibration of the model is performed in vegetation-free state and it is possible to make an error in estimating the vegetation-state accurately, it is recommended that sufficient data be available. After selecting the perturbation model, the model was run for different scenarios including vegetation. In the vegetation state, the size of the cells was 0.5 cm based on the diameter of the vegetation. Figure 5 shows a flow plan around two successive stems for Dr = 0.25 at the middle depth of the flood plain. As is evident at L / D = 3 due to the low distance between the vegetation rows, the sequence is not fully formed. With the increase in row spacing at L / D = 8 the sequence has been partially completed, but the subsequent flow lines have not yet become parallel to each other. At L / D = 16, the sequence is fully formed due to the long distance of the vegetation lines. Figure 6 shows the longitudinal velocity variations across the composite channel for different depth ratios under vegetation-free conditions.

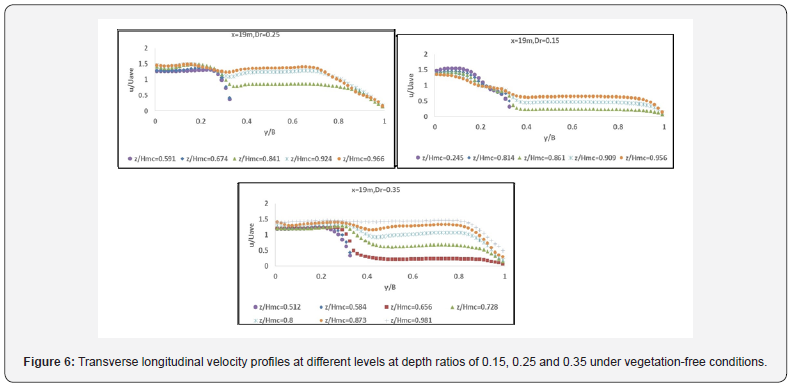
The u and uave parameters are respectively the longitudinal velocity and the average velocity in the composite channel. Speed values in the distance 19 meters from the canal entrance. As observed in all three depth ratios of 0.15, 0.25 and 0.35, the flood velocity in the flood plain decreases relative to the flow rate in the main channel. Another point to be drawn from these figures is that as the distance from the floor increases, the u / Uave ratio in the floodplain increases and the flow rate approaches the main channel. In other words, the effect of flood plain decreases with the distance from the floor to the flood plain. Of course at a depth ratio of 0.15, because the depth and velocity of flow in the floodplain is low, so the flow velocity near the surface in the floodplain will also be less than the surface flow velocity in the main channel, but at two other depth ratios (0.25 And 0.35), as we approach the flow surface, the flow velocity in the main channel and the floodplain approach each other. Another difference at the relative depth of 0.15 relative to the other two depth ratios is that in the main channel, unlike the floodplain, with the distance from the floor, the velocity ratio decreases.
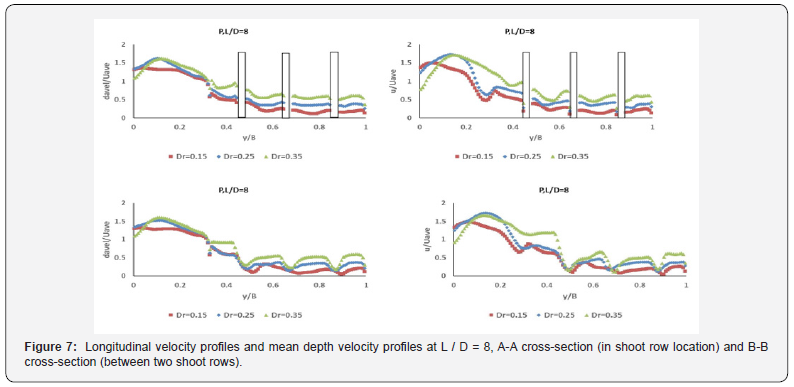
Figure 7 shows the changes in the mean and longitudinal depth velocities at the middle depth of the flood plain at the plant stem rows (Figure 1a) and between the two plant stem rows (BB section) for L / D of 8 and at different depth ratios (Dr ) it shows. As shown in this figure, unlike vegetation conditions (Figure 6) in vegetation mode, the maximum longitudinal and mean depth velocities do not occur in the center of the main channel (y / B = 0) and the presence of vegetation increases the velocity. At y / B = 0.1 it becomes the center of the main channel. Then, as the flood plain approaches, the velocity decreases and reaches an almost constant value. Also, in the vegetation row location (a and b) and between the two rows (c and d), with increasing Dr depth ratio, both longitudinal and mean depth velocity increase.
In Figure 7, although there is no vegetation in section B-B, a slowdown is seen in the floodplain due to the sequence that occurred below the cylindrical stem A-A. Figure 8 shows the variation of the longitudinal velocity at different vegetation densities (different L / D) and comparison with the vegetationfree state. At a depth ratio of 0.15 at both A-A and B-B sections, the longitudinal velocities of the main channel at approximately different vegetation densities are approximately the same and decrease with entry into the floodplain. Within the floodplain, it can also be said that at this depth ratio, the velocities are close to L / D = 3 and L / D = 8 and both are less than L / D = 16.
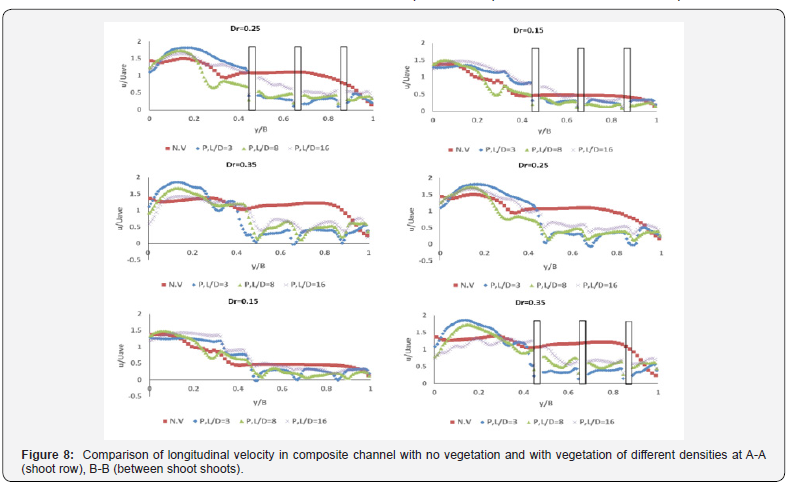
But with increasing depth ratio (depth ratio of 0.25 and 0.35), the effect of vegetation is clearer. By decreasing vegetation density from L / D = 3 to L / D = 16, the longitudinal velocities within the main channel decrease while this result is within the flood plain. Therefore, it can be said that increasing vegetation density increases the longitudinal velocity in the main channel and decreases it in the flood plain. This result is consistent with the results of Hamidifar and Omid (201). Also, when the flow depth in the composite channel is low (depth ratio of 0.15), the effect of vegetation on the longitudinal velocities is low, as the difference in velocities in vegetation and No vegetation (NV) is low, but at high depth ratios (0.25 and 0.35), the presence of vegetation drastically reduces the values of longitudinal velocity in the floodplain compared to the no vegetation state. It can be concluded that the effect of vegetation on flow pattern at high depth ratio is more than low depth ratio.
Figure 9 also shows the mean depth velocity variations at different vegetation densities and comparison with the vegetation-free state. The results of this figure are like Figure 8. The point in this figure is that, in the vegetation-free state, by decreasing the center of the main channel and approaching the floodplain, the mean average velocity is reduced and reaches its minimum value at the boundary between the main channel and the floodplain. . Immediately after entering the flood plain, the average depth velocity suddenly increased and then continued its downward trend and then stabilized. In the case of vegetation in the floodplain, an increase in mean deep velocity occurred in the main channel and a sudden increase in velocity in the common channel between the main channel and the floodplain has disappeared.
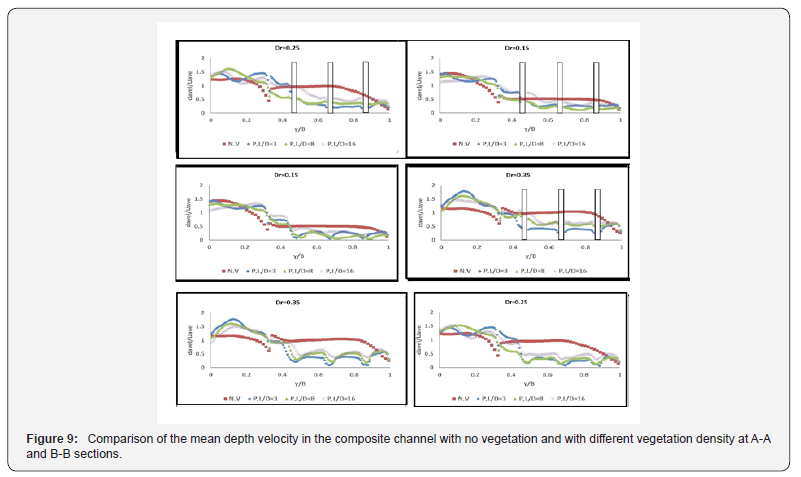
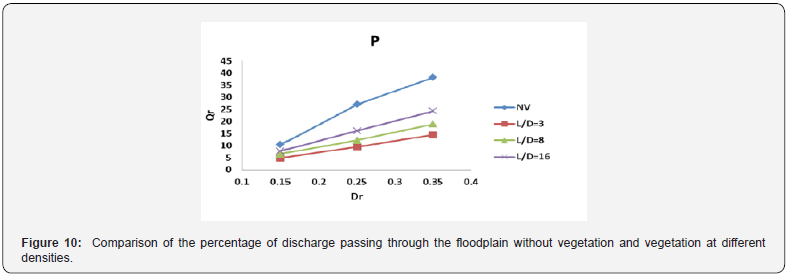
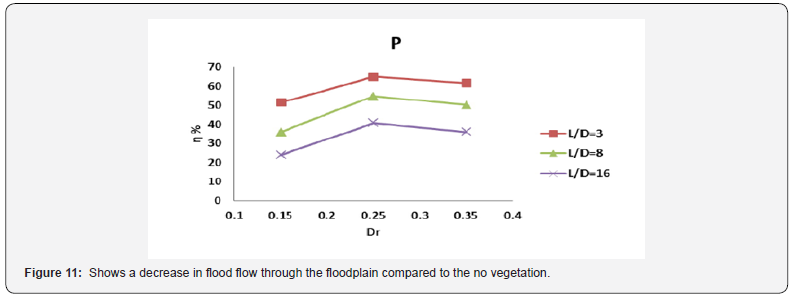
Figure 10 shows the flow-through ratio of the floodplain (Qr) for the two vegetation-free and vegetated-state conditions with different densities. As can be seen, with and without vegetation, the ratio of discharge through the floodplain increases with increasing depth ratio (Dr). Also, by decreasing vegetation density (increasing L / D from 3 to 16), the flow rate of flood plain increases. This increase is different at different depth ratios, because with decreasing vegetation density, the increase in the flow rate in floodplain at 0.35 is greater than the depth ratio of 0.25. As is evident at high vegetation densities (L / D = 3), the largest decrease occurs in the flow rate of the floodplain. To justify this result, it can be said that in the floodplain with high vegetation density, roughness and consequently resistance to flow increases, which results in a decrease in velocity and consequently a decrease in the floodplain Figure 11.
Also, at each vegetation density with increasing depth ratio, the rate of decreasing of the passing flow is first ascending and then decreasing and reaching its maximum value at 0.25 depth ratio. However, at the L / D = 3 and depth ratio of 0.25, the highest reduction in the flow rate occurs at about 65%. Figure 12 shows the shear stress of the main channel and flood plain in two vegetation and vegetation with different densities. As can be seen from the floodplain roughness, shear stress in the floodplain increased compared to the unshaded state.
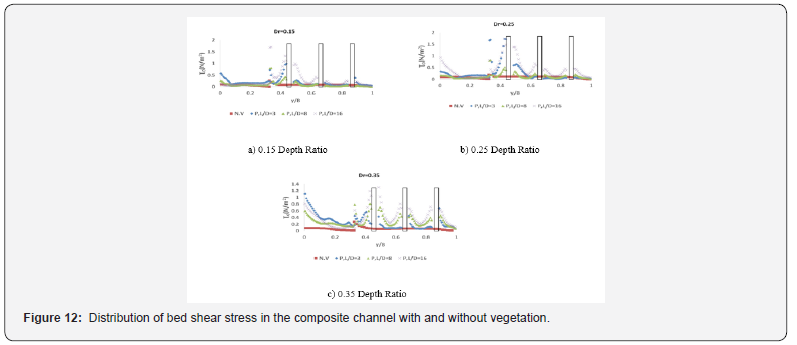
Also, at different depth ratios, the bed shear stress decreases as the main channel approaches the floodplain, and for all situations at the joint boundary between the main channel and the floodplain, a sudden jump in bed shear stress occurs due to momentum transfer between the channels. The main and flood plain. These results are consistent with those of other [9, 15, 20]. As it enters the floodplain, shear stress increases around each vegetation and then decreases in the distance between the two vegetation. This increase is minimal in the vicinity of the vegetation near the edge of the floodplain and minimal in the vegetation near the composite canal wall. Also, another point inside these shapes is that within the flood plain, shear stress increases with decreasing vegetation density (increasing vegetation row spacing).
Conclusion
In this paper, the effect of parallel arrangement of rigid vegetation on flow pattern in composite channel was investigated using Flow3D software. Vegetation density (L / D) was selected as 3, 8 and 16. The results show that the longitudinal and mean depth velocity in the main channel is less than in the vegetated state and the opposite is true in the floodplain. Furthermore, in parallel arrangement, with increasing L / D ratio, the longitudinal and mean depth velocities decrease. The highest reduction in the flow rate through the flood plain occurred at a depth of 0.25 and a L / D ratio of 3% at 65%. Decreasing vegetation density also leads to increased shear stress.
References
- Muravyeva L, Vatin N (2014) Application of the Risk Theory to Management Reliability of the Pipeline - Applied Mechanics and Materials.
- Nikolai V, Nikolai L, Nikolai K (2014) Hydraulic Method and a Device of Fish Protection at Water-Intake from the Mountain Rivers - Applied Mechanics and Materials.
- Vatin N, Nikolai L, Loginov G (2016) Processes at Water Intake from Mountain Rivers into Hydropower and Irrigation Systems. MATEC Web of Conferences.
- Terrier B (2010) Flow characteristics in straight compound channels with vegetation along the main channel. PhD Thesis. Department of Civil and Building Engineering, Loughborough University.
- Hubble T, Docker B, Rutherfurd I (2010) The role of riparian trees in maintaining riverbank stability: A review of Australian experience and practice. Ecological Engineering 36(3): 292-403.
- Liudmila M, Nikolai V (2014) Pipelines Stability under Extreme Hydrodynamic Conditions - Applied Mechanics and Materials.
- Nikolai V, Nikolai L, Gennadi L (2016) Processes at Water Intake from Mountain Rivers into Hydropower and Irrigation Systems - MATEC Web of Conferences.
- Knight DW, Shiono K (1996) River channel and floodplain hydraulics. In Floodplain Processes. Anderson MG, Walling DE Bates PD (Ed). J Wiley.
- Tominaga A, Nezu I (1991) Turbulent structure in compound open-channel flows. Journal of Hydraulic Engineering 117(1): 21-41.
- Chechevichkin VN and Vatin NI (2014) Specifics of surface runoff contents and treatment in large cities. Magazine of Civil Engineering 50(6): 67-74.
- Vatin NI, Chechevichkin VN and Chechevichkin AV (2010) Features of water purification from Vuoksa river during the summer period. Magazine of Civil Engineering 12(2): 23-26.
- Shiono K, Knight DW (1989) Transverse and vertical Reynolds shear stress measurements in a shear layer region of a compound channel. In Proc. 7th Symp. on Turbulent Shear Flows, Stanford, USA, p. 28
- James CS and Makoa M (2006) Conveyance estimation for channels with emergent vegetation boundaries. Proceedings of the Institution of Civil Engineers 159(4): 235-342.
- White B and Nepf H (2007) Shear instability and coherent structures in shallow flow adjacent to a porous layer. Journal of Fluid Mechanics 593(1): 1-32.
- Hamidifar H and Omid MH (2013) Floodplain vegetation contribution to velocity distribution in compound channels. Journal of Civil Engineering and Urbanism 3(6): 357-163.
- Nikolai V, Nikolai L, Alexandr S (2015) The Water Intake Facility for Diversion HPPs in Winter Operation Conditions in an Urban Area - Procedia Engineering.
- Ognjenović Z, Zafirovski, Nikolai V (2015) Planning of the Traffic System in Urban Environments Slobodan-Procedia Engineering.
- Shiono K, Knight DW (1991) Turbulent open channel flow with variable depth across the channel. Journal of Fluid Mechanics 222: 617-646.
- Yonesi HA, Omid MH, Ayyoubzadeh SA (2013) The hydraulics of flow in non-prismatic compound channels. Journal of Civil Engineering and Urbanism 3(6): 342-356.
- Rajaratnam N, Ahmadi R (1981) Hydraulics of channels with floodplains. Journal of Hydraulic Research 19(1): 43-60.


