Survey of Influence of Opening Area to Wall Area Ratio on Stiffness and Yielding resistance of Concrete Shear Wall System
Peyman Ghaderi and Allaedin Behravesh*
Department of Civil Engineering, Mahabad science and Research Branch, Islamic Azad University, Iran
Submission: May 11, 2018;Published: June 27, 2018
*Corresponding Author: Allaedin Behravesh, Department of Civil Engineering, Mahabad science and Research Branch, Islamic Azad University, Mahabad, Iran, Email: peyman.ghanderi99@gmail.com
How to cite this article: Peyman G, Allaedin B. Survey of Influence of Opening Area to Wall Area Ratio on Stiffness and Yielding resistance of Concrete Shear Wall System. Civil Eng Res J. 2018; 5(5): 555672. DOI:10.19080/CERJ.2018.05.555672
Abstract
The presence of openings in the concrete shear wall system reduce the power of the system in loading, so in this study first using a valid experimental specimen validity of results from an ANSYS software has been done. after ensuring the modeling and obtained results concrete frame with concrete shear wall system return function have been investigated using modeling the structures with different percentage of opening to whole of wall in ANSYS software and doing the non-linear static analysis (hysteresis) according to ATC 24 results from hysteresis analysis of models show the system power reduction and they’re complicity of the system collapse in energy dissipation in cycling loading.
Keywords: Architectural Credo; Cultural Beginning; Language’s transposition; Instinctive relation; Stimulus-reaction; Tectonised; Language’s phenomenon
Introduction
Millions of years have taken place in the world and will happen in the future as it has been in the past. This natural phenomenon becomes a major human calamity that occurs in a dense city with dense texture. The effects of this accident in the major earthquake in Iran, such as the 2003 bam earthquake and 2017 Kermanshah province, are not hidden. In spite of the knowledge of many factors occurring in this phenomenon, it is impossible to prevent this phenomenon from occurring with current human knowledge, but it is possible to reduce the effect of earthquake powerful vibration in the form of loss of damages, damages, and especially loss of life. Earthquake engineering has effects on the effects of earthquake on humans and its environment as well as the methods to reduce these effects. The study of the earthquake and its effects due to written documents belonging to the Japanese earthquake and the east Mediterranean region dates back to about 1,600 years ago. The history of earthquake studies in the active region of America is only about 200 to 350 years ago. But humans have been aware of this phenomenon for millions of years, but his experience and knowledge of earthquake science is much less than life expectancy. Earthquake engineering was born at the beginning of the 20th century and reached its full perfection at the end of it [1]. Since 1908 in Italy, the terms of seismic loading were initiated and implemented in many countries around the world. However, it has been 40 years before the seismic design relies on dynamic analysis of the structure. During the 1960 s, by the late 70 s, efforts have been spent mainly on reconciling the previous criteria and new findings and introducing the results of these reconciliation efforts. Besides knowing the nature of the earthquake and how to force power into buildings, what the earthquake force is capable of, the building itself and the system that has the necessary resistance to vibrations has been considered by the structural engineers. The development and development of a variety of mud structures from clay buildings to skyscrapers from brick and wood use to design vibration frames using concrete and steel and composite materials (composite) are all evidence of this issue. But what is important is the shaking design and the equations of equations present in the evolution path to design based on seismic performance of the structure. Something that has experienced a new field of seismic design and the necessity of research and searching in this field before the engineers of the structure [2]. The construction of shear walls in high and medium buildings and even in short buildings causes the building resistance to increase significantly and will also be the best way to control the lateral bracing of the buildings [3]. In most cases, shear walls are able to withstand the greatest contribution of the base cutting force, which significantly increases the stiffness of the building and significantly reduces the damage to non-slip elements, and also the shear walls can withstand the gravity loads of the building, even after accepting excess cracks. The columns lack such a property, and in general such factors make the shear walls more reliable than the frames. For resistance to lateral loads due to wind and earthquake, various systems have been proposed and are being used, such as frames, curtain systems, wall brackets (including concrete, steel and composite) and active and passive control systems, using dampers. Hardness and strength, ductility and finally the proper behavior of the system during the earthquake is one of the most important parameters for choosing a system of instruments. Today, one of the parameters that is considered in the modern attitude of researchers to the behavior of structures is the concept of energy in structures. Hysterical energy, which is lost after the event and is lost in the hysteresis rings, has a major effect on structural damage of the system and is the most important component of the energy equation for the structures. Therefore, controlling this amount of energy can lead to controlling the behavior of the structure and its degree of damage. According to the above description, the investigation of the seismic performance of the concrete expanded concrete system is of great importance in this study. The main objective of this paper is to investigate the seismic performance and the effect of the ratio of the area of the open area to the area of the wall on the performance of the concrete concrete frame system with concrete shear walls.
Background Research
In 2011, Mohammad Reza et al. (2011) investigated the influence of the pop - up site effect on the performance of reinforced concrete shear walls. Nowadays, housing has become one of the main concerns of the people and the state because of the increasing population of the country. Because of the lack of land, land value and construction of multi - storey buildings, the use of such structures has become very common in the world. In these structures, which are mainly used in the frame structural systems, one way to deal with the side forces due to wind or earthquake is the use of reinforced concrete shear walls. In addition to the appropriate behavior against the side forces, the reinforced concrete wall will cause economic growth. Researchers have studied many pop - up effects in the shear wall and describe the performance of the shear wall with the pop up [4]. Also, Amjad Mahdavi Pour et al. [5] studied the effect of the ratio and position of the opening on the concrete shear wall on the relative displacement of concrete structures in 2016. Most of the time, the shear wall is required to provide shivering responses to structures, but we encounter limited constraints when using a shear wall. Architectural or even mechanical constraints require computing engineers to determine the width of the wall. Especially in concrete structures with a central core, around the elevator room, in order to install the elevator door, we have to open the doorway in one of the walls, which affects the behavior of the shear wall will be effective. The ratio of the dimensions of the opening and also the percentage of the reinforcement used in the shear wall are the most important factors affecting the nonlinear behavior of the concrete shear wall. The percentage of openings in the shear wall is very important because a shear wall with different percentages of perforations differs from the side force in a different way. In order to investigate the effect of openings on the amount of seismic responses of concrete structures, shear structures are modeled in different situations in the 2000 SE 2000 software. The change in the level of openings, the instruments was subjected to static and nonlinear dynamic analysis and their results were examined. The results show that the presence of openings in the shear wall reduces the amount of base cutting, energy absorption and increases the amount of floor drain and reduces the structural capacity. The principles of designing a concrete shear wall using a bobbond model were also reviewed in 2015 by Reza Morshed and colleagues [1]. The presence of the opening, in particular, in the load transfer pathway, creates disturbances and greatly affects the wall’s behavior. Therefore, it is necessary to have the effect of opening the design in accordance with the layout of the model, which has entered the ACI-318 American Concrete Regulation since 2002 and, due to its similarity with the truss model, is also referred to as the truss model, distributive regions Disturbance of stress in concrete structures can be equated and analyzed with a truss [6]. Concrete structures: Various materials such as steel, wood, concrete and concrete may be considered as options for the construction of a building, and these options exist for many common structures, although in the construction of skeleton of high structures, it may be limited to steel and concrete Come back Yet today it is concretely an option. It is trusted to build many small and large structures, so that it can be considered as the most important building material in the world with a worldwide application. Concrete shear walls system: One of the most reliable methods for dealing with lateral forces is the use of reinforced concrete shear walls. Shear walls can be contracted according to architectural considerations in different parts of the plan of a building, but care should be taken to ensure that the plan is as symmetrical as possible.
Types of shear walls of reinforced concrete reinforced concrete
a) Rectangular shear wall with uniform sharing across the section.
b) Rectangular shear wall with concentrated reinforcement on the two ends of the wall.
c) Shear wall of shape or I.
In the shear walls the pop - up if the wall at its lowest point has one or more pop - up sides, each of the wall components at either side of the open wall or the wall of the wall that is located between the upper and lower Popup is called the copleh arrow. For the creation of single structural functions for the two adjacent structural walls, or for the components of the pop - up on the walls including large, high deformability is used as connected beams. In this case the walls attached to each other are referred to as closed walls. However, the connected beam width is at least 200mm
Types of failure in shear walls
A. Defeat due to the failure of the shear walls: In the destruction of the shear walls during past earthquakes, it has been shown that the four types of weaknesses are often the cause of such degradation. They must be identified in the design, and take the necessary measures to prevent it. These damages include:
a) Rotational degradation of the base of the foundation
b) Shear destruction
c) Slip destruction
d) Bending degradation
B. Defeat caused by the failure of the coulomb beam: In fact, the most important weakness in the shear walls is the poplar, the coulomb beams. These beams have a long, short and deep length and, if their thickness is low, they turn into deep beams that do not have a good effect. Coil beams are usually weaker than the walls, and due to lateral movement, bending of the walls is applied to the rotation of the walls at the wall of the beams. The same rotation produces a significant anchor and eventually flows through the beams. Seismic Reinforcement of Building Using Shear Wall: One of the methods of reinforcing concrete structures is the addition of a shear wall. As a result, adding only two or four shear walls reduces the vulnerability of all beams and columns. For this purpose, in alignment of the ceilings, appropriate fittings should be established by planting the bullet between the shear wall and the slab. Also, using bolt planting in a beam and a column and covering these elements in the concrete of the shear wall, it is possible to establish a good coherence between the wall and the existing structure.
Materials and Ways
Nonlinear static analysis: In this method, although forces are applied statically, it is expected that in many buildings (especially buildings with uniform distribution mass distribution in plan and height) nonlinear static analysis method, an appropriate estimation of the maximum response Identify the dynamic structures of the structure. After the system is modeled using the software and after the introduction of concrete specifications, the sections are assigned to the members. At the end of this step, a linear model is obtained from the system. Target displacement calculation: Target change (performance point) is the amount of displacement that is expected to be determined by the center of the earthquake’s roof crust with a specified level of risk and a level of performance. In this study, coefficients have been used to calculate target displacement. In this method, the structural capacity curve (structural element control point displacement curve) needs to be first obtained from nonlinear static analysis results. Therefore, the calculation of target shift in this method is of a repetitive nature associated with trial and error. The impact of the substructure, the effects of the twist and the half-arc in the amount of displacement of the target. In this study, the effects of twisting and breaking of the pivot are not considered and the diaphragm is considered rigid. Based on the Seismic Upgrading Instructions for existing buildings (Journal 360) and FEMA-356, the displacement of the target target is calculated from (1-3).
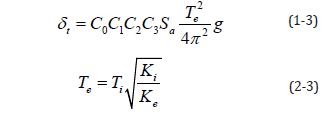
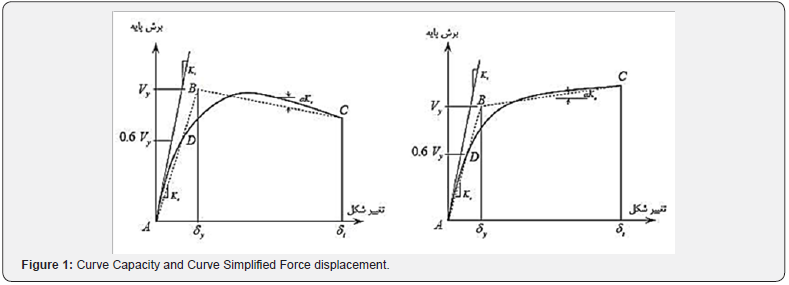
In (3-2), Ti is the principal construction time, assuming linear behavior, which is calculated using (3-3). e K are the effective side effects of the building and i K are the hardness of the elastic structure of the structure. Ki and Ke are calculated from the bilinear diagram of the structural capacity curve. In Figure 2, a sample of how to determine these two parameters is shown.
In order to obtain the effective main Te e period, the structural capacity curve must be modeled bilinearly. In accordance with FEMA-356, this bilinear curve must be designed to:

In order to obtain the effective main e T e period, the structural capacity curve must be modeled bilinearly. In accordance with FEMA-356, this bilinear curve must be designed to:
The surface below the structural capacity curve and the surface under its bilinear curve are equal. The coordinates of the point of intersection of the tangent line drawn in the elastic region with the initial gradient of the effective elastic hardness ( Ke ) and the capacity curve on the vertical coordinate axis (force) is equal to the value of the feed shear force of 0.6.
Initially, due to the lack of results, it is impossible to calculate
Ke and Ki . Therefore, in the first stage, Te
is considered to be Ti and the validity of this hypothesis is controlled after nonlinear
static analysis and, if necessary, corrected. In the above relation,
 represents the maximum elastic displacement of the
system is a degree of freedom, which, by multiplying it in the
coefficient 0 C , transforms the elastic position of the system into
several degrees of freedom. In this regard, a S and e T are the
equivalent spectral acceleration and effective period of the system,
respectively, of a degree of freedom. Correction factor 0 C for the
relationship between the spatial displacements of the system. A
degree of freedom to change the roofing of the system is a degree
of freedom to change the roof position of a multi-degree freedom
system, which is one of two values:
a) Coefficient of participation of the first mode.
b) Table values (3-1)
If using Table 1, it is important to pay attention to the following points: Linear intrusion should be used to calculate the mean values. In the case of shear structures, buildings of all classes have a relative displacement smaller than the lower one.
In (3-1), C1 , the correction coefficient is used to convert linear displacement to nonlinear displacement. These coefficients are calculated from equation (3-4).


Relationship (3-4) shows that for high-rise buildings whose
natural period is high, the maximum linear displacement and
maximum nonlinear displacement are equal, but in smaller
buildings with a shorter natural period, maximum linear
displacement and non-linear equations and should be calculated.
In (3.4), R is the reduction coefficient of the resistance  calculated from (3-5):

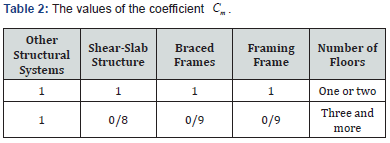
In this regard Sa is the spatial acceleration for effective time, W is the structural weight, Vyis the yield depletion obtained from the bilinear model of the displacement force curve obtained from the nonlinear static analysis ( Vy/W ratio of the yield limit to the effective weight of the structure In the first mode). Cm is the effective mass coefficient of the first mode, and its values can be calculated from Table 2 or from the dynamic analysis. If the main period of the structure is greater than 1 second, the coefficient Cm is considered to be one [7].
Since, in the event of intense earthquakes, most structural elements enter the nonlinear region, the members in this limitation decrease the hardness and decrease the resistance, according to (15-2), C2 , the correction coefficient to consider the shape The hysteresis curve decreases the stiffness and decreases the strength of the structural members over the maximum displacement. These coefficients are according to the level of building performance, frame type and period of the structure equal to the values of Table 3. In this table, the Type-1 frame consists of structural systems in which more than 30% of the lateral load is tolerated by the members who have reduced hardness and resistance during the earthquake.

In the event of severe earthquakes, most members of the structure enter the nonlinear region and, due to the effect of P-Δ, suffer from large deformities. Therefore, the correction factor C∂ is to take into account the increased variation of the dynamics caused by the dynamic effects of P-Δ. The coefficient C∂ depends on the gradient of the bilinear diagram in the non-elastic region. In the case of a slope of this positive line, the coefficient C∂ is equal to 1, and for the structures in which the non-elastic section of the gradient of the bilinear diagram is negative, the relation (3- 6) becomes:

α in the above relation, the coefficient is dependent on soil type. In the process of modeling and nonlinear static analysis of the studied structures, nonlinear behavior of seismic members is considered. The behavioral model chosen for a structurally shaped member should have the following conditions [8]:
a. A member has a linear behavior in a given range
b. Enter the nonlinear region after passing through the linear region
c. After each full cycle, the load and load of the member will be reduced and the power dissipation of the member will be reduced after each loading and loading cycle.
d. After the member has reached a certain tension level, it will be broken.
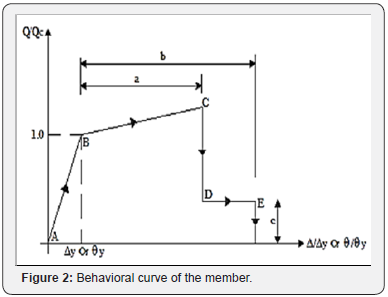
Considering all of these conditions for shaped members, there is another problem; this behavioral model is more important in nonlinear dynamic analysis, not in static nonlinear analysis, since in this earthquake frequency content analysis, loading loading cycles can not be raised. To solve the problem of determining the behavioral curve for structural members, the ATC and FEMA regulations use the spinal curve of each member as a behavioral curve for that member. This curve is in fact the same as the curvature of the member hysteresis in the first quadrant of the coordinate system. Figure 1 shows the nonlinear behavior of seismic members in the software based on the seismic improvement of existing structures (Journal 360) and the FEMA- 356 instruction to illustrate the behavior of plastic joints. In area A to B, elastic behavior is linear. Point B shows the delivery point. In area B to C, the submission occurs with strain hardening. Point C represents the final capacity, and at this point the member loses the lateral load, but can withstand gravity. In the C to D region, resistance to the lateral load is observed. Point D indicates residual resistance. Finally, at point E, it also loses the ability to withstand gravity loads and is completely disconnected (Figure 2) [9].
The upper and lower limits of gravity load are defined by two combinations of loading in accordance with relations (7-3) and (8-3):

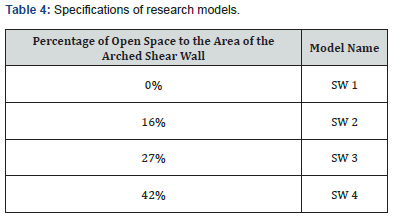
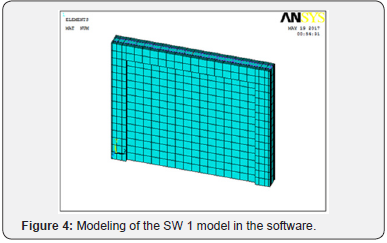
In the above relations, QD D is dead and QL is the effective live weight of the structure. Numerical Modeling: In this chapter, based on the reliability of the modeling carried out in the previous chapter, four concrete flexural concrete frame structures with a reinforced shear wall are designed in accordance with valid regulations. It is then modeled by applying a change in percentage of open space with a finite element software. In the next step, by performing a hysteresis analysis, the energy attraction and the complexity of the system will be investigated. In Table 4, the characteristics of the models examined are shown in this study. In this study, the unit is the length, meter and unit of power, Newton [10-12].
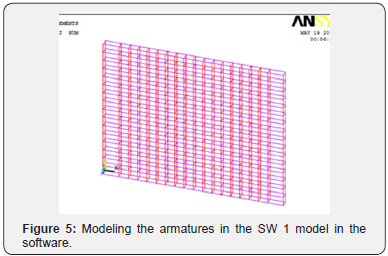
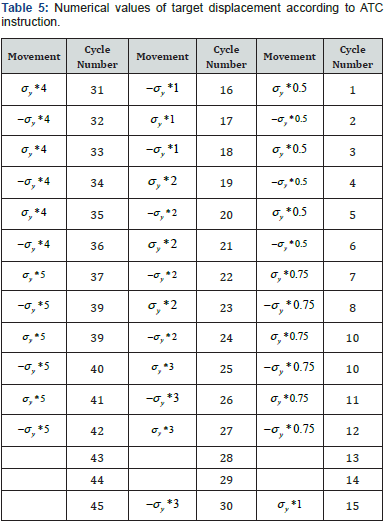
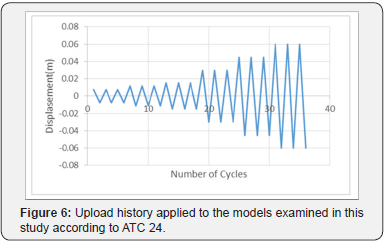
In order to study the cycle behavior of the system under review, this study was loaded using loading cycles shown in Figure 3. Where σy is the displacement of the structure surrender (Figure 4&5) (Table 5).

Review the model
In this part of the paper, considering the reliability of the modeling carried out in Ansys software, the model is discussed.
In order to study the cyclic behavior (hysteresis), the models studied in this study, based on the ATC rule 24, first obtained the displacement of the surrender of the model, then we obtain the displacement and the number of loading cycles.
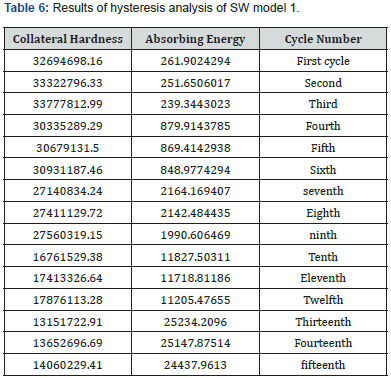
In SW 1, the displacement value of the structure is 0.015m, according to which loading history is obtained according to the diagram (2-4) (Figure 6) (Table 6).
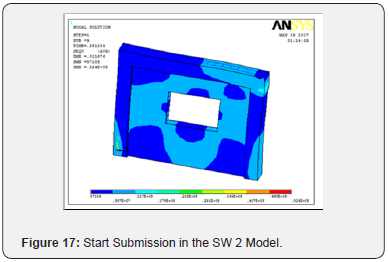
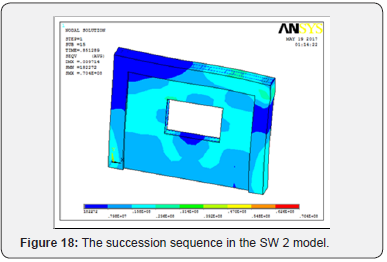
The moment of submission: In the study of the start of the place of submission and the onset of nonlinear behavior of structural components, it is observed that in the model examined, the submission area started after the cracking of the concrete from the steel reinforcements and started gradually at the point of attachment of the beam to the plastic joint joint is. It is also observed that in the points of connection cracking and crushing occurred in concrete [13,14] (Figure 7-12).
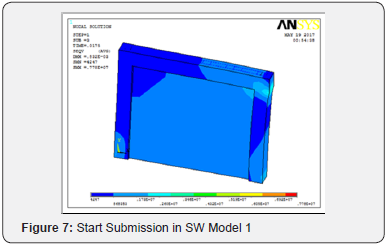

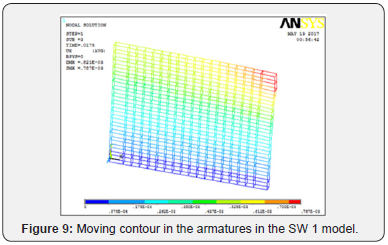
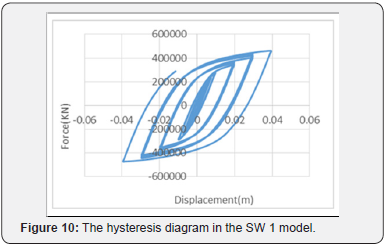
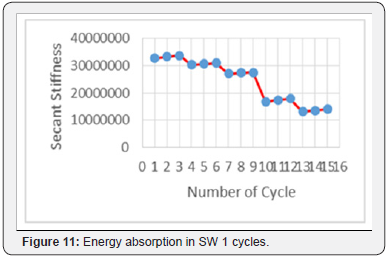
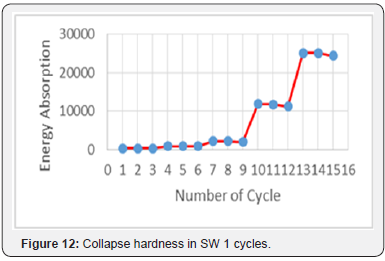
In the study of the beginning of the place of submission and the onset of nonlinear behavior of structural components, it is observed that in the model under consideration, due to the increase in the level of opening in the submission area, after the abandonment of the corrosion and crushing of concrete started from the beam and gradually began to be at the point of the beam to the column Plastic joint is formed. It is also observed that in the points of connection cracking and crushing occurred in concrete.
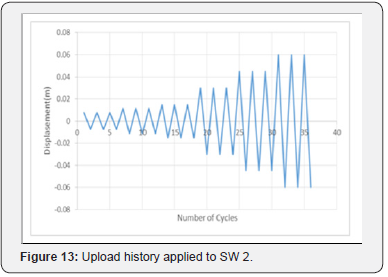
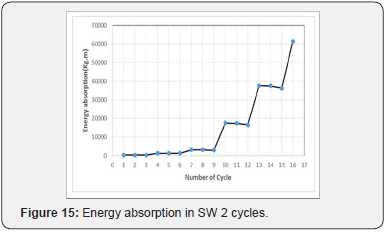
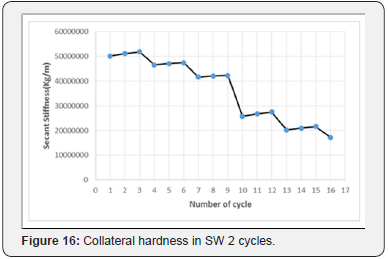
In SW 2, the displacement value of the structure is 0.015m, according to which load history is shown in (Figure 13-19).


Conclusion
By decreasing the area, we see a better performance of the system so that the amount of final energy absorption in the system is increased in cycles and collateral hardness, which is considered to be a good cyclic performance. By examining the surrender, it is observed that the decrease in the area of the opening and the way in which the succession began and its sequencing was more regularized, and the submission points were distributed in a more environment that improved the system’s performance and prevented the concentration of stress at specific points. In spite of the armature, we see a later submission of the pillar so that even the fracture and crushing in the column has decreased, and with this method, the submission has occurred more in the beam and the rule of the strong column is weak. In all modules, the surrender begins at the foot of the structure, while with increasing length, its location moves above the structure in the beam and is propagated in the connection spring and begins at a wider level.
Offers
Due to the wide range of researches and the novelty of this research, it is not possible to address all the details. On the other hand, addressing all aspects will remove us from the research objectives. So, there are suggestions for completing the research on this system, which are:
It is suggested that the wall reinforcement effect using GFRP fibers be specially designed on the shear wall system.
It is suggested that the behavior coefficient for concrete structures with a concrete shear wall SW should be explored and extracted.
References
- Morshad Reza, Anahita Ajang, Fataneh Elbandi (1394) Design principles of concrete shear walls with opening using a bobbond model. 10th International Congress on Civil Engineering, Tabriz, Tabriz University, Faculty of Civil Engineering,
- Akiyama H (1985) Earthquake Resistant Limit-State Design for Buildings. University of Tokyo 14(1): 148.
- Shen J, Akbas B (2000) Energy approach in performance based earthquake resistant design (PB-EQRD European Conference on Earthquake Engineering.
- (1393) Design of Buildings against Earthquake, Standard 2800, Fourth Edition.
- Ghasemi, Mohammad Reza, Seyyed Sajad Mousavi Amjad, Ali Sallagheke (2011) Sixth National Congress of Civil Engineering, Semnan, Semnan University.
- Mahdavi Pour Amjad, Seyyedatta, Masoud Talebian (1395) Investigation of the effect of concrete placement and concrete position on the relative displacement of concrete structures, third international conference on new achievements in civil engineering, architecture and urban management, Tehran, International Confederation of Inventors of the World (IFIA).
- Hasofer AM, Lind NC (1974) Exact and invariant second-moment code format. Journal of the Engineering Mechanics Division 100(1): 111- 121.
- Dan D, Fabian A, Stoian V (2011) Nonlinear behavior of composite shear walls with vertical steel encased profiles. Engineering Structures 33(10): 2794-2804.
- Krwinkler H (1997) Advancing performance based earthquake engineering. National Information Service for Earthquake Engineering.
- http://nisee.berkeley.edu/library/
- Rackwitz R, Flessler B (1978) Structural reliability under combined random load sequences. Computers & Structures 9(5): 489-494.
- Hwang HH, Low YK (1989) Seismic reliability analysis of plane frame structures. Probabilistic engineering mechanics 4(2): 74-84.
- FEMA (2009) Quantification of building seismic performance factors. FEMA P695, Federal Emergency Management Agency, Washington, DC.
- NEHRP Recommended Provisions (2004) Part 2: Seismic regulations for new buildings and other structures, FEMA, 2003 Edition.


